Test Bench 1.5 - Tactile Force, Pre-Travel, and Total Travel
R&D Article
This article investigates our process for creating the new "Main Button" mouse test. This test aims to provide actuation data to help you decide which mouse is right for you. Using a force testing machine, we test four points three times each along the main mouse button and provide an actuation graph, a force/distance graph, and switch information, including type and model. We created this test using data from over 24 mice, analyzing aspects like actuation abnormalities, influence of mouse construction, debounce, and more. Despite some limitations, the test provides important data for making informed decisions based on your actuation preferences.
Problem Definition
The Problem
We've identified that our mouse reviews are missing important information about switches and main mouse button actuation. Many people want to know what type of switches (and potentially the exact switch model) the main buttons use, as well as the tactile force and distances associated with the main button click. This test bench update aims to provide the main mouse button actuation data and switch information. The aim is to provide information to help people better decide which mouse is right for them.
Evidence
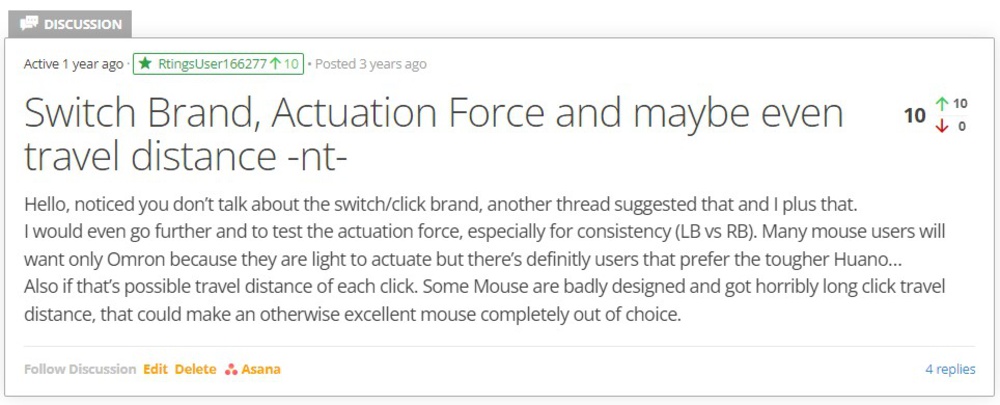
Mouse enthusiasts talk about and compare different mouse switches, which shows that they would benefit from being provided with this information. Many of these people would like to know the tactile force of a mouse button before purchasing. This can be because of preference, injury, or even disability. Below is a comment from RtingsUser166277, who suggests we include actuation and switch information in our review.
Other threads requesting mouse actuation force:
- RTINGS.com Thread 1 (screenshot above)
- RTINGS.com Thread 2
- Reddit Thread 1
- Reddit Thread 2
Note: Most of the enthusiast mouse community online refers to what we call 'tactile' force as 'actuation' force. We cover this in a later section and explore why we chose to use tactile force.
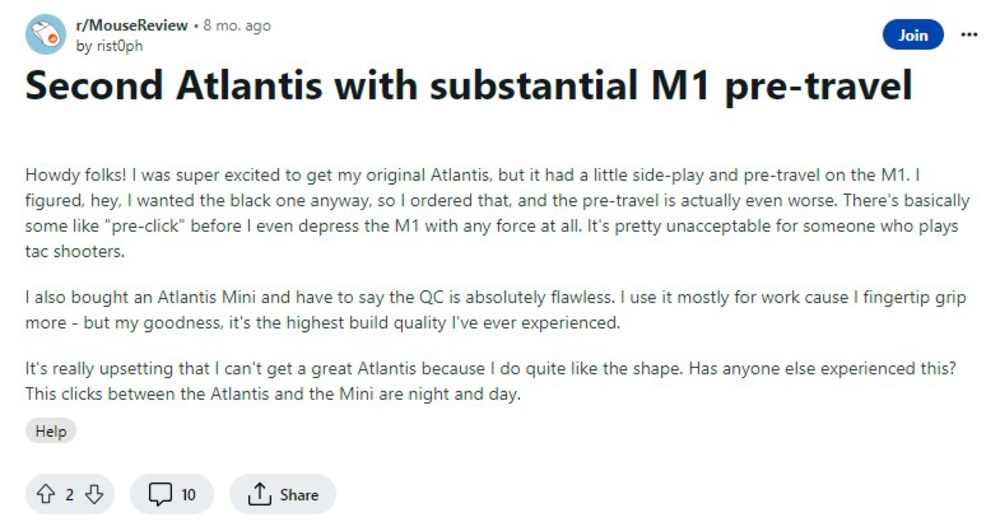
Other common complaints are about specific mice and how the main button performs. A good example is the LAMZU Atlantis, where many owners have identified a small initial "click" during the pre-travel movement before the click that actuates the mouse. Figure 2 shows a Reddit user who experienced this issue with their LAMZU Atlantis. One of the aims of creating our new actuation test is to be able to highlight these abnormal characteristics.
Aspects We Won't Be Addressing
Of the comments/feedback, one aspect that we won't cover in this update is the issue of double clicks. This issue is often specifically raised when discussing mice with mechanical switches; we aren't addressing this issue in this update because this relates more to quality control than the actual mouse characteristics.
Another aspect we won't address in this test bench update is the switch lifespan rating. Often, manufacturers will advertise a certain number of clicks that a switch is rated to last. Since this is a completely different test, we decided to leave it to the side for now.
Proof Of Success
For this test to be successful, we'd like to show the differentiation between mice that typically have complaints about tactile force or travel distances. We aim to be able to take a mouse that users online have flagged as having abnormal main button actuation and observe the differences in the results. Examples include mice that have been flagged as having a lot of pre/total travel, unusually high/low tactile forces, or issues like the LAMZU Atlantis pre-travel "click." Assuming our mouse units exhibit the issues people have complained about, the graphs should show these results.
Explorations
Choosing The Testing Point
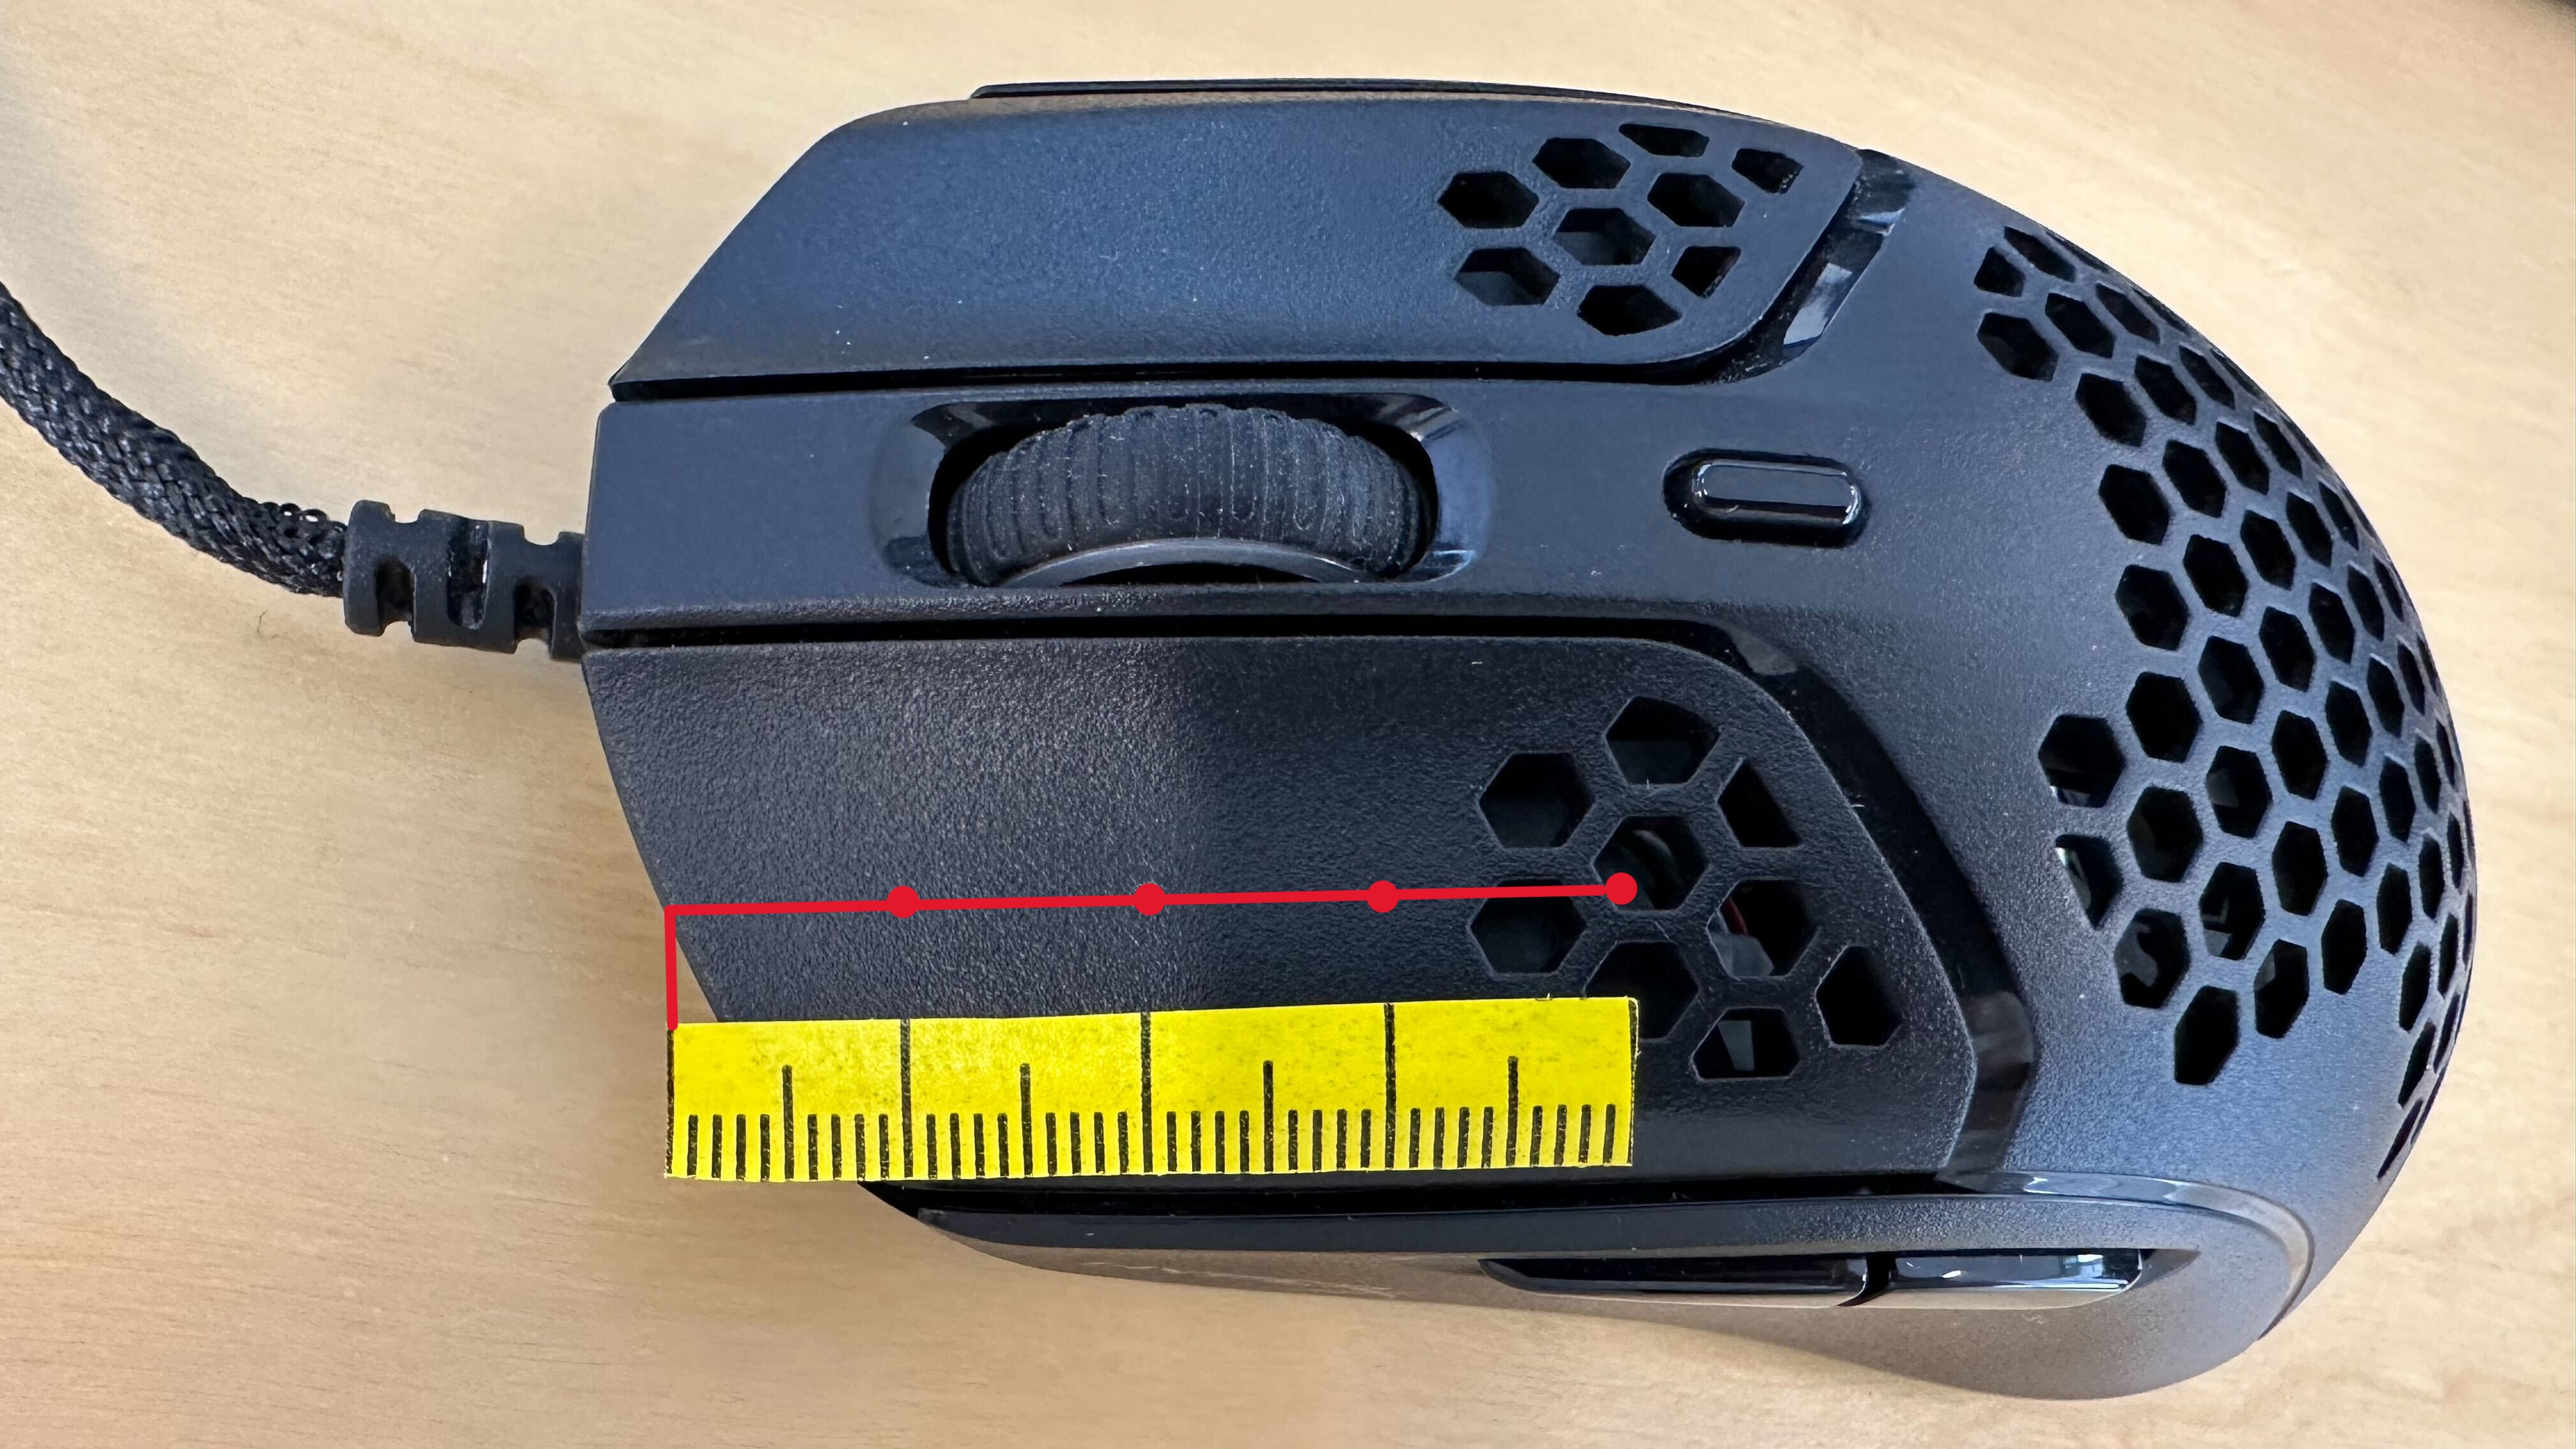
Our original solution for the actuation test was to measure the force/distance values at 1cm from the front of the button. This was an arbitrary point chosen because it was close to where most people would place their finger on a "standard" size mouse. The problem is that mice come in many different shapes and sizes, and people have different hand sizes and grip styles. All of these factors mean that using one point to characterize the actuation of a mouse button is rarely useful. Comparing two mice at 1 cm from the front button might be meaningless if the mice are different sizes. By choosing four points, we can evaluate how the mouse button performs over most of the usable area.
This provides each person with information specific to how they would use the mouse. It also means we can make an informed guess as to how the mouse will perform anywhere between each point using graphs (linear approximation). Regardless of hand size, grip, or mouse size, the information about all actuation points is made available so you can make the best decision for your needs.
Comparing The Angle At Which We Test The Button Press
We considered two approaches for what angle to use for actuation testing: mouse flat and button press straight down or mouse at an angle and perpendicular force applied to the button. We chose to go with the mouse at an angle with perpendicular force applied to the button because we believe it more accurately represents how most people use their fingers to press a mouse button in real-world uses. Additionally, since the load cell is designed for force testing along the vertical axis of the probe, the perpendicular method allows for all the tactile force to be applied to that axis.
Solution
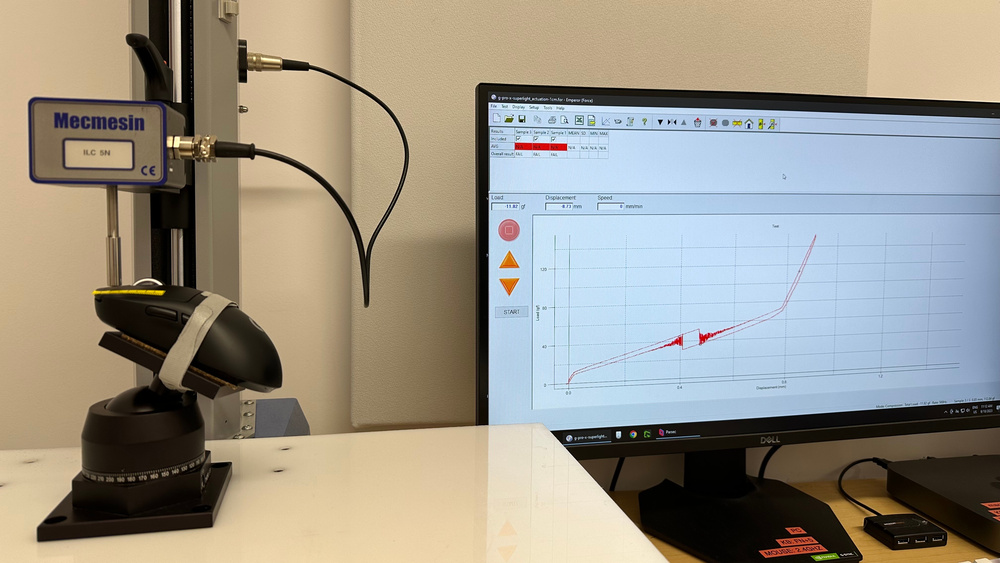
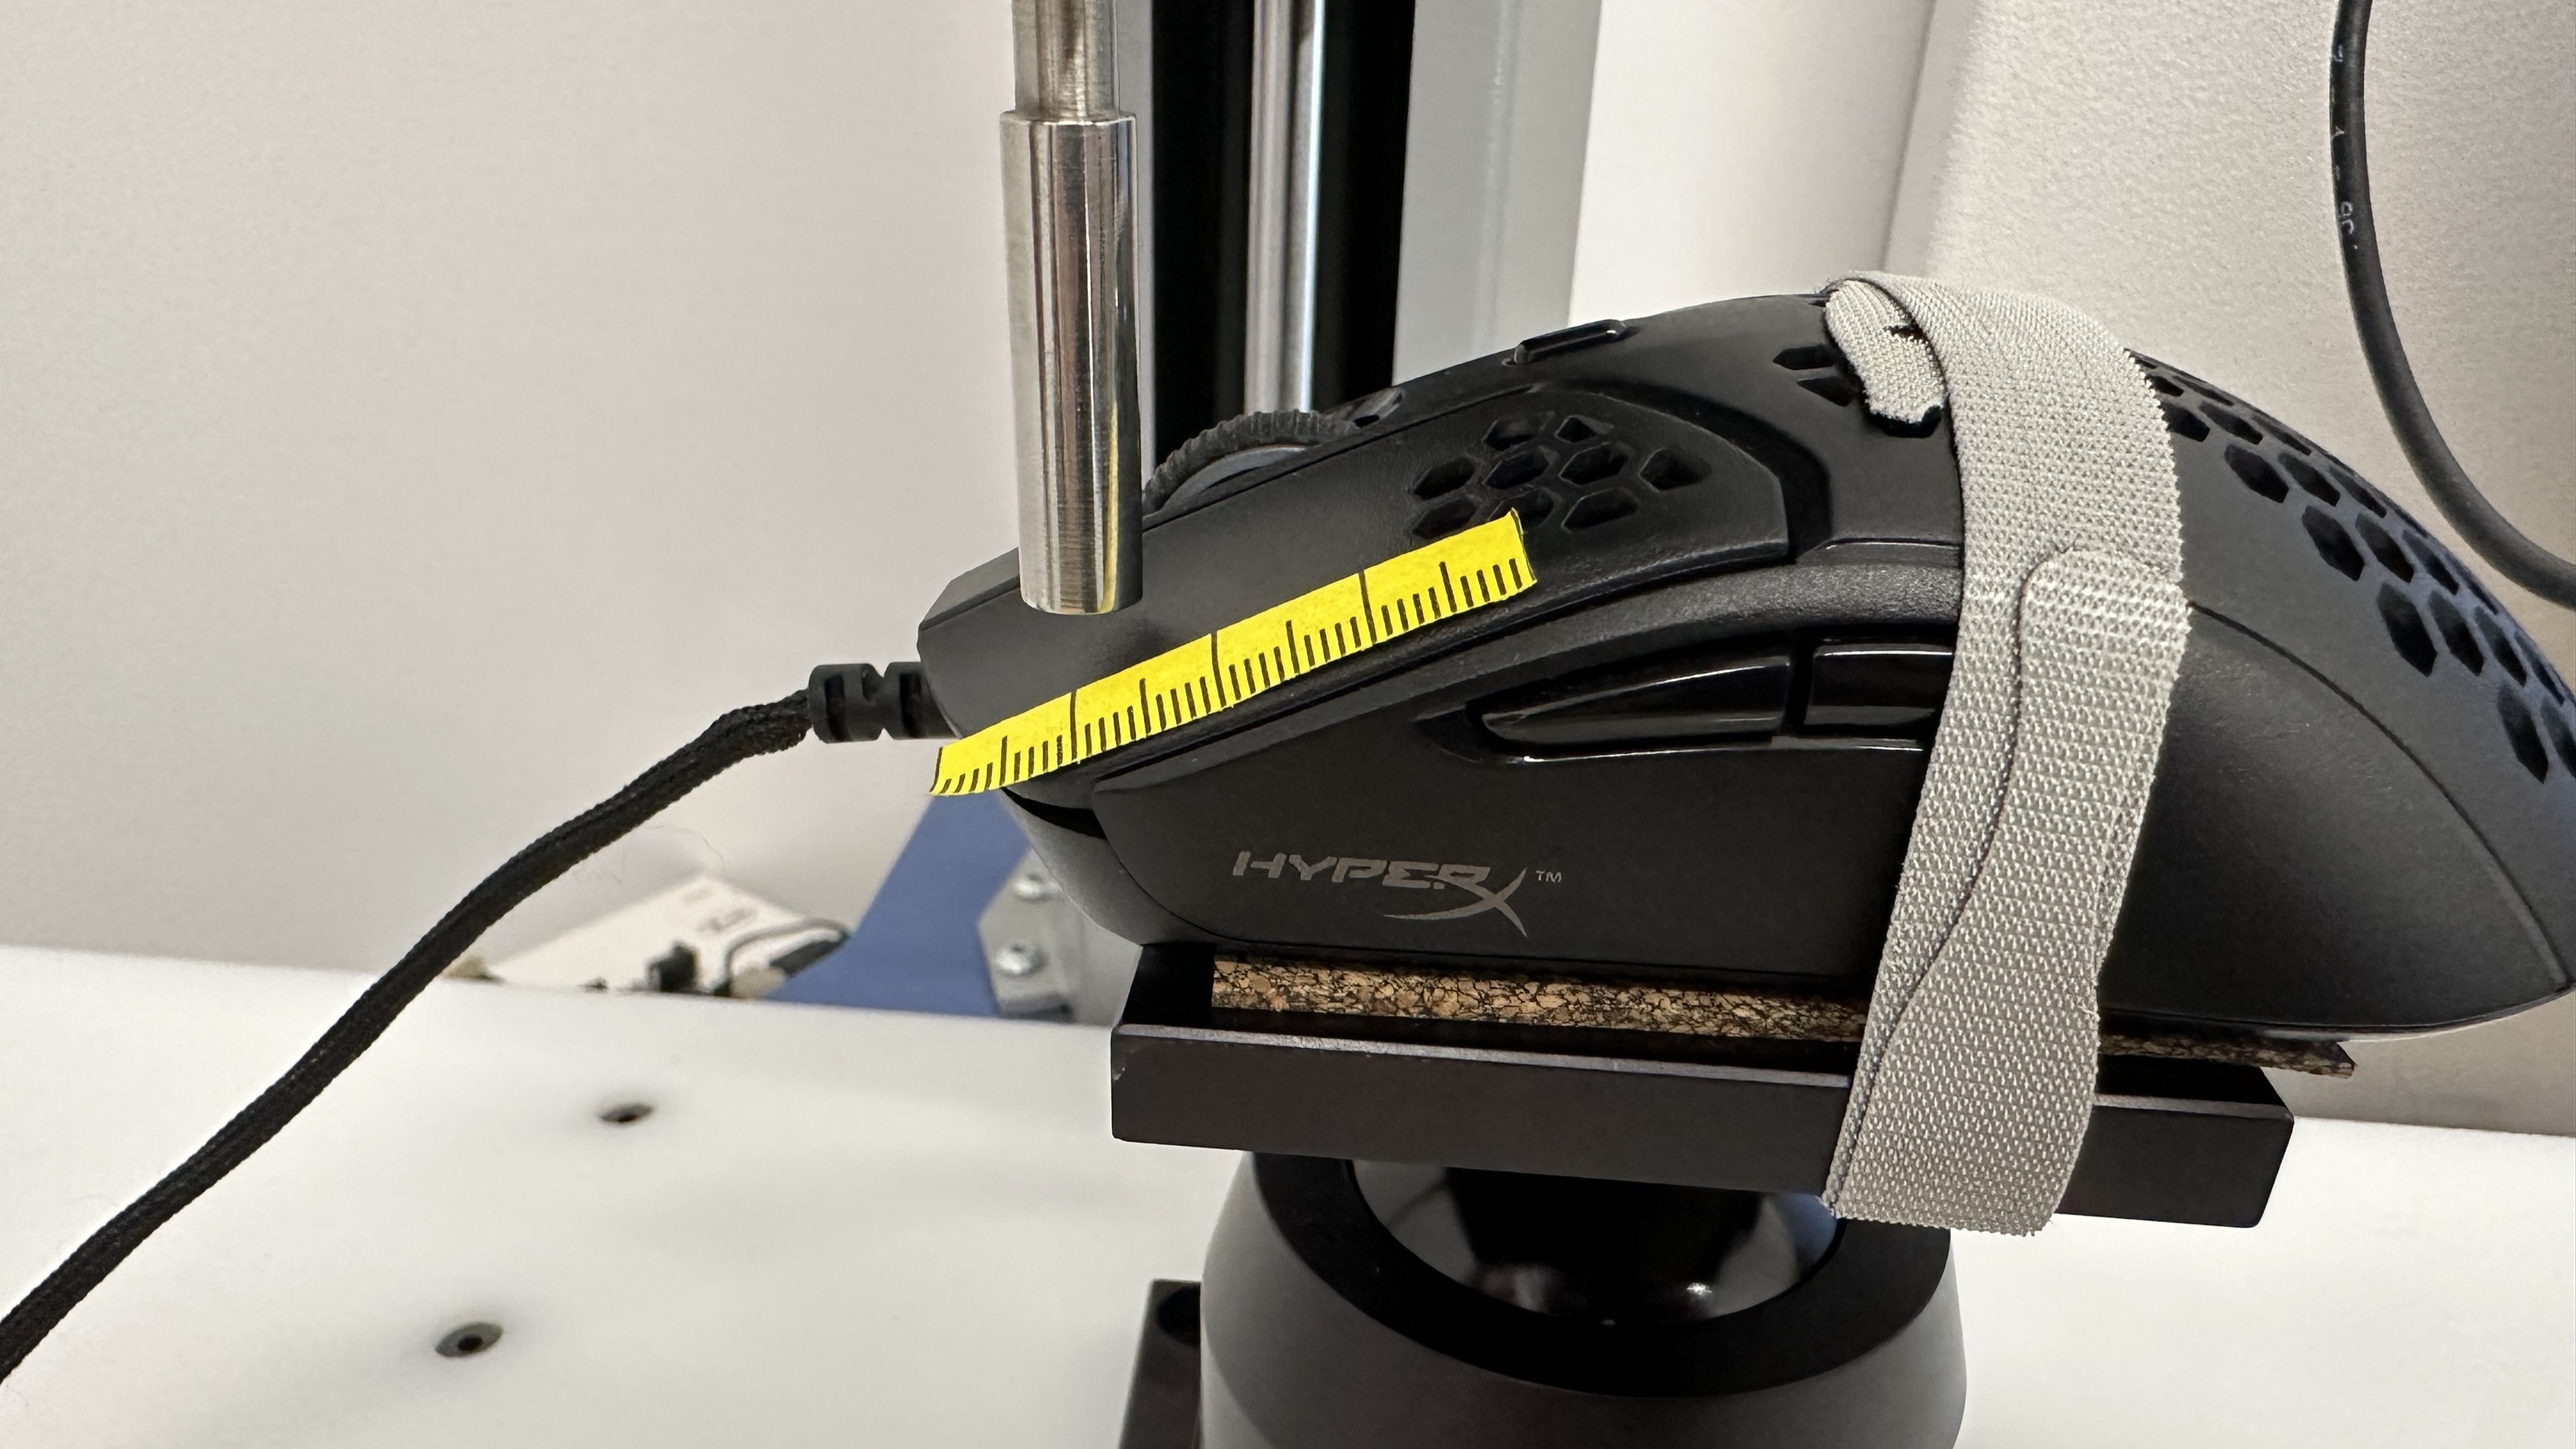
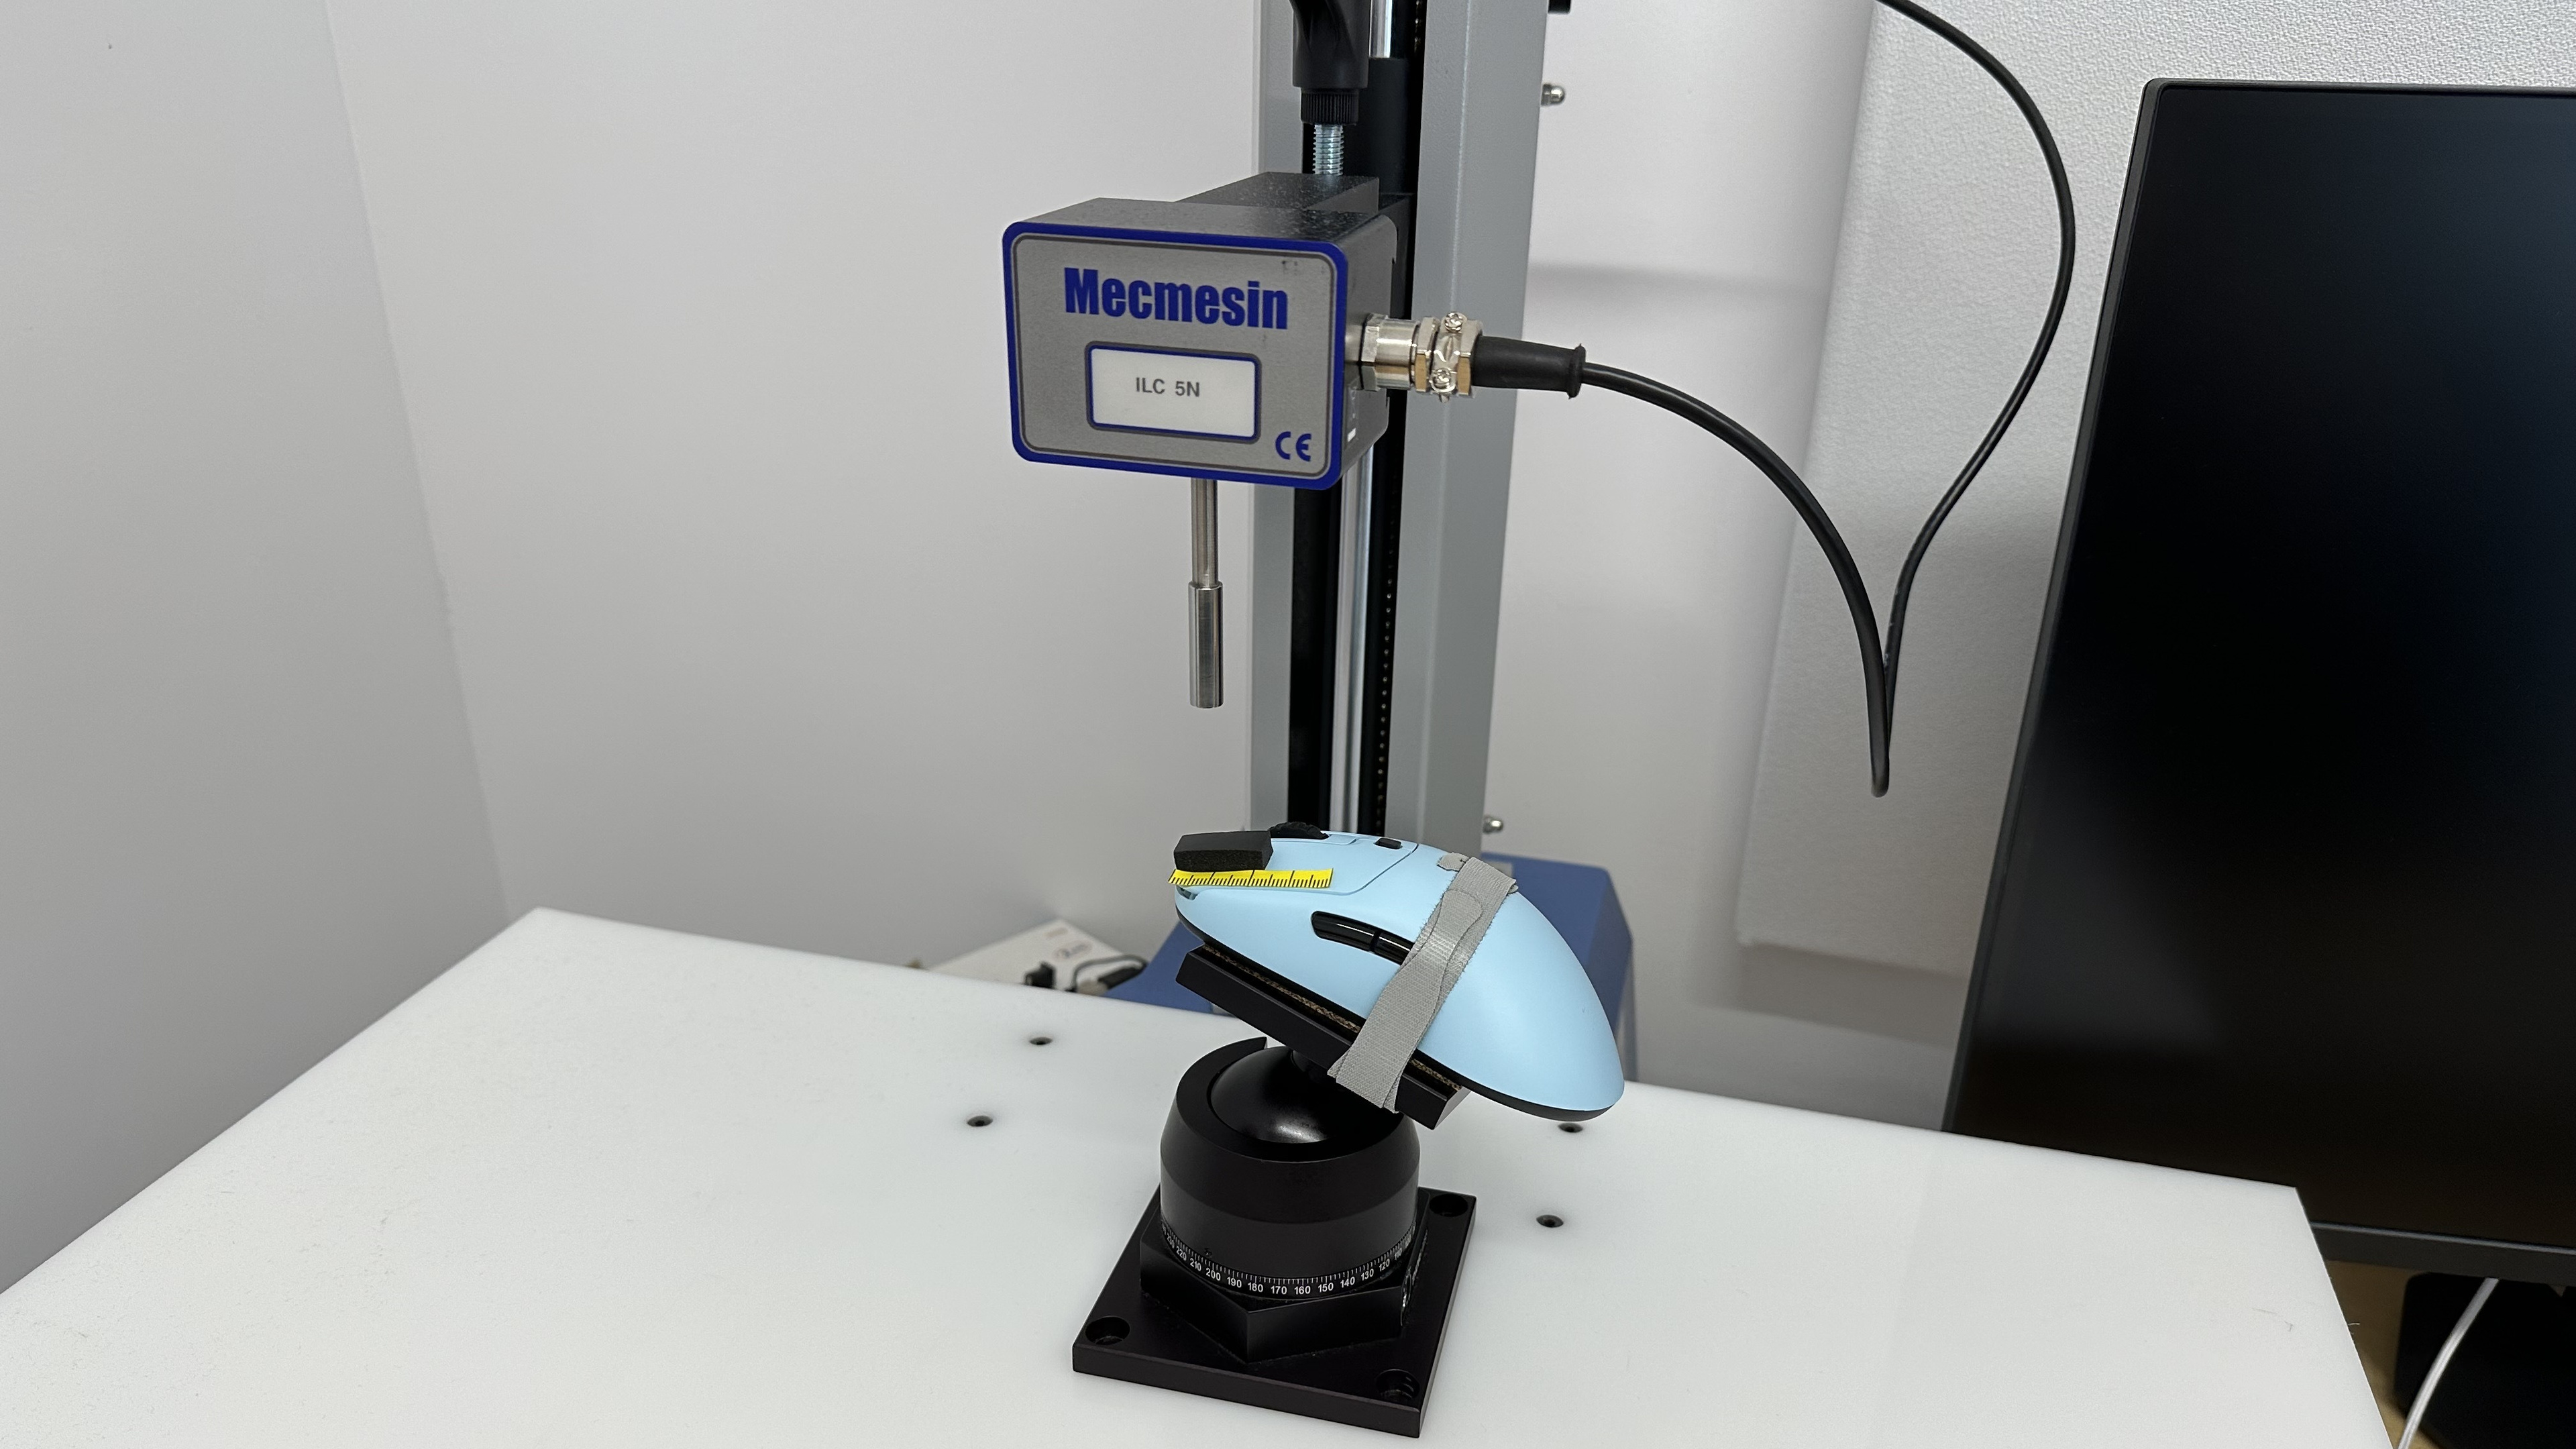
We determined the solution we chose for testing the main button actuation by combining our learnings to create a test that best evaluates how the mouse button will perform. We test each mouse by strapping it to a plate with a ball joint to angle the mouse properly. Using tape with measurements, we test points from 1 to 4 cm from the front of the button, with each point being tested three times. We use our Mecmesin MultiTest-i force testing machine following a similar process to how we test keyboard actuation.

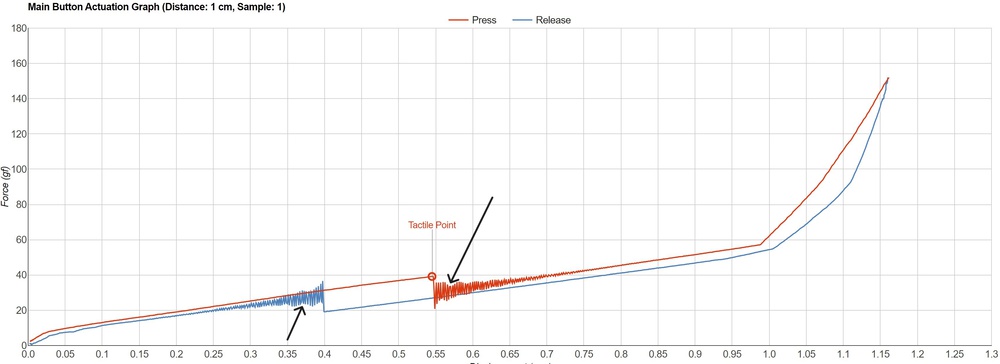
The raw actuation data is collected for each point and used to create two graphs: an actuation graph and a force/distance graph. The actuation graphs are made with the raw actuation data from the first sample at 1 cm from the front of the button. The tactile point is highlighted to make it easy to read the force/distance needed to actuate the main button. The force/distance graphs are made by plotting the average tactile force and pre/total travel distances for each point.
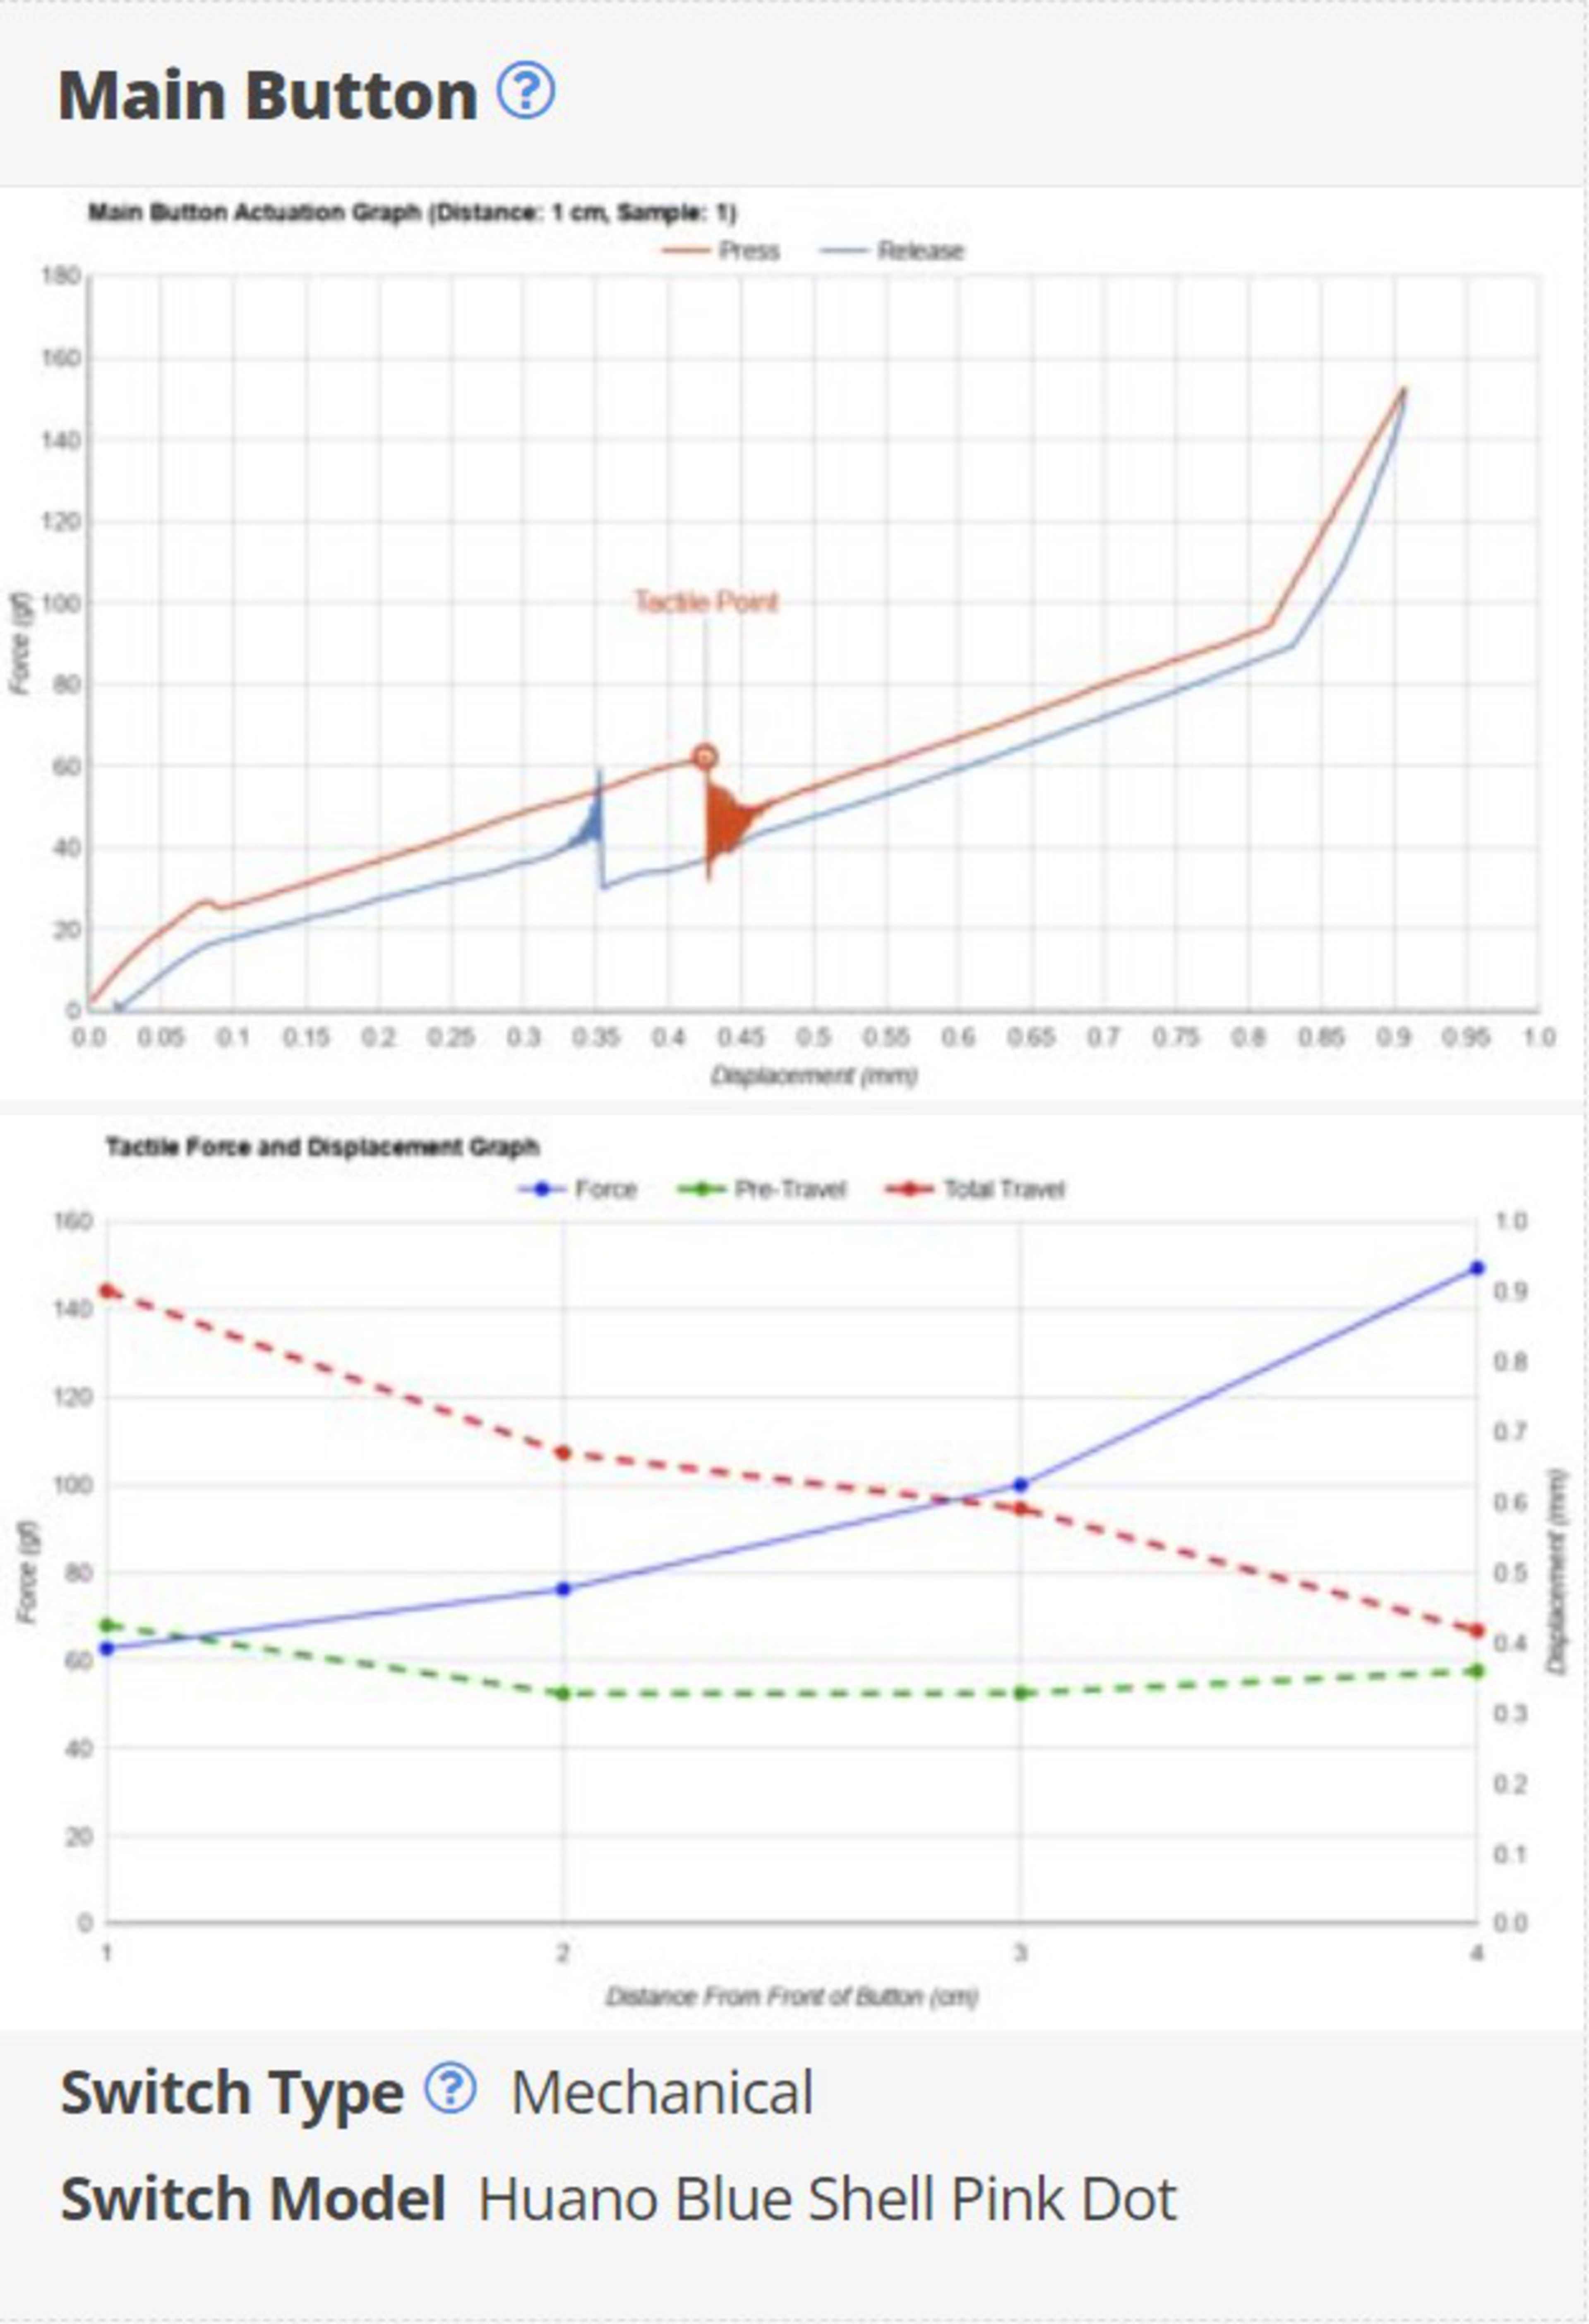
We also include the "Switch Type" and "Switch Model" comparisons. This provides information about the mouse buttons to help people who like/dislike specific switches or their characteristics.
Data Analysis
Observing Actuation Abnormalities
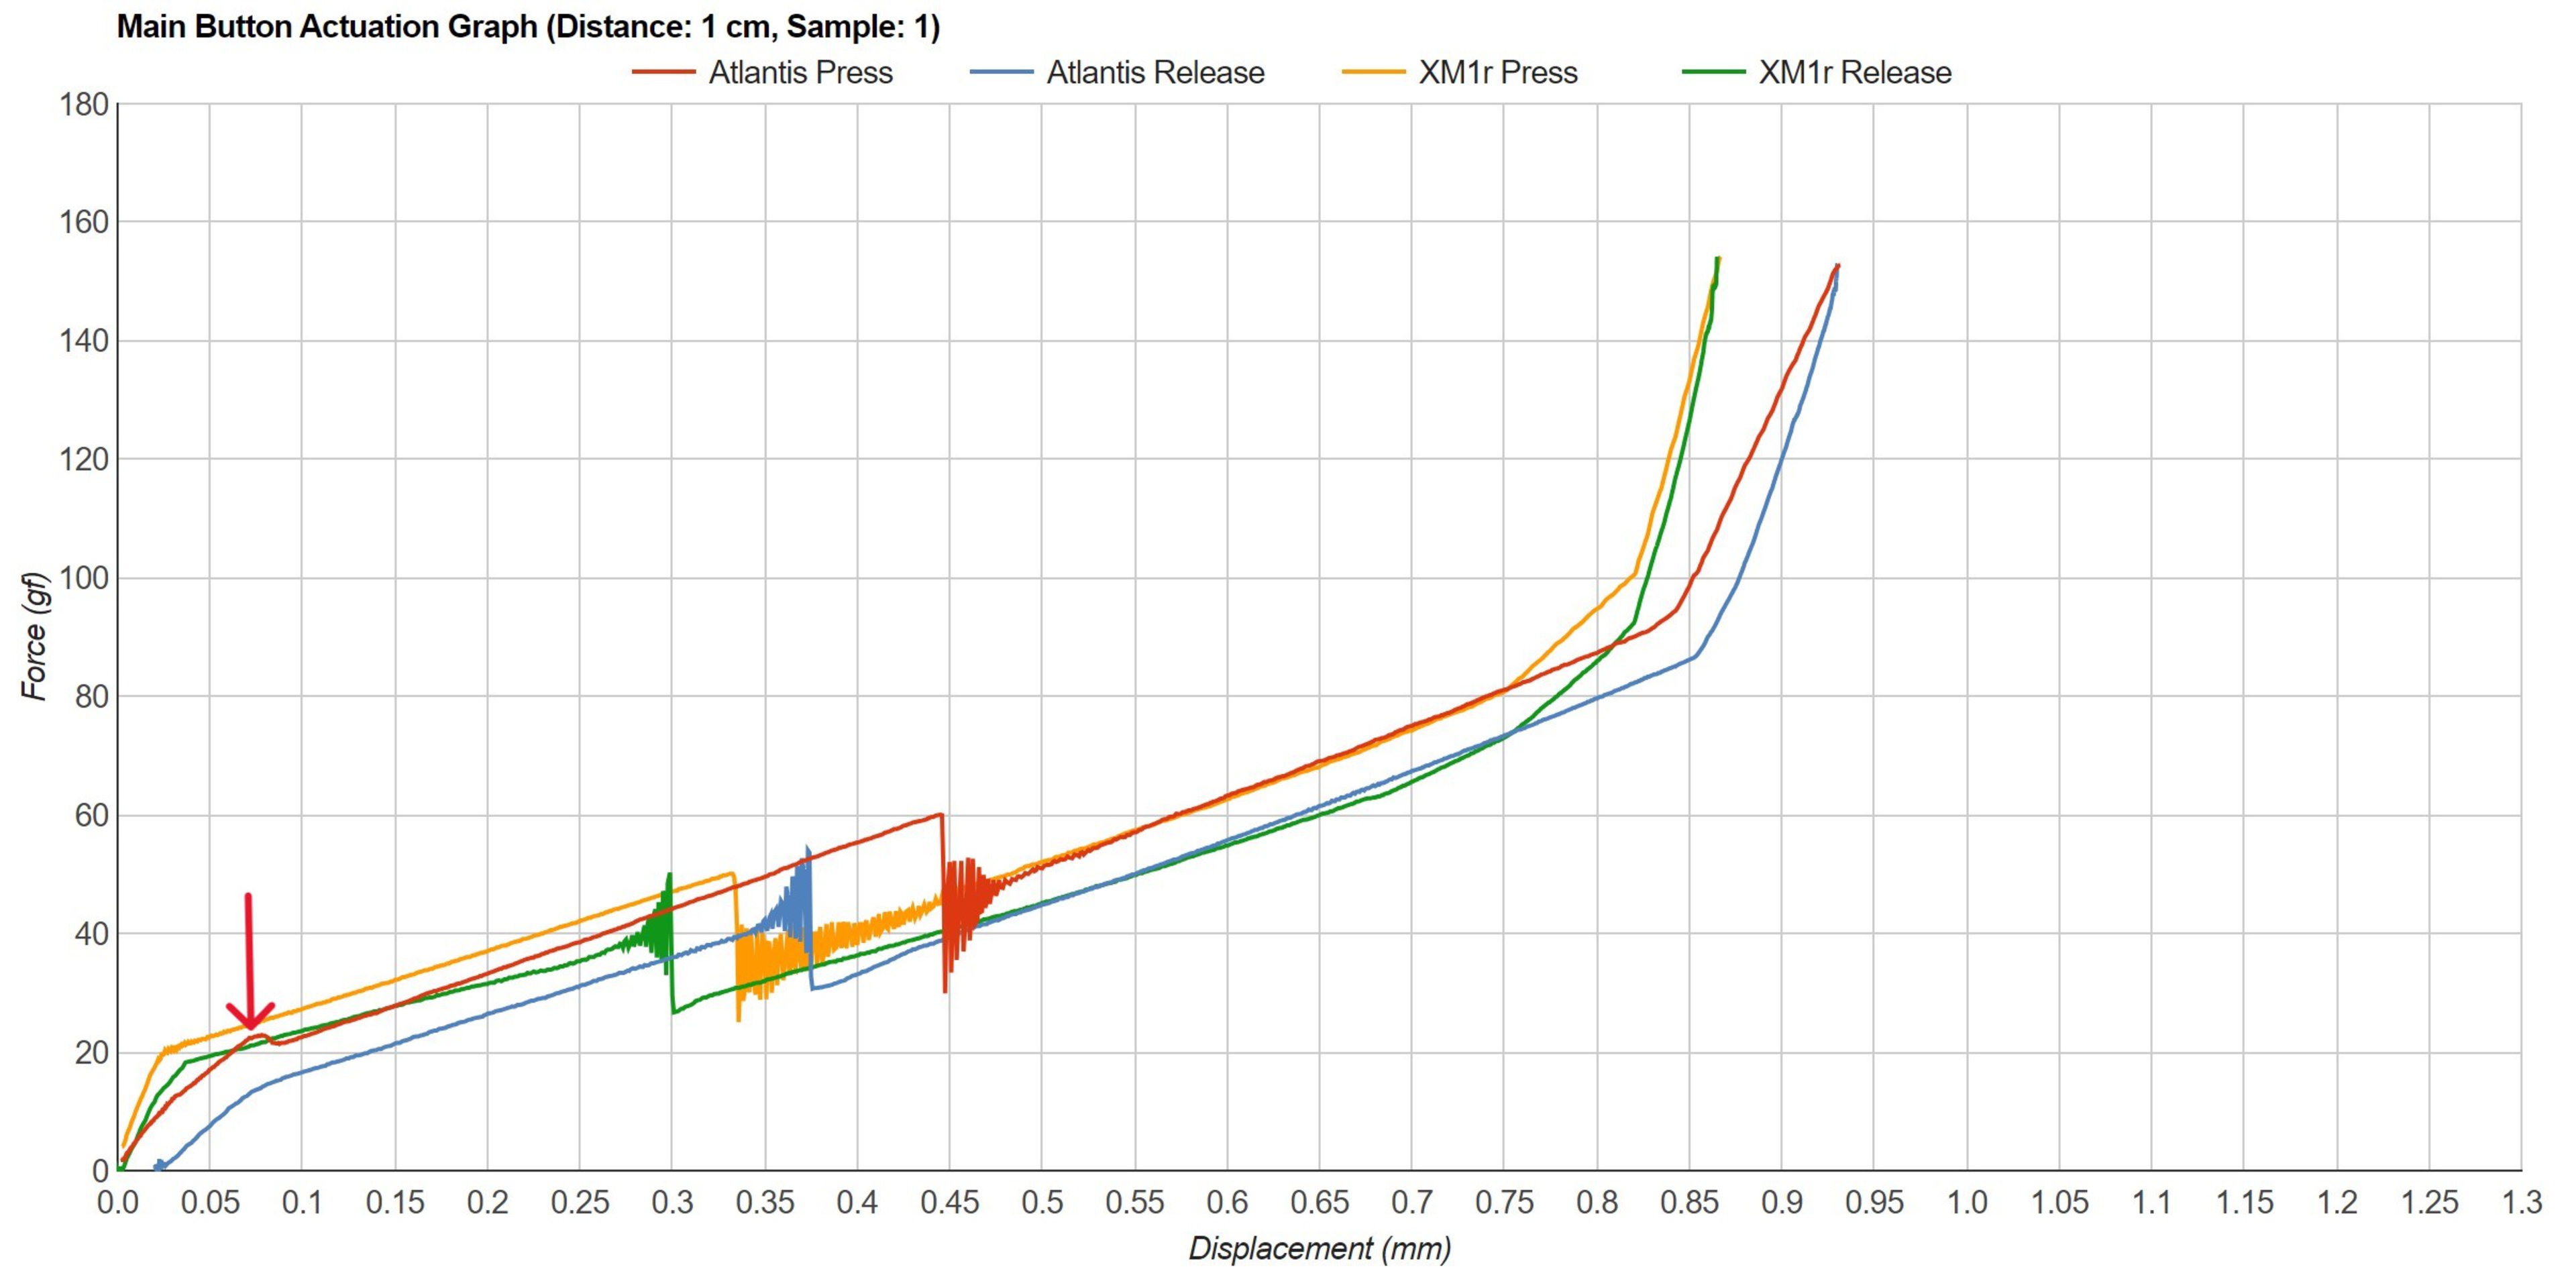
One important goal of this test is to see if we can observe abnormalities in tactile force/distance for mice that have had complaints. The best example is the LAMZU Atlantis, which has had multiple complaints about a small "click" during pre-travel (right when the main button is touched). We could feel the same "click" in our unit that many online have complained about. When we collected the actuation data, the "click" is visible at every spot we tested along the length of the main button. You can see it below on the LAMZU Atlantis press (red curve), where it shows up as a small bump. In comparison, the Endgame Gear XM1r press (yellow curve) does not have the same bump. These graph results are consistent with how our units feel and are a sign that our test can catch even small abnormalities.
Changing From Actuation Force To Tactile Force
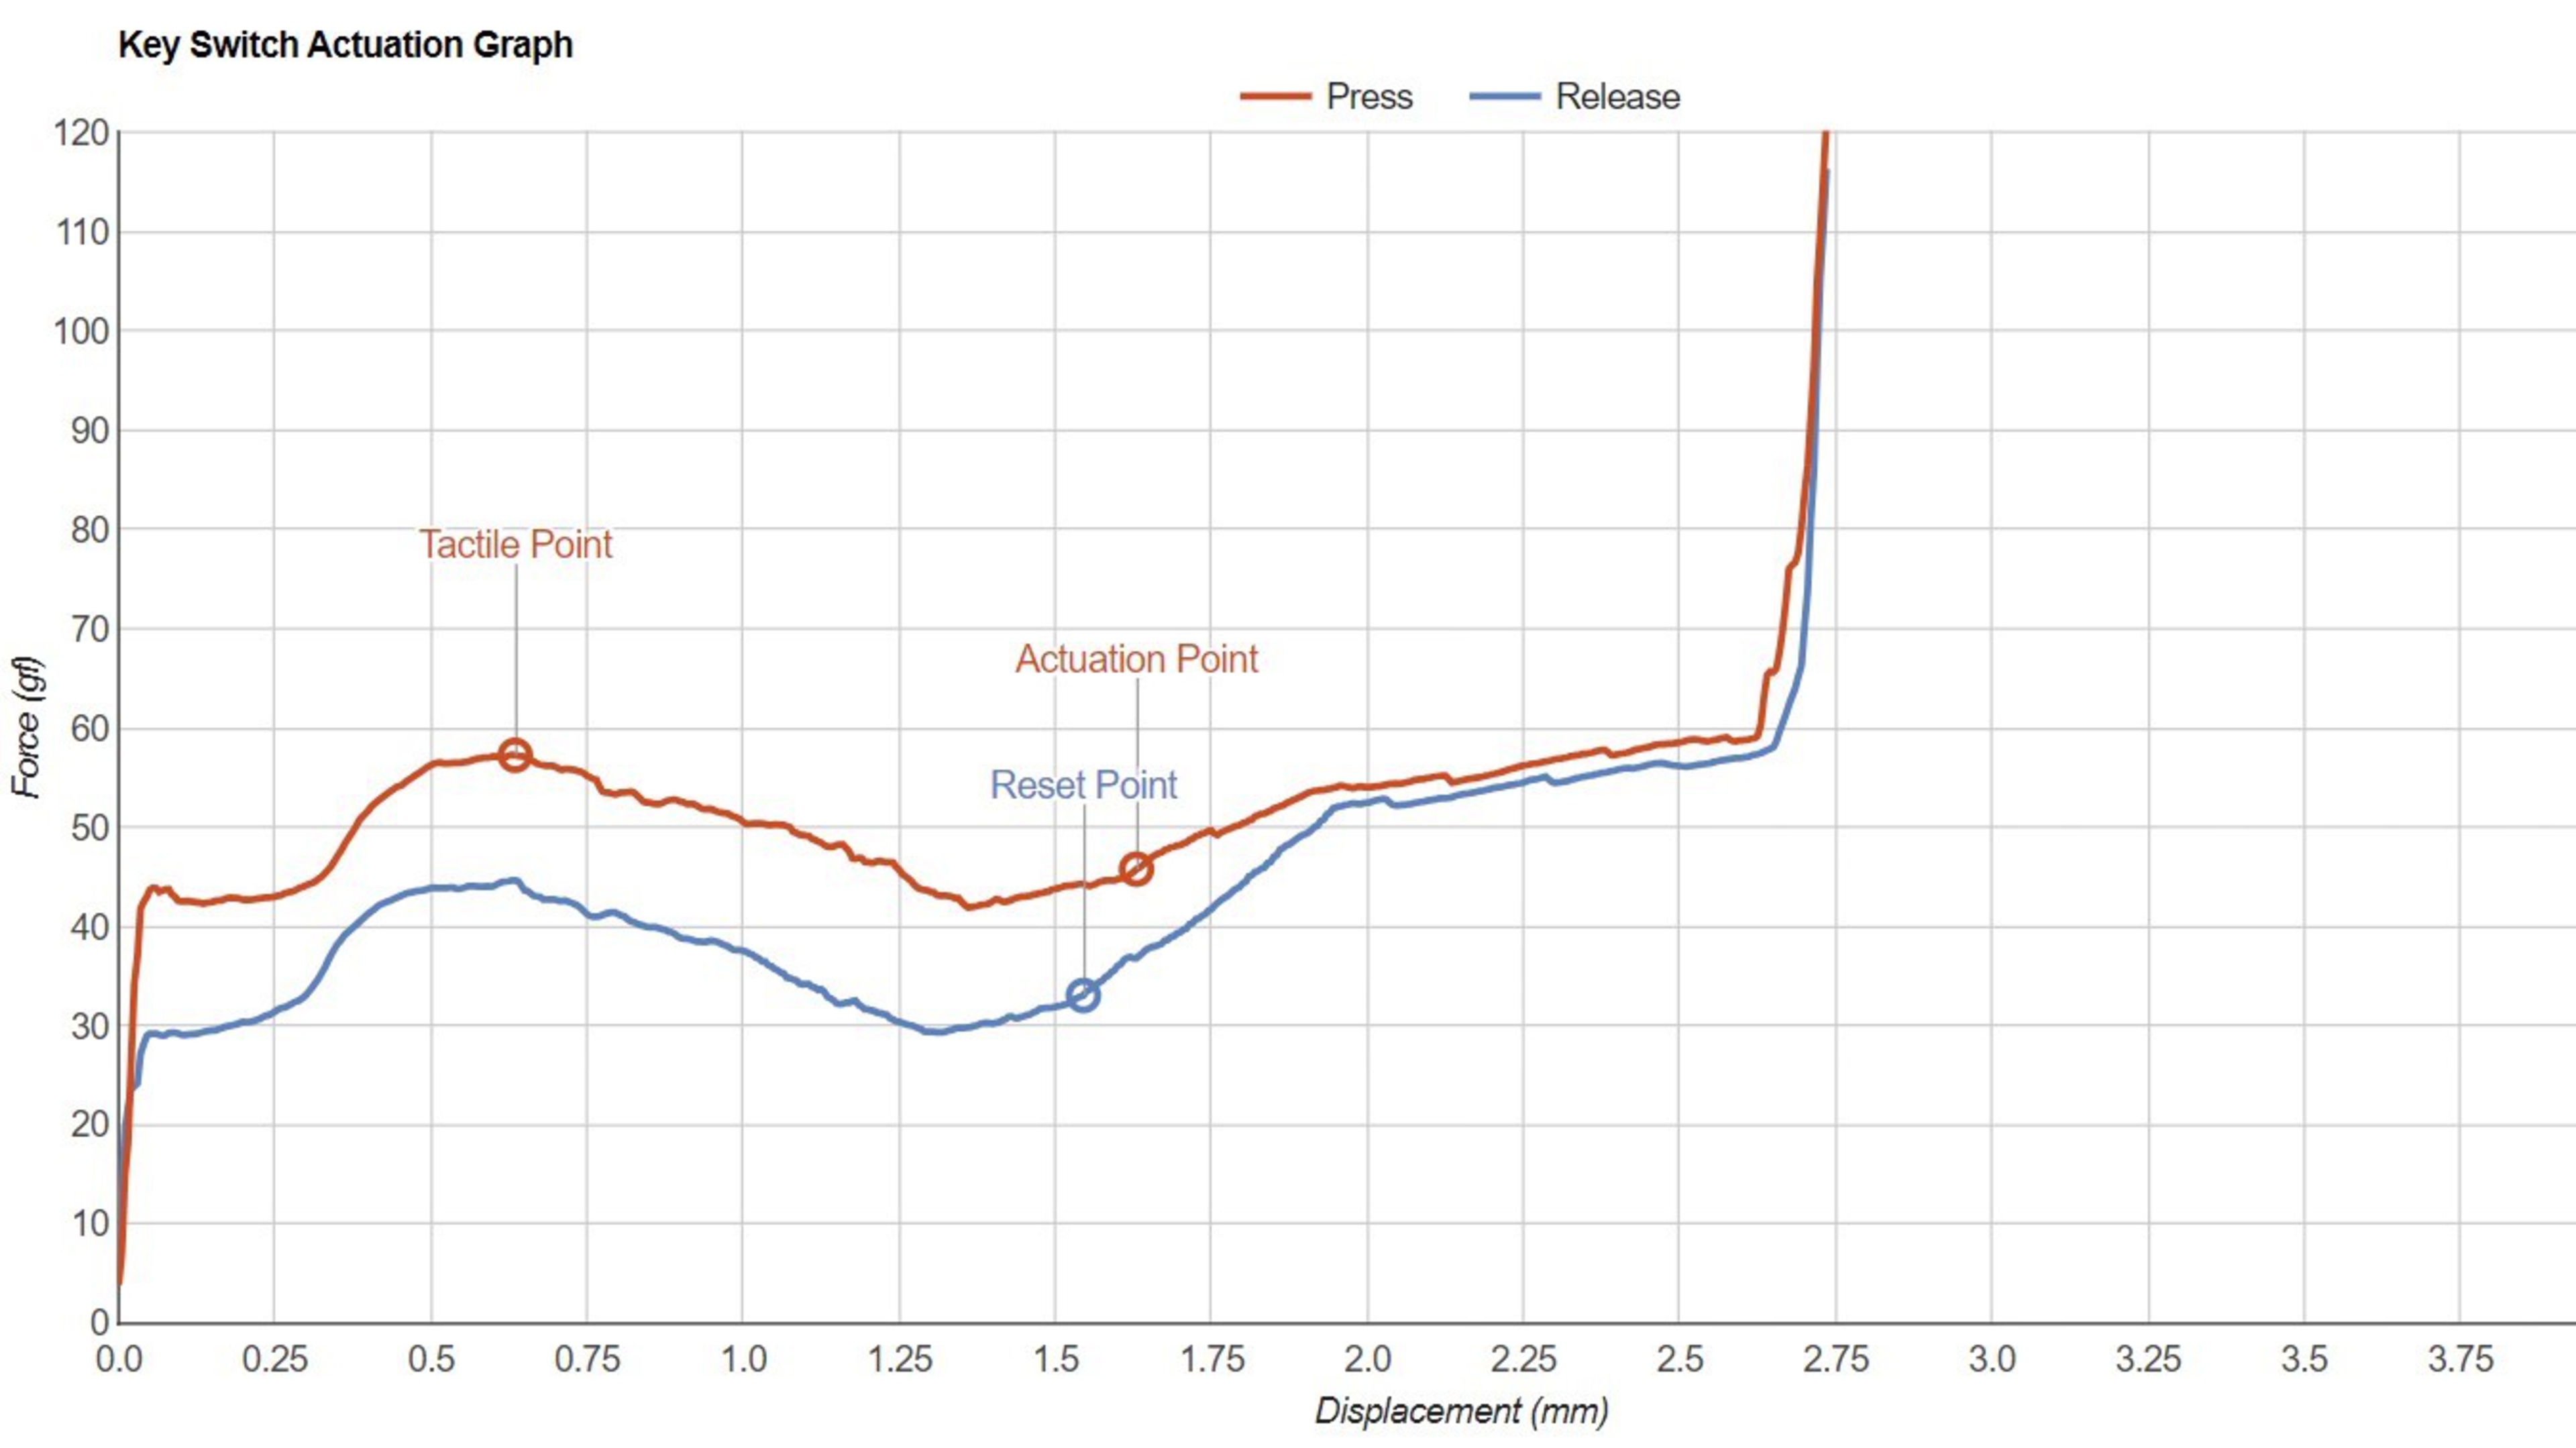
While the actuation point and tactile point of keyboard switches tend to be farther apart, they're typically much closer together for mouse microswitches. Below are examples of typical keyboard (tactile) and mouse actuation graphs. For mice, the actuation point happens immediately after the tactile point. The same goes for the reset point, which happens immediately after the switch pops back up. The most important point along the mouse actuation curve is the tactile point since it's the maximum force needed to overcome to actuate the mouse. Since the time and distance are so small and the force is always lower going from the tactile point to the point of actuation, we can treat the tactile point as the force required to actuate the mouse.
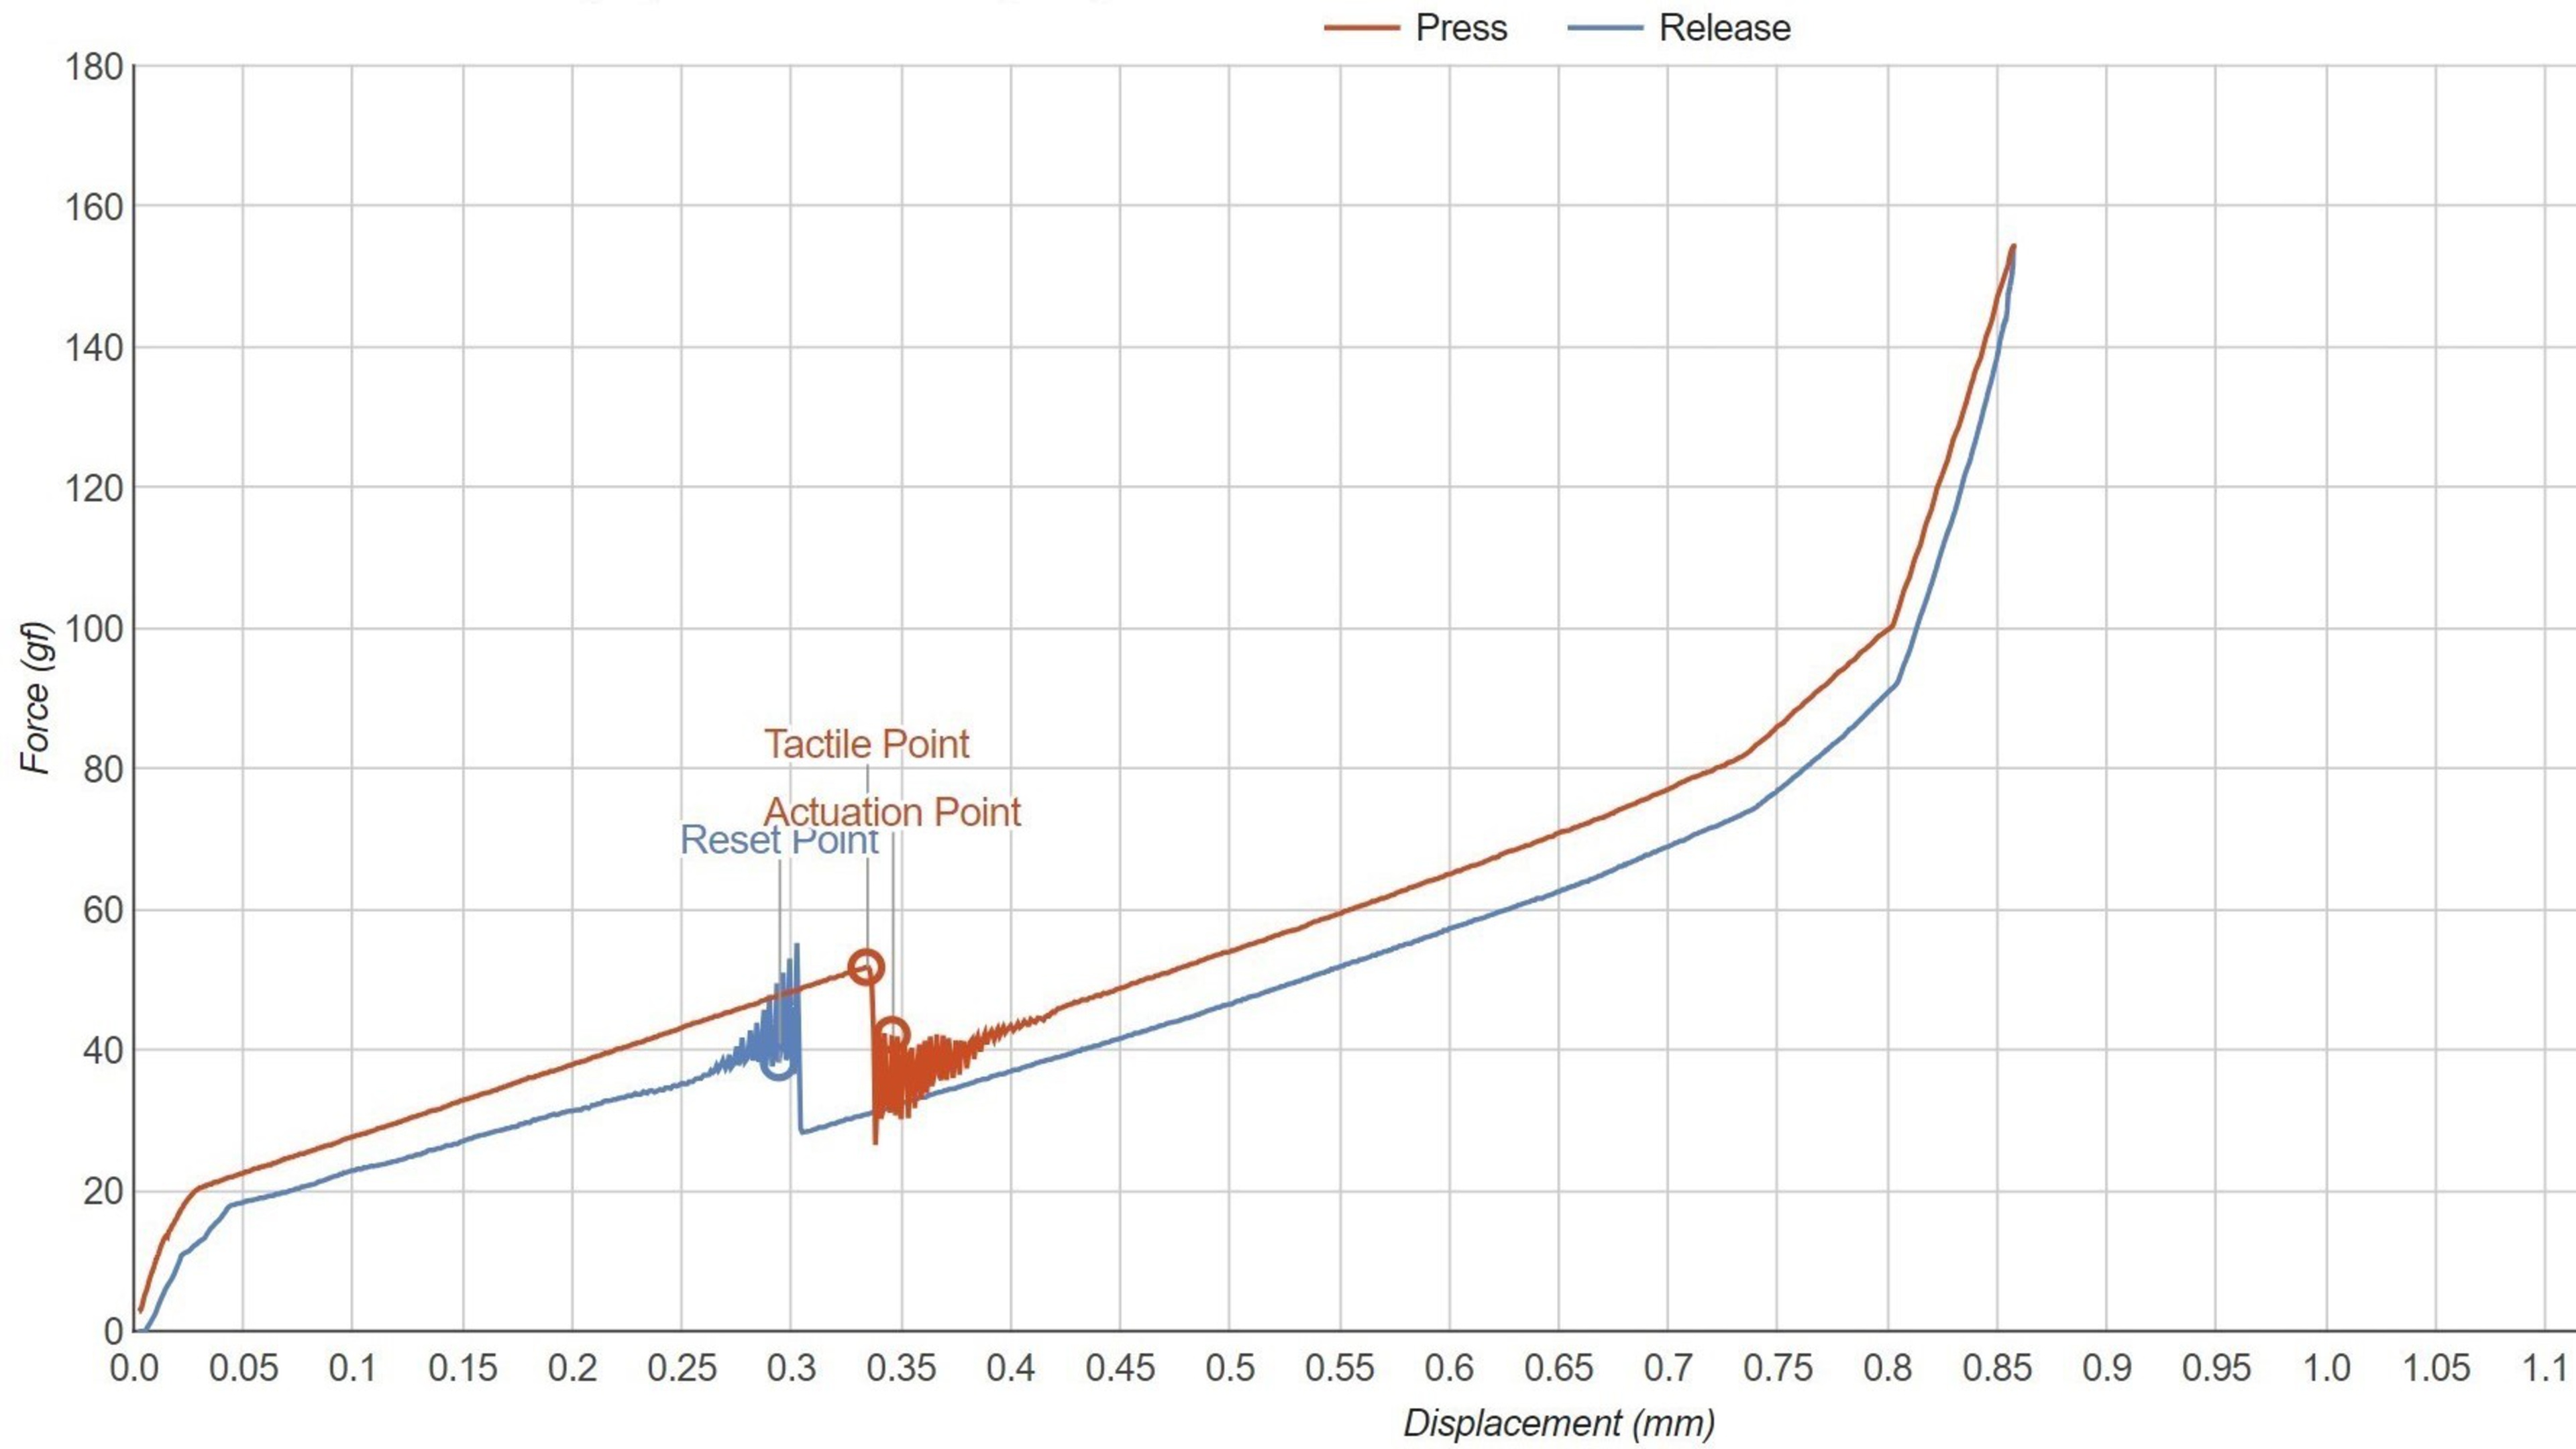
Additionally, since there's bouncing in the graph around the actuation point, the force value can vary from test to test. Some actuation points might register at the peak of one of the bounces, while others could register at the bottom (more information on this bouncing in the following sections).
For all the reasons above, we removed the actuation and reset points from the mouse actuation graphs and only retained the tactile force point labeled. Note that we've opted to use the term "tactile force" in relation to our focus on the tactile point. We recognize this term is likely more often referred to as "actuation force" within the broader online mouse community. However, we think the graph is clear enough to indicate what the tactile force is and why it's relevant.
Influence Of Mouse Construction On Actuation
Comparing mice with the same switches and (almost) the same build
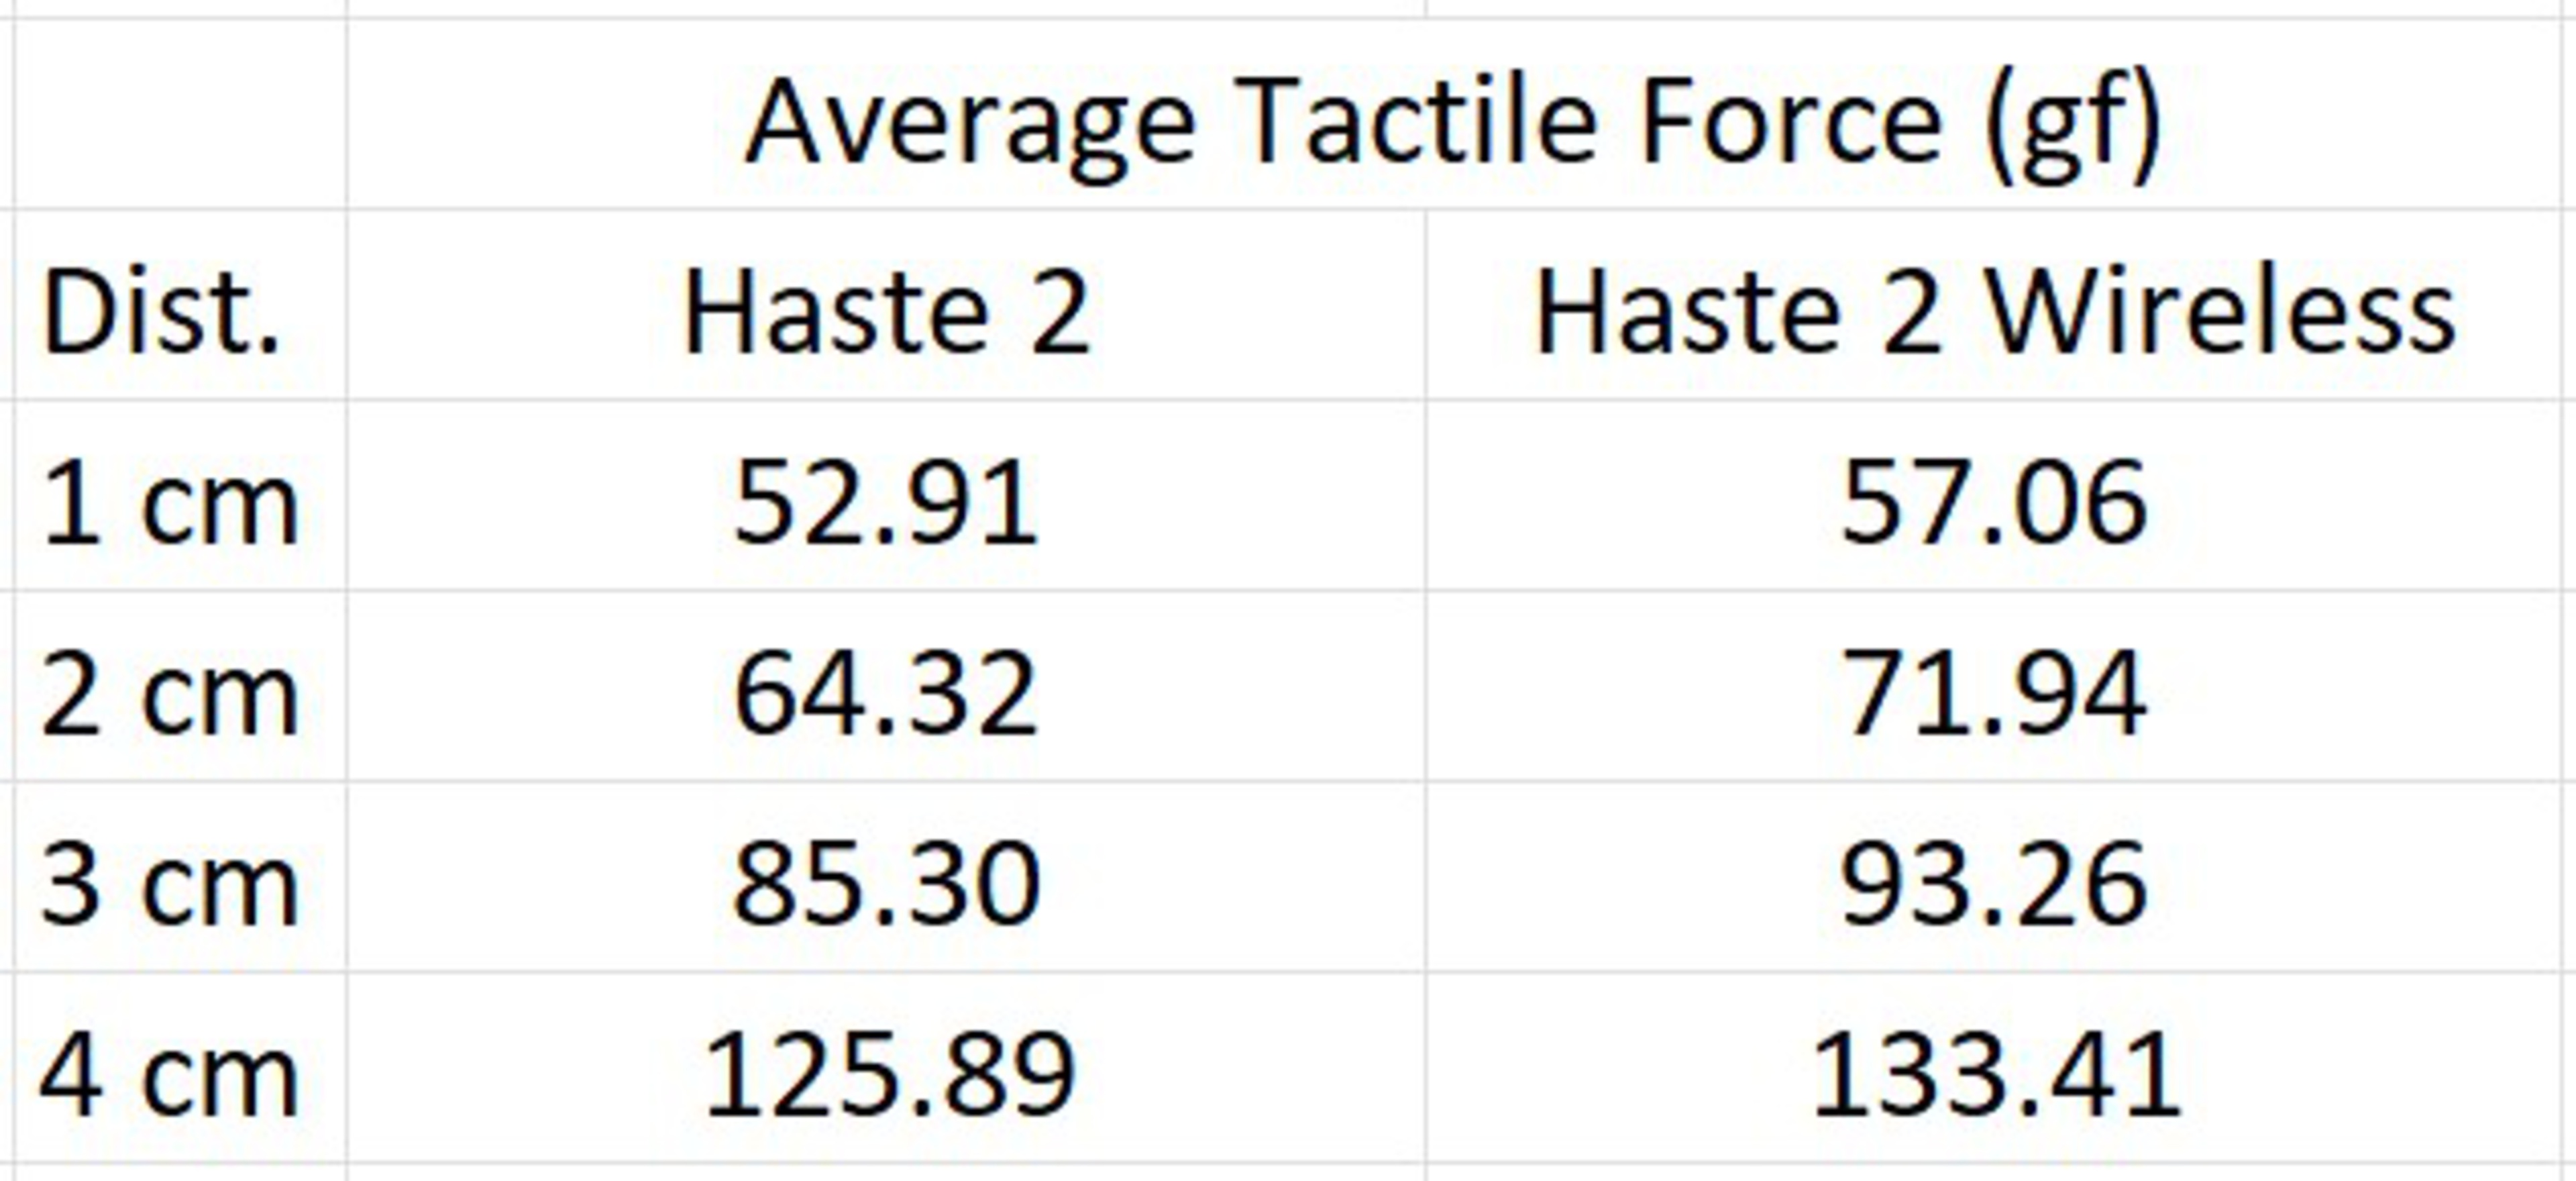
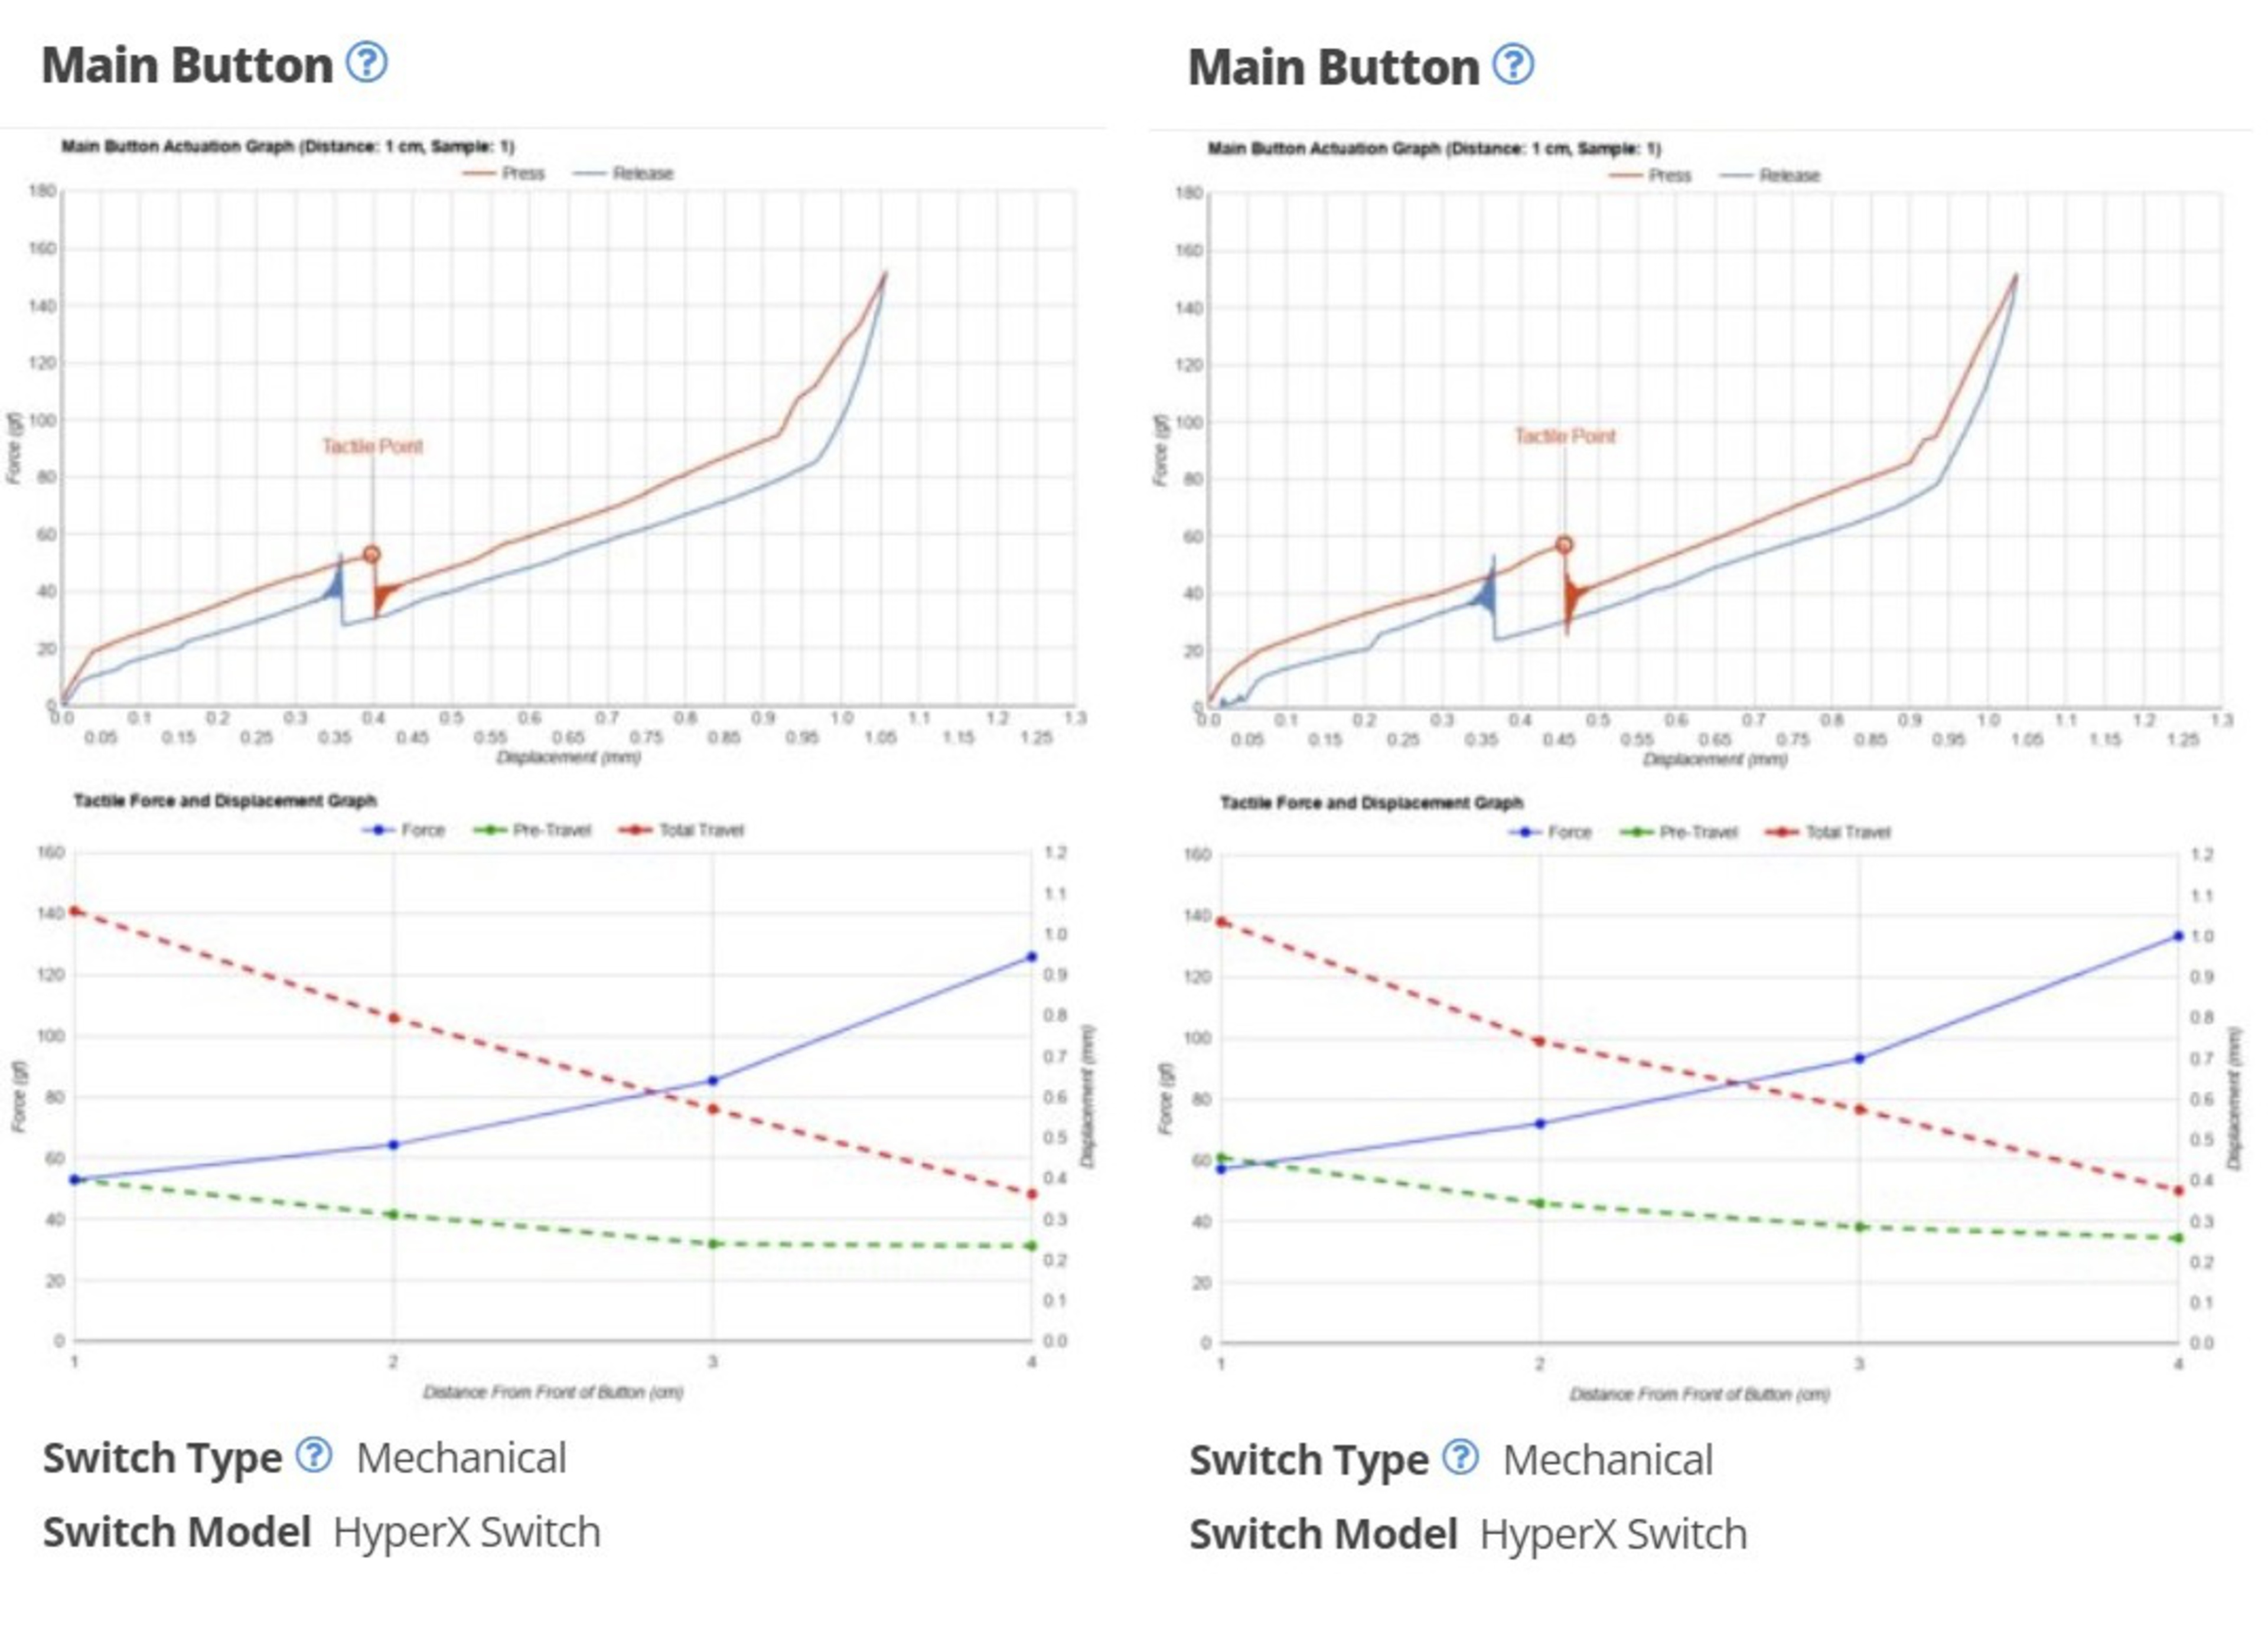
Two of the mice we tested have a very similar build and use the same switches (the HyperX Pulsefire Haste 2 and the HyperX Pulsefire Haste 2 Wireless.) Since there's very little apparent difference between these two mice apart from their connectivity options, we theorized there may not be much variation in the Main Button test results. However, when we compare the actuation results of these two mice in the table and reviews below, there is a small but noticeable difference between the two mice.
These differences are surprising since they use the same switches, and their shape/build is very similar. The differences could be attributed to multiple factors: switch-to-switch variance, small differences in mouse build (same shape, different internals), or small variance in testing conditions. We looked into all these influences to determine their impact.
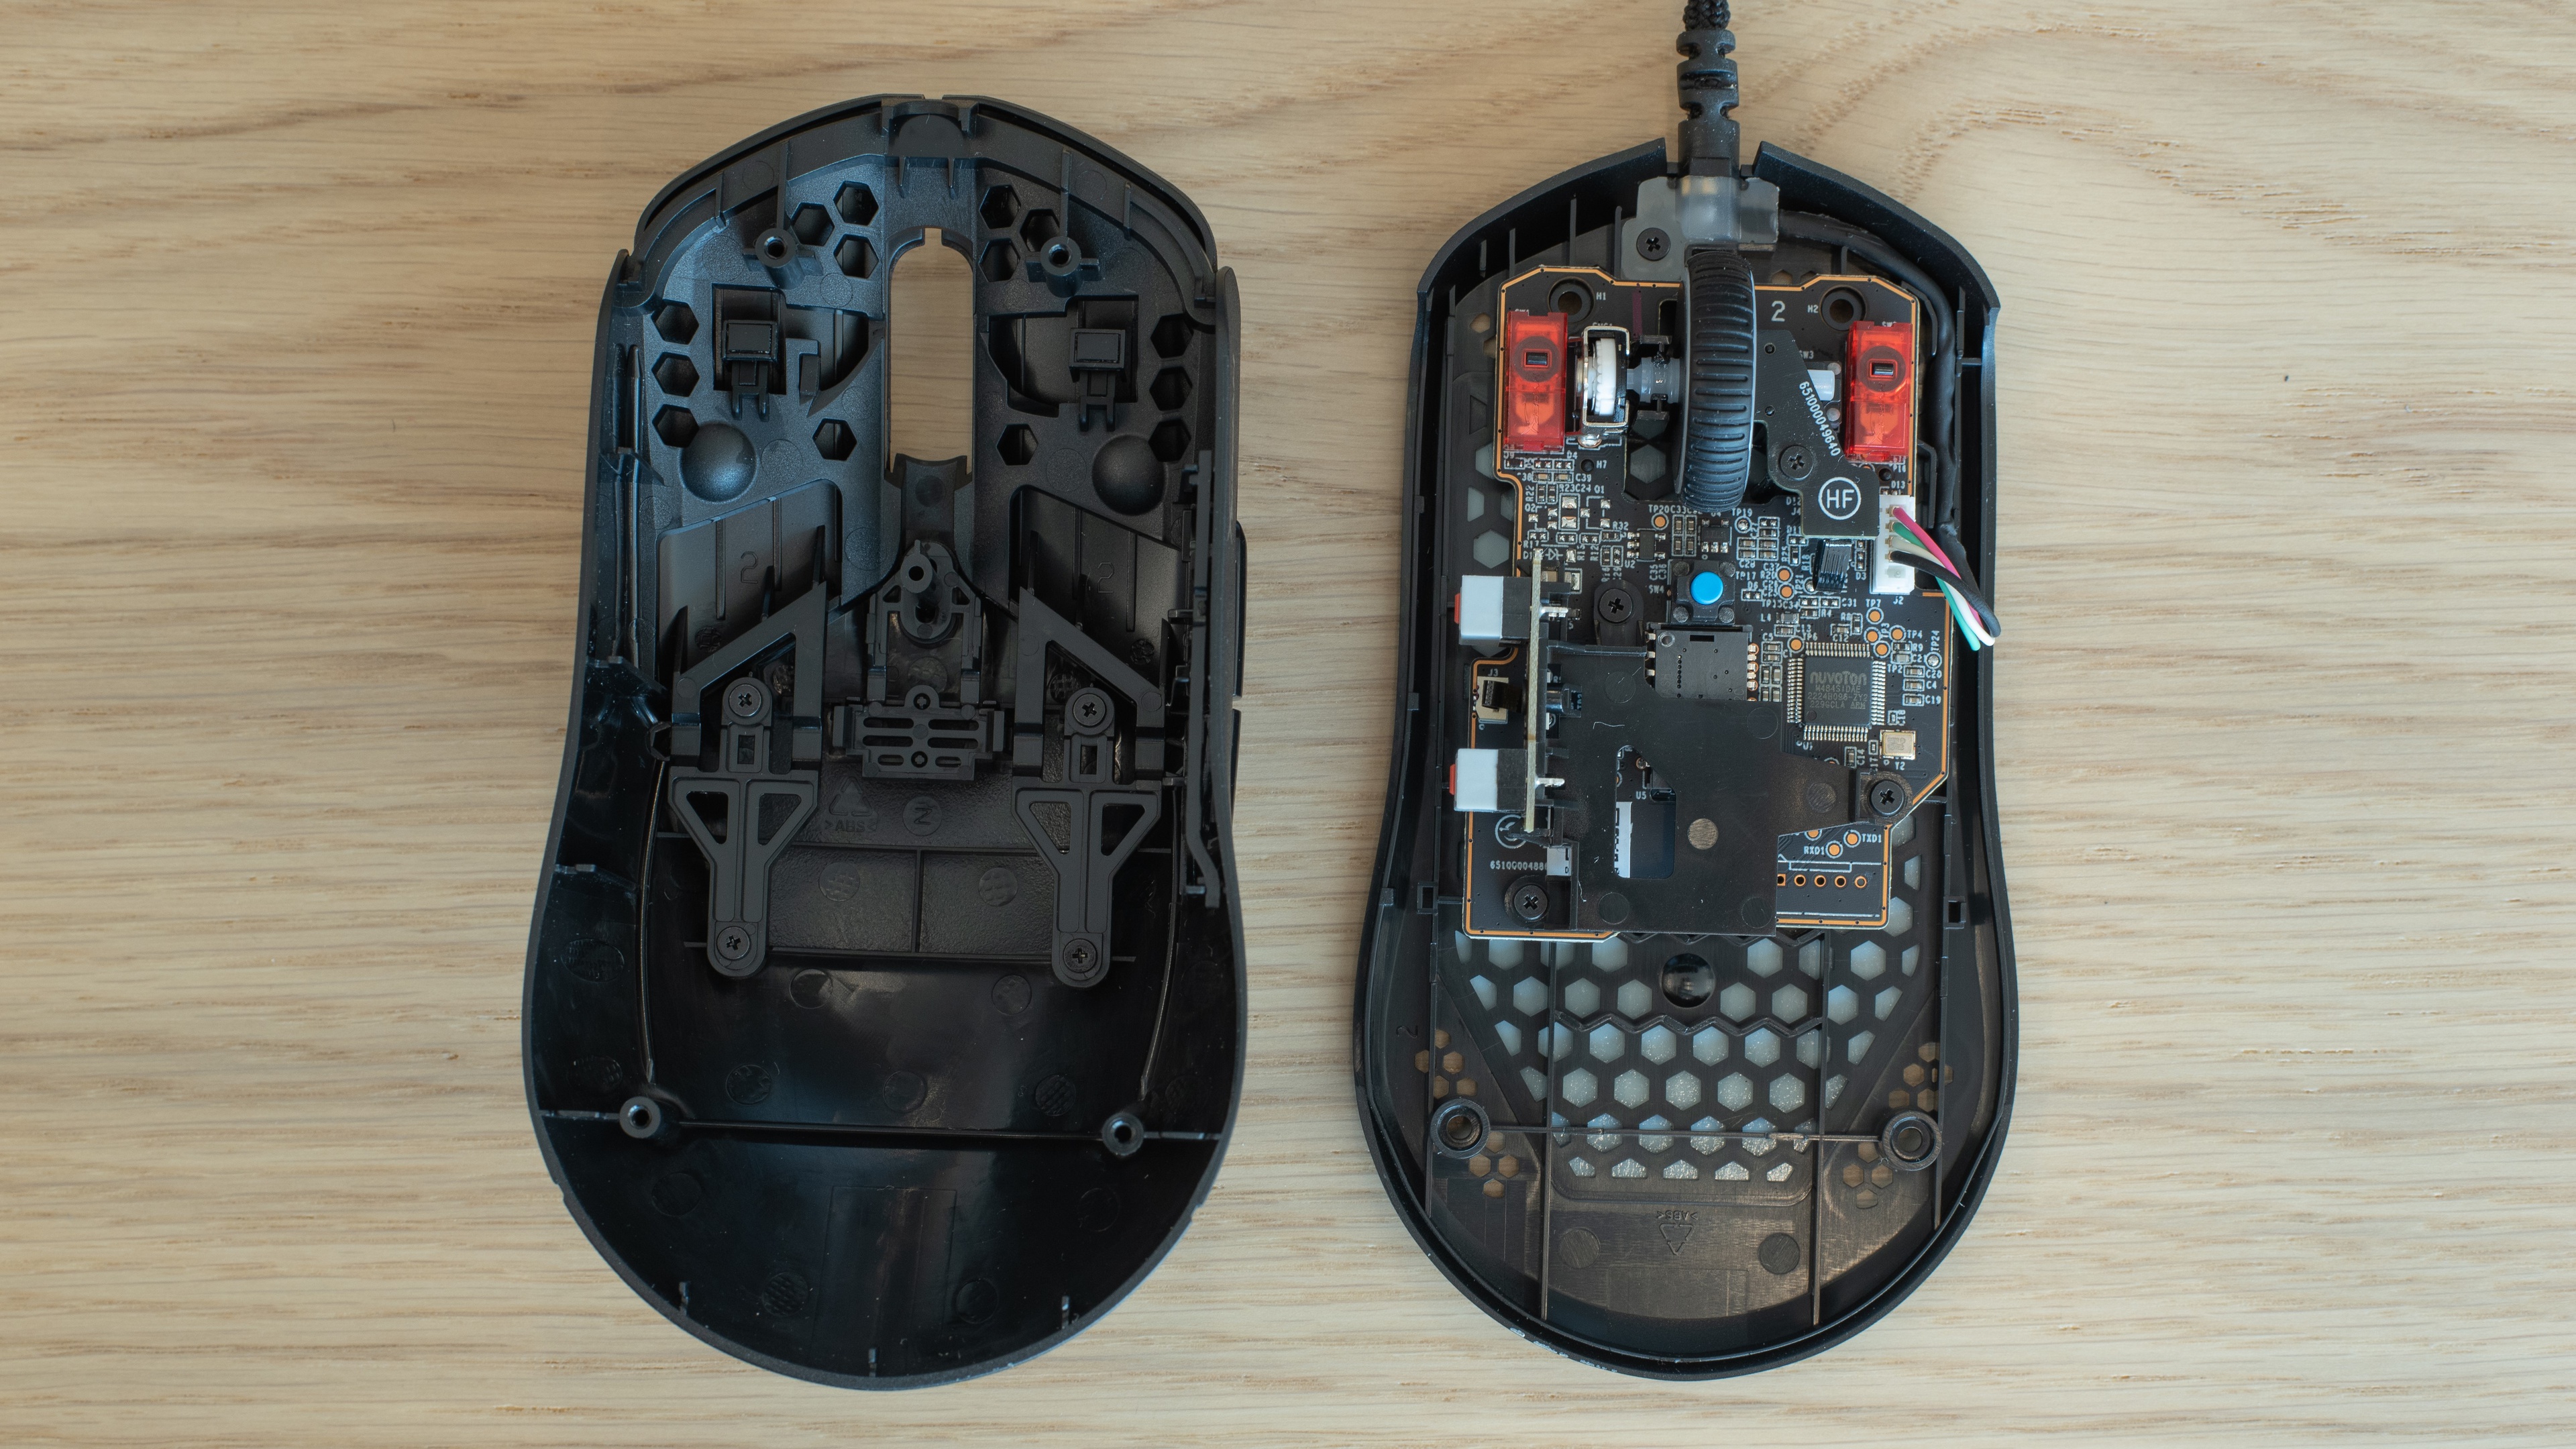
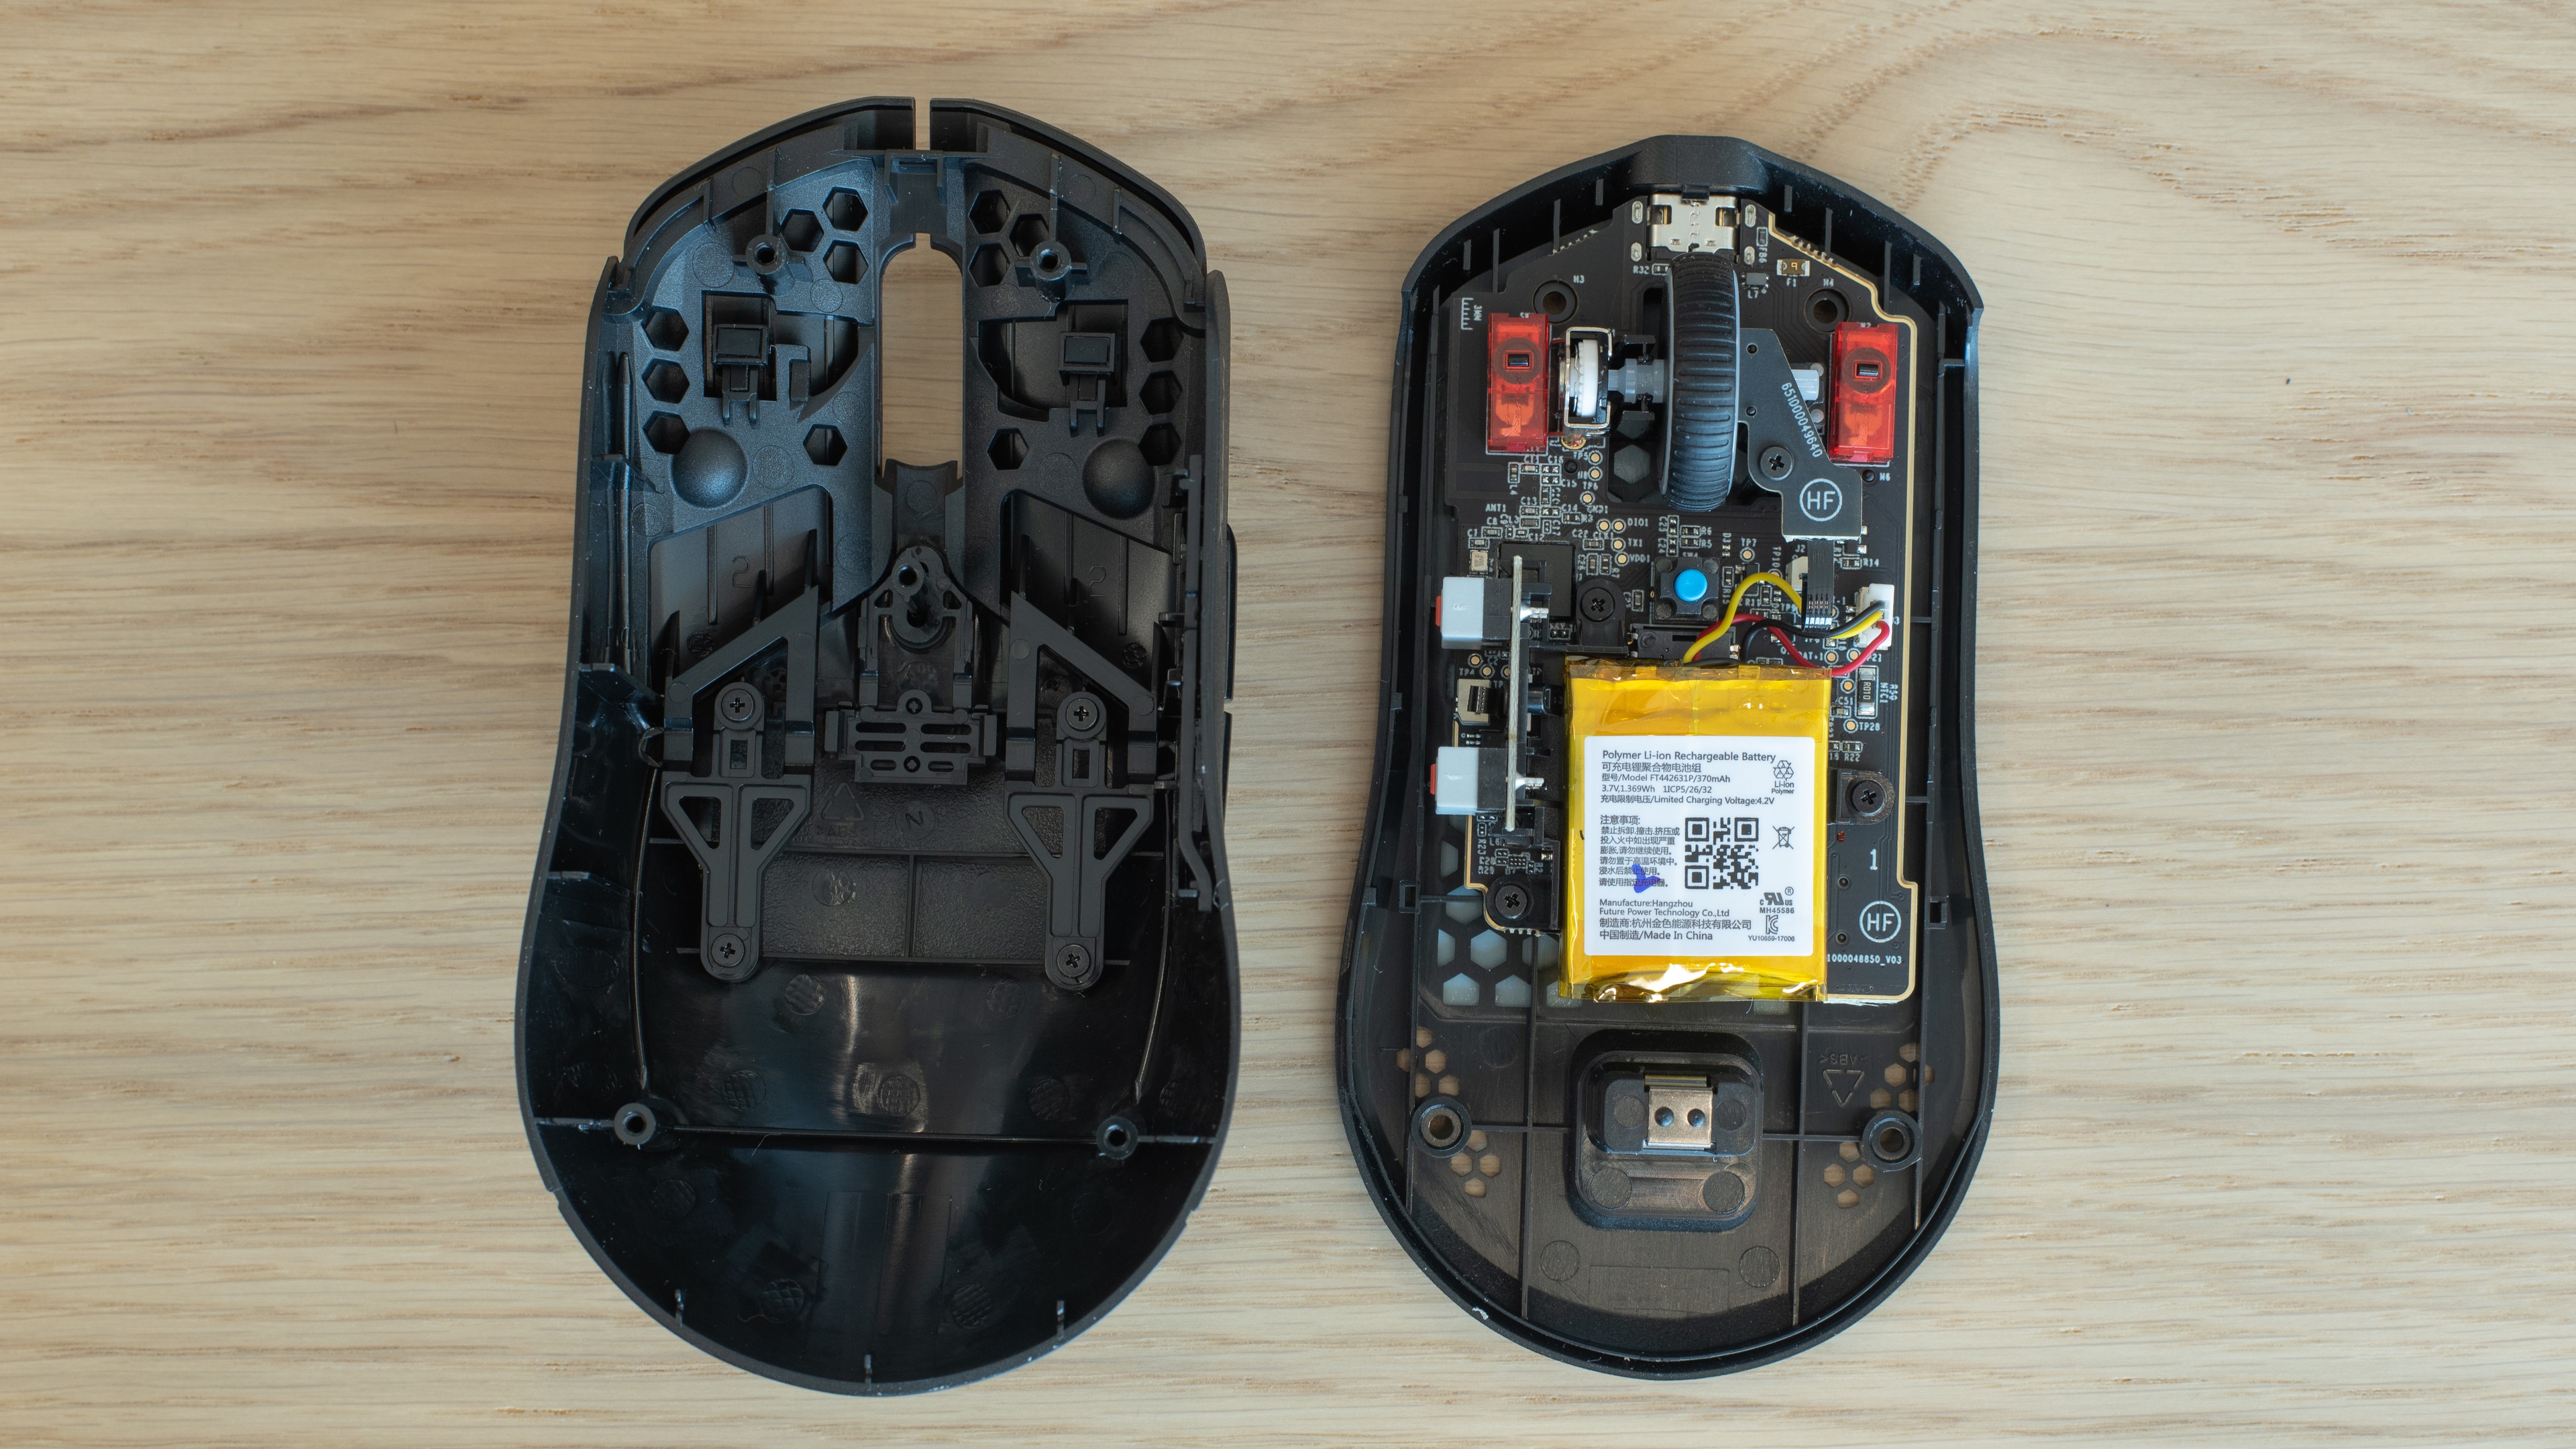
If we look at the teardown photos below, we can see that the internal structure of the two mice are slightly different. The Haste 2 Wireless has a battery mounted towards the center and a slightly different main PCB layout. Despite that, the switch position looks the same for both models, and the top shell is identical for both models. It's possible that the small differences in internal structure could be some of the reasons for the slight difference in actuation characteristics.
Another possibility for the difference in actuation characteristics may be a variance in our testing procedure. When we test the actuation, we take three samples of each point. Because of this, we can examine the standard deviation in the tactile force of each point to see how closely our test can be repeated. The largest standard deviation is ~0.94 gf, which is much less than the difference of 4.15 gf we see between the wired and wireless buttons.
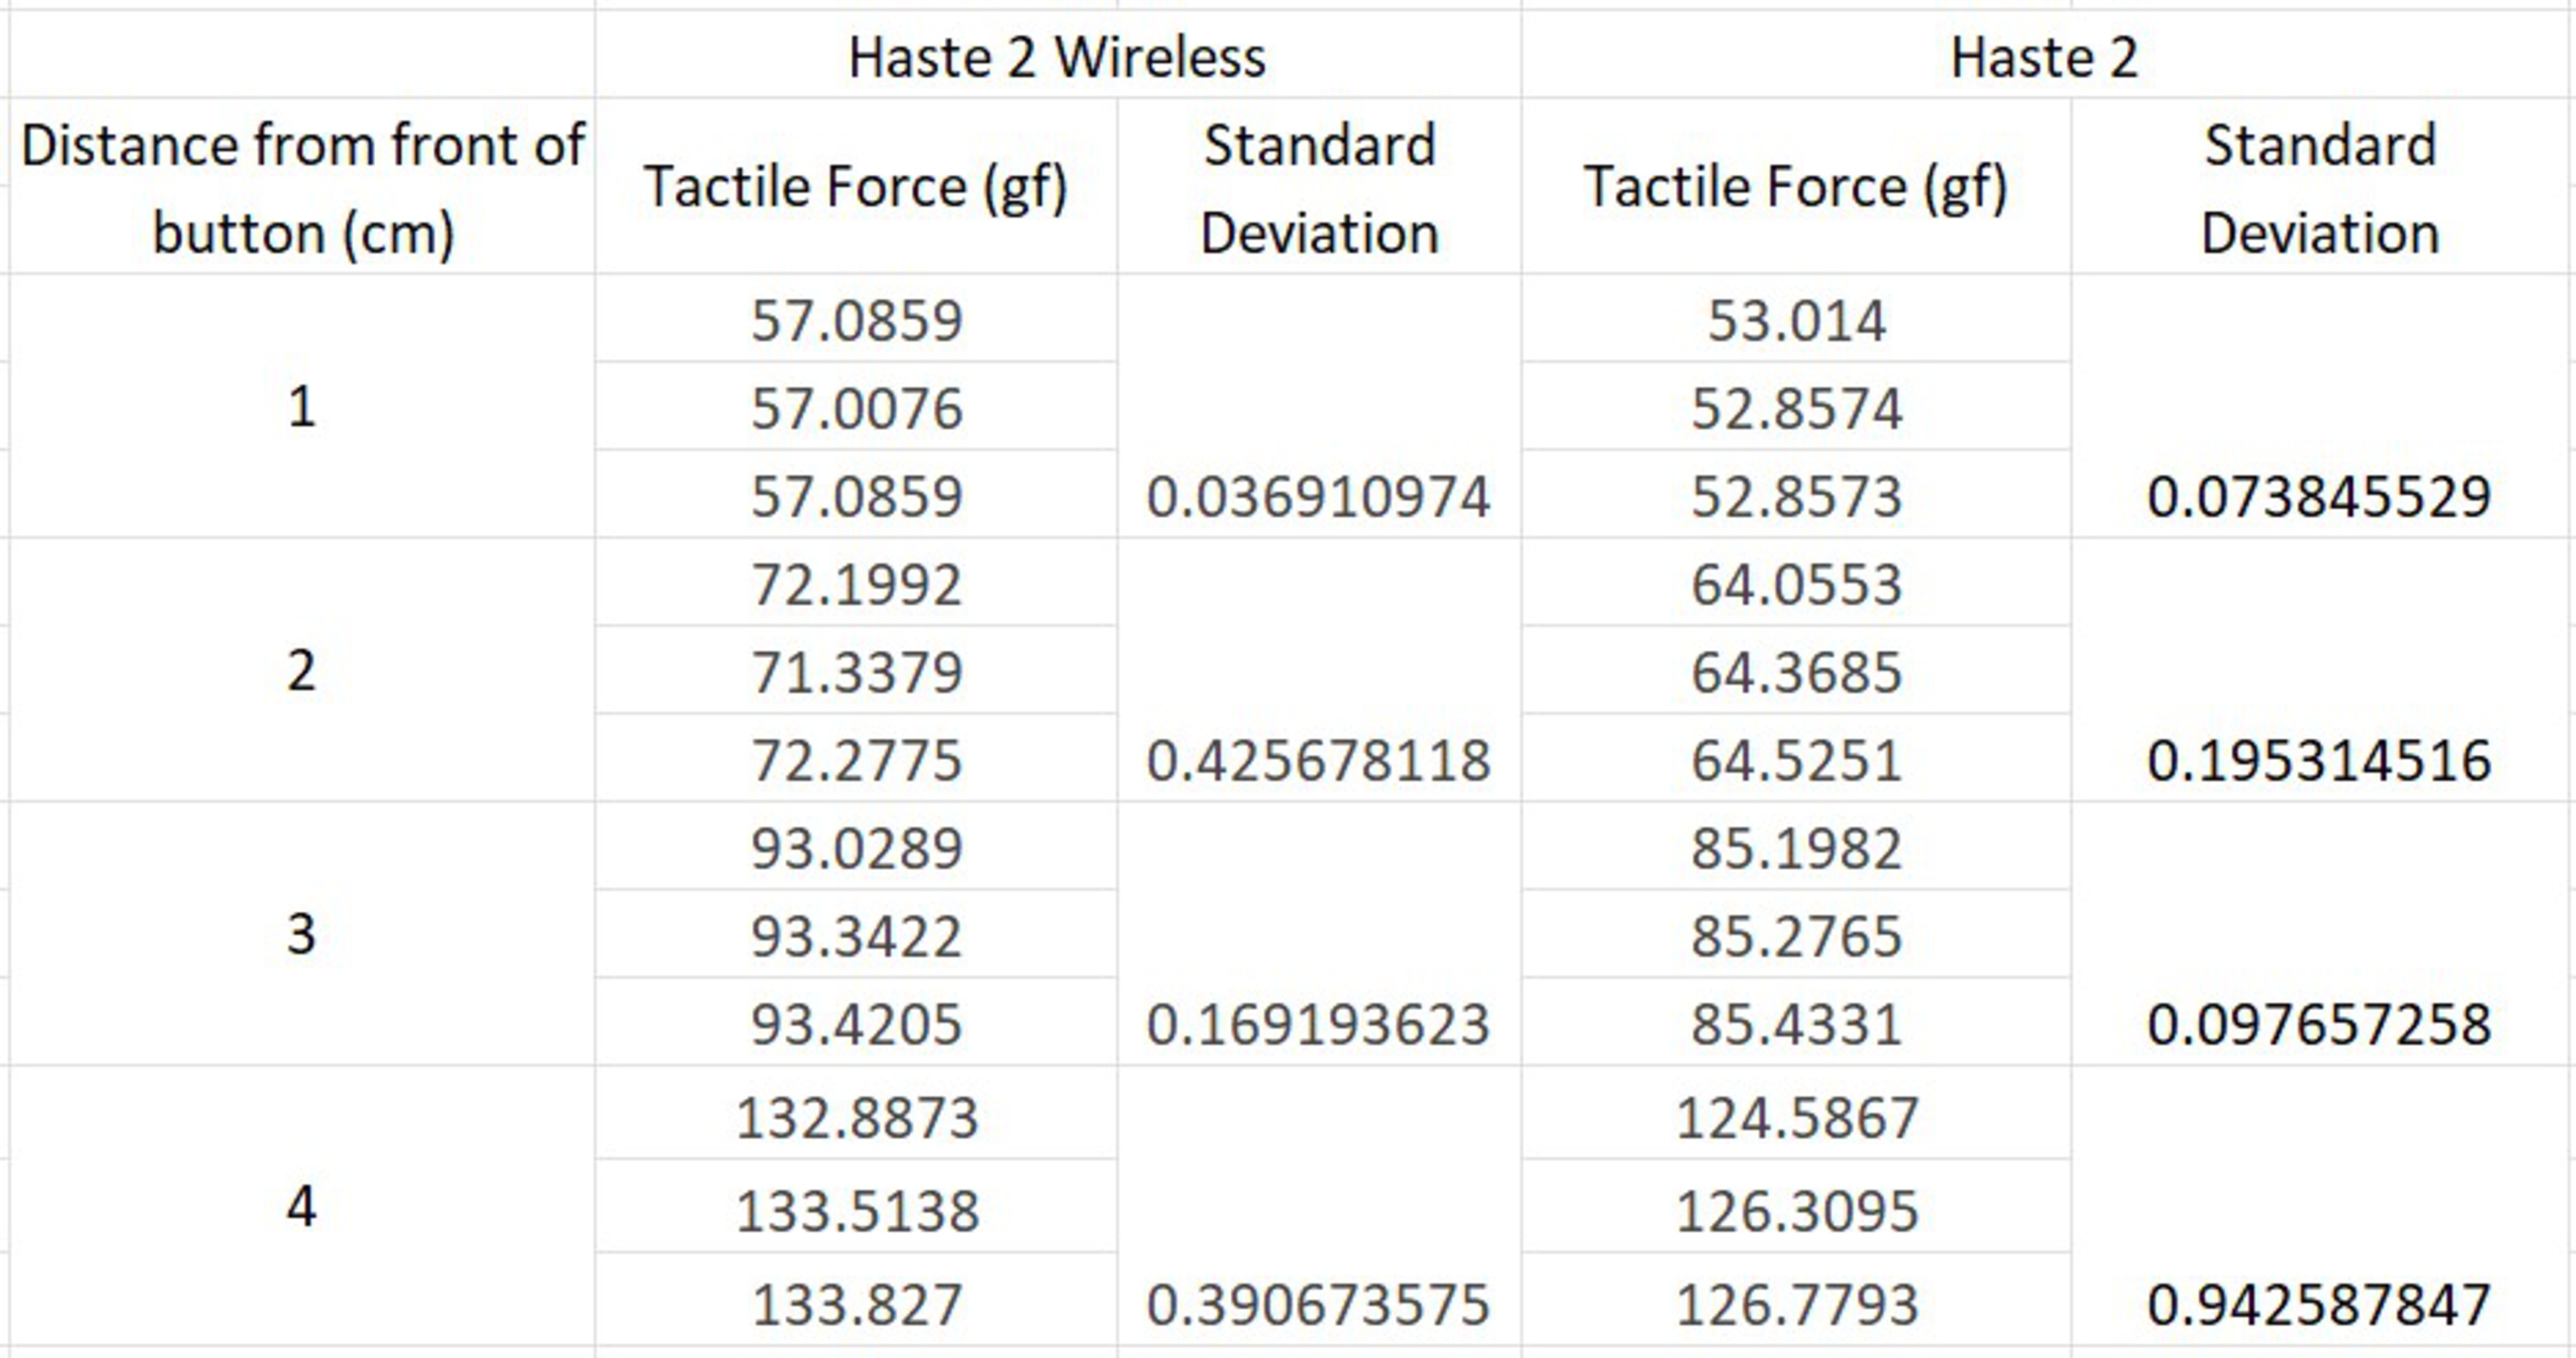
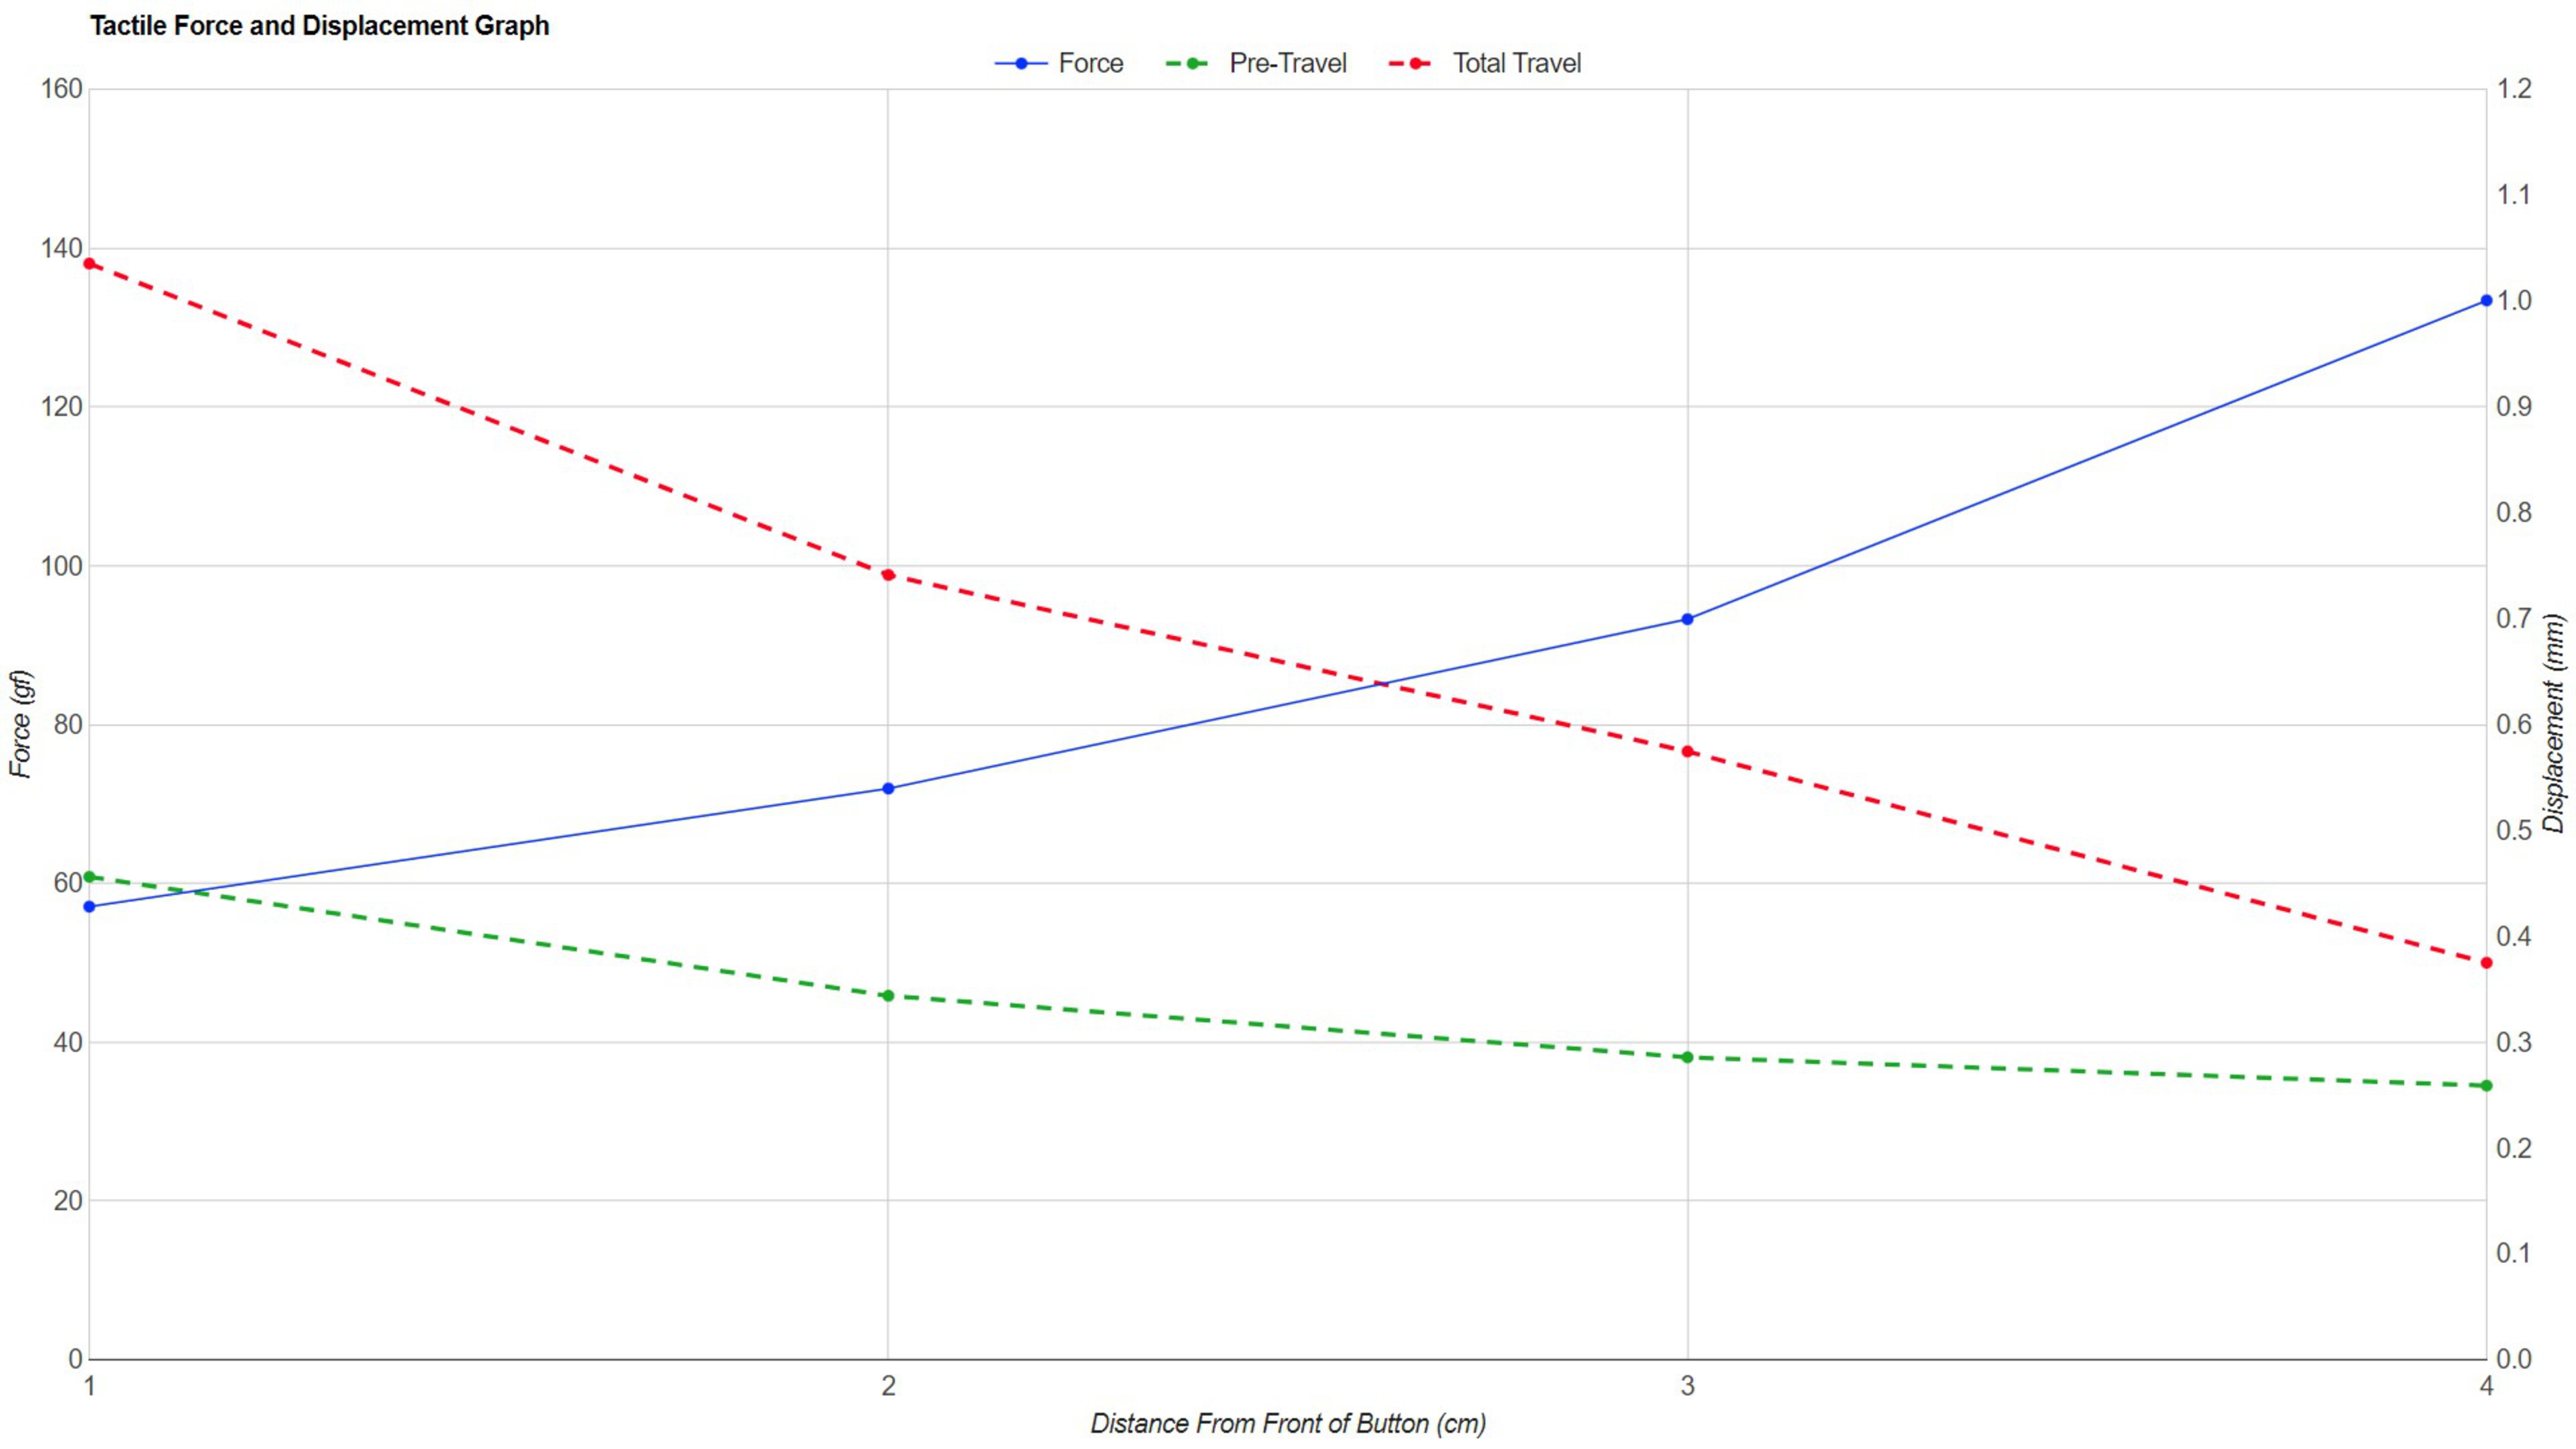
Despite the small standard deviations, some differences between the Haste 2 mice could be from testing variance. If we look at the force/distance graph for the Pulsefire Haste 2 Wireless below, we can see that from 1 to 2 cm, the tactile force increases from approximately 57 gf to 72 gf, respectively. It's a 15 gf increase over a 1 cm distance. Assuming it's linear from 1 to 2 cm (this isn't necessarily true, but is a close approximation), the result is a 1.5 gf/mm change. If we do the same analysis on the wired Pulsefire Haste 2, we get about 1.1 gf/mm. For this reason, small variances due to human error, like the button not being perfectly perpendicular to the probe or the test point being slightly closer/farther from the desired point, can cause the results to be slightly impacted.
Another explanation for the difference between the two Haste 2 mice is that the switches have some inconsistencies between them. To test this, we took the Haste 2 and Haste 2 Wireless and tested the left and right mouse buttons at 1 cm from the front of the button. This should be a fair comparison because both mice are symmetrical, so the left and right clicks should be the same. You can see the actuation graphs for this test and a summarized table below.
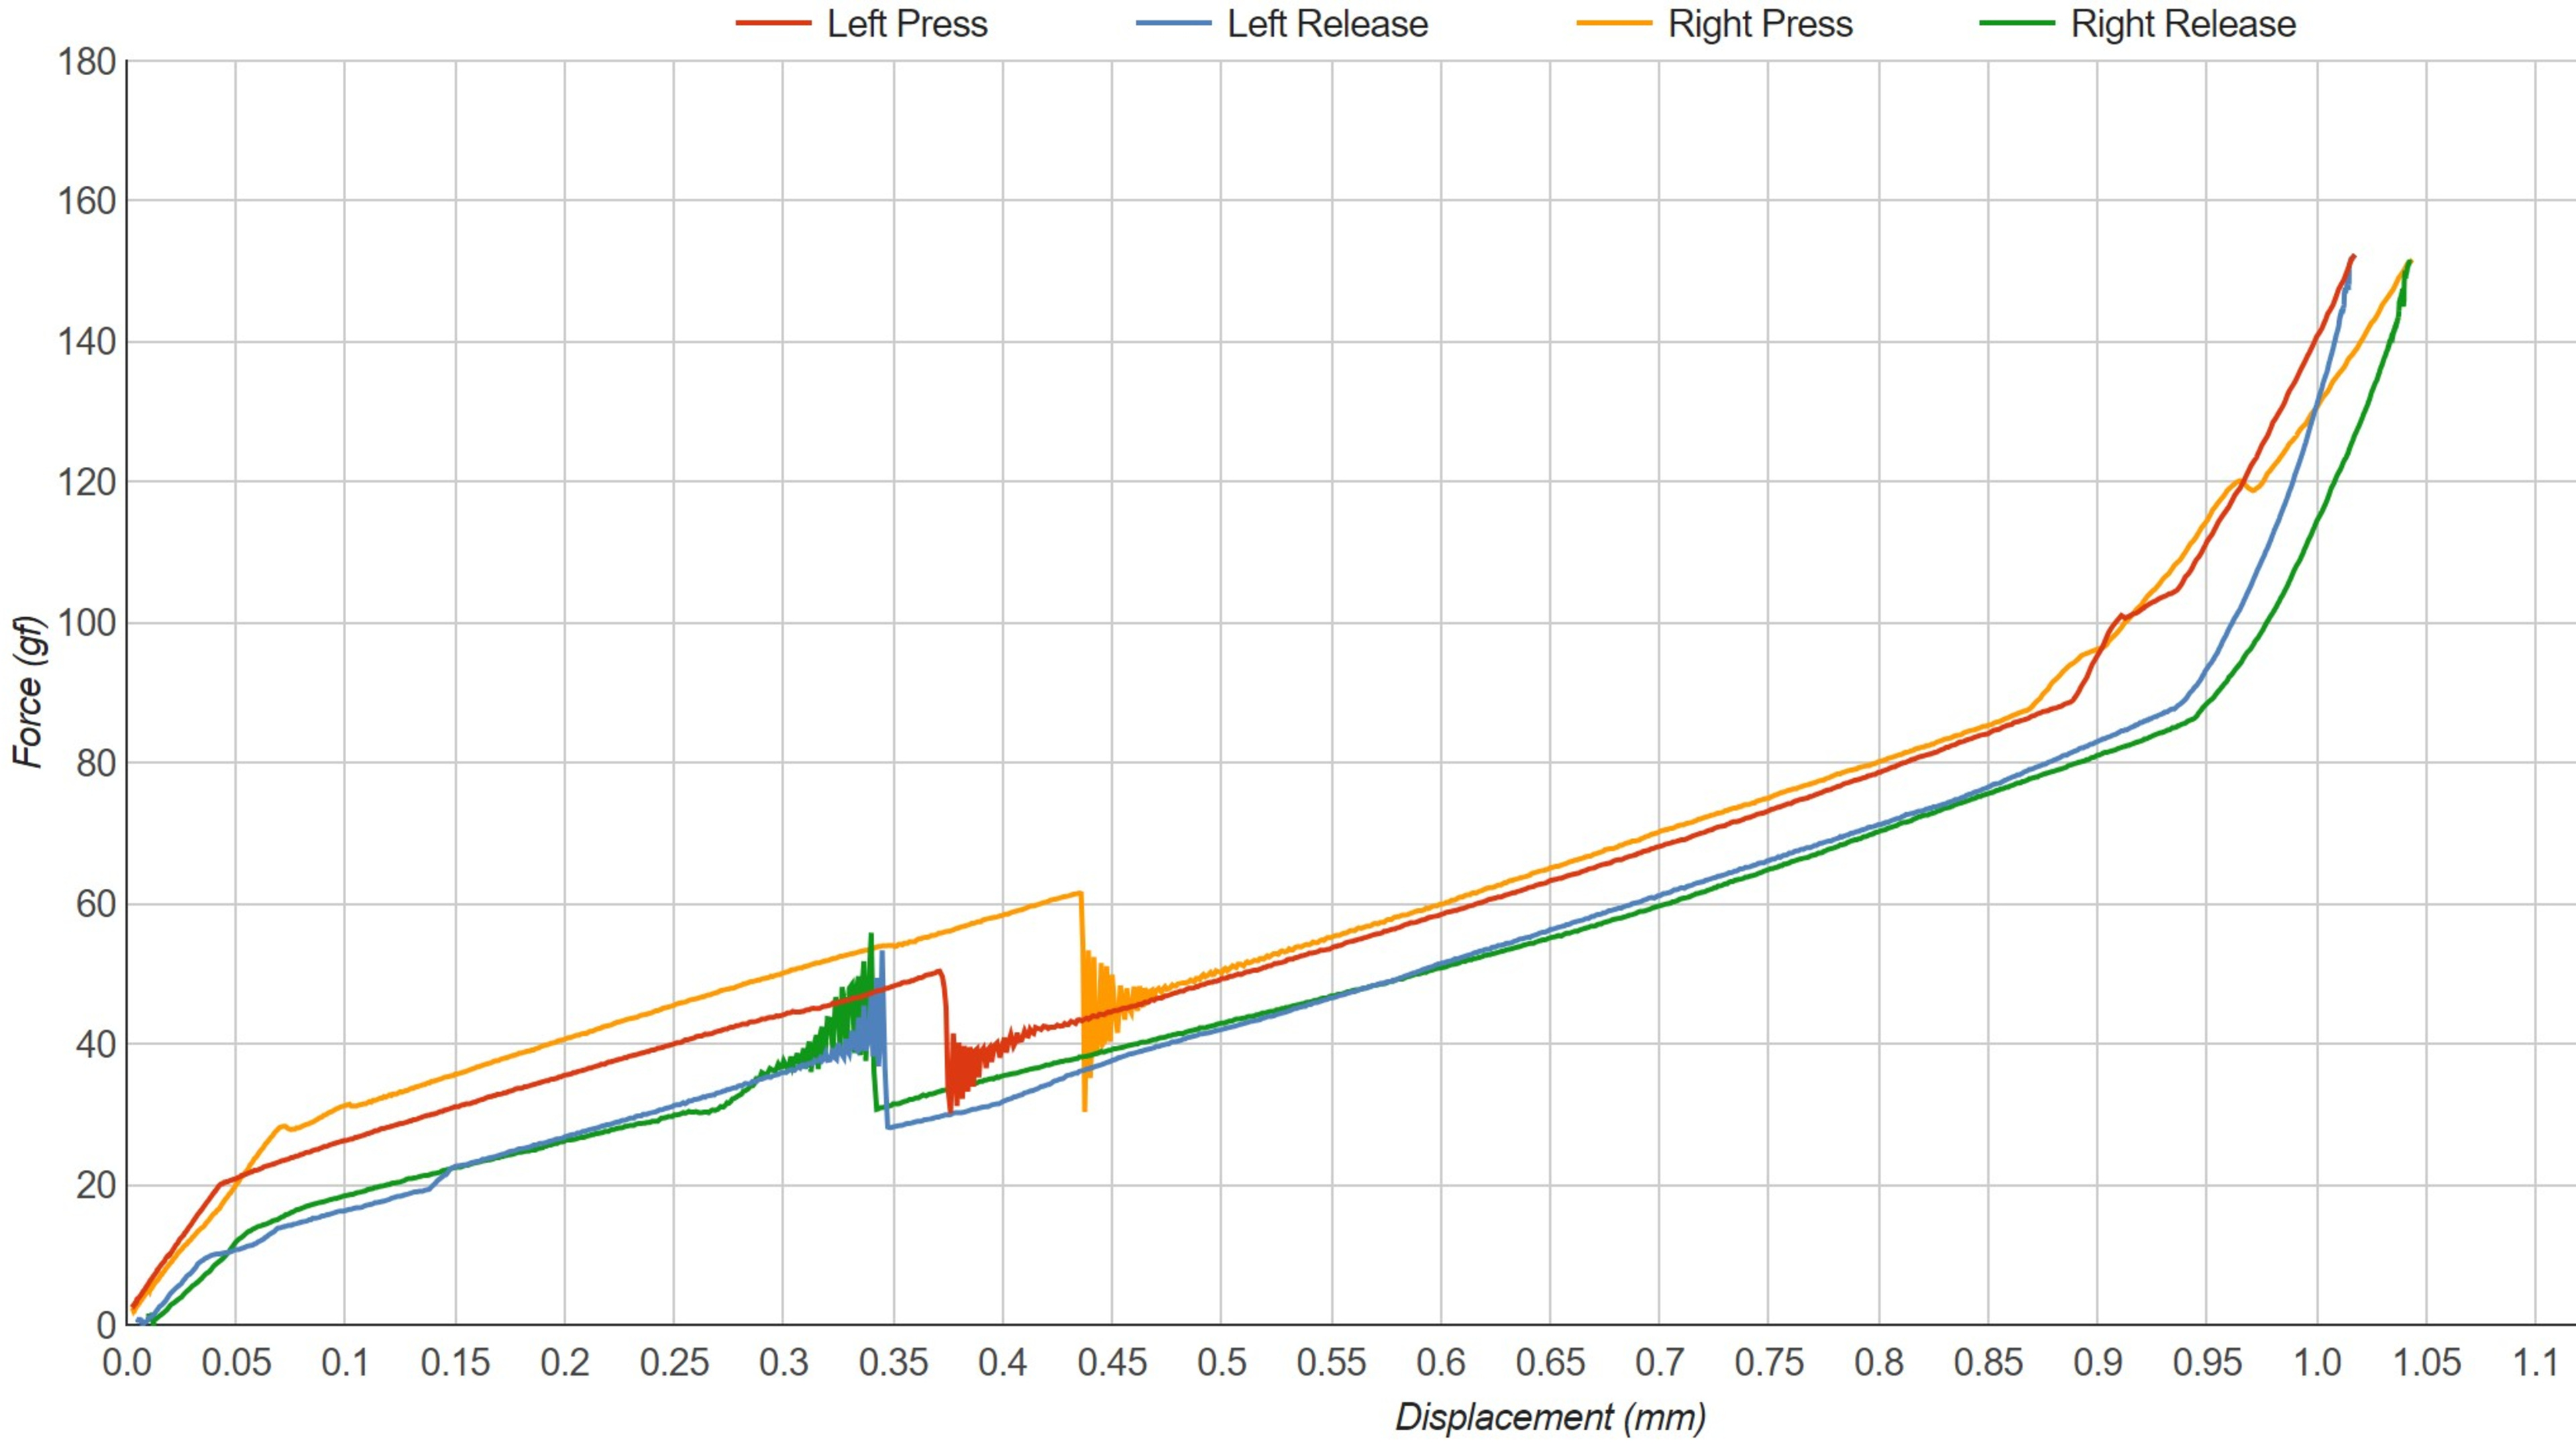
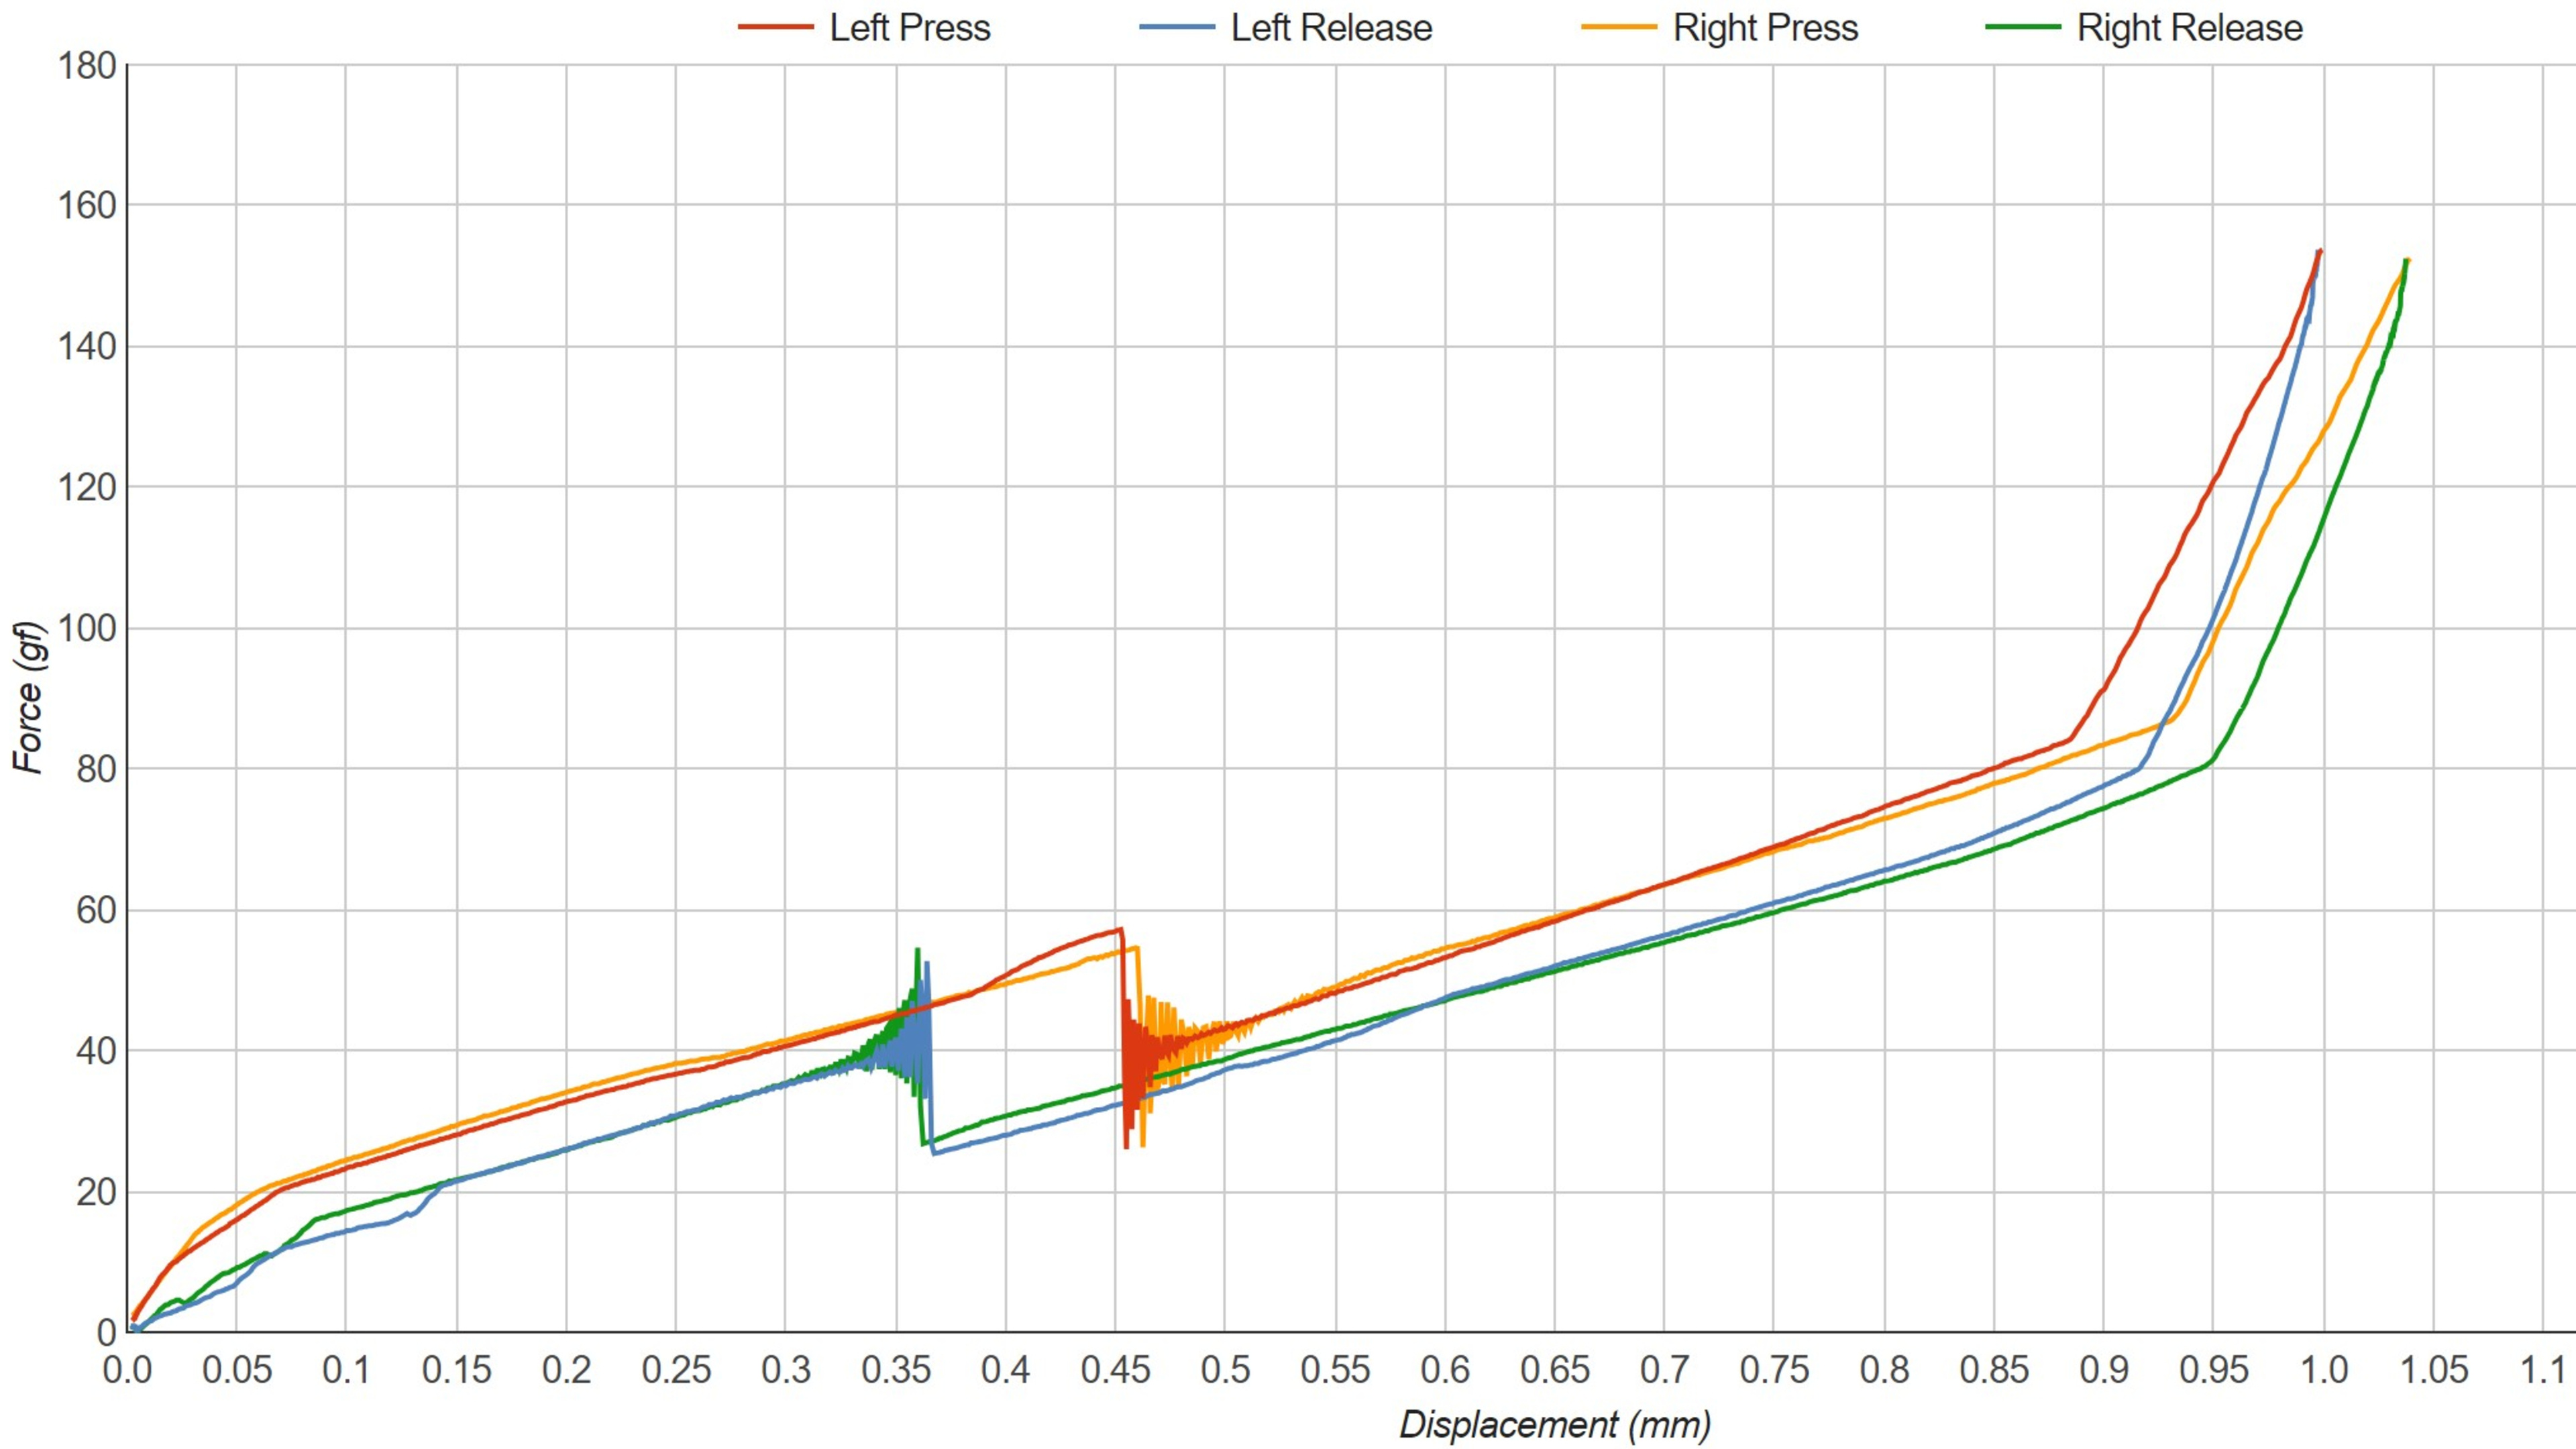
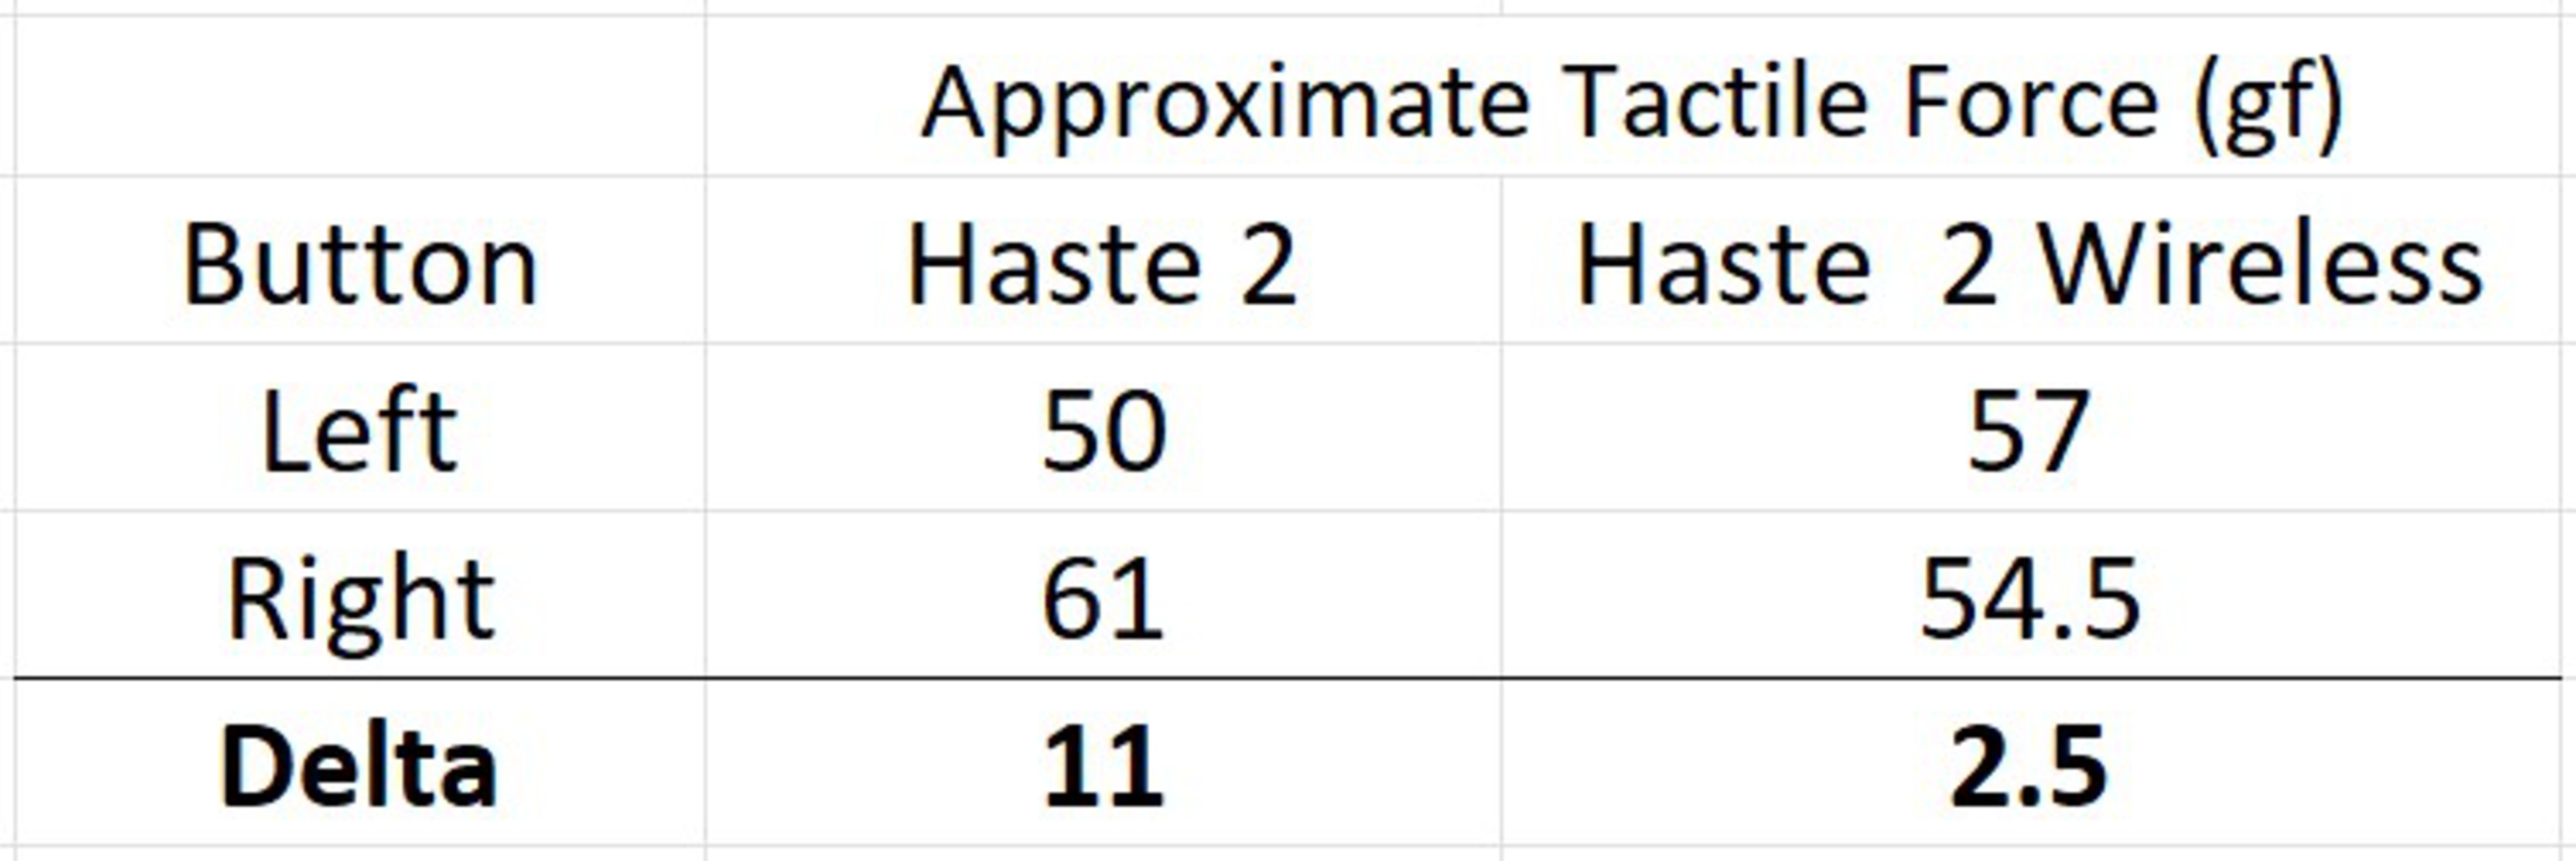
Although some of this variation could be due to small changes in our testing setup, it's very unlikely that it's responsible for 11 gf of difference. This difference between left and right mouse actuation results for the Haste 2 are likely due to switch variation. We don't have a large enough sample size to say whether this is an expected variation between switches, but this does explain why we see small differences in our test results between the two mice.
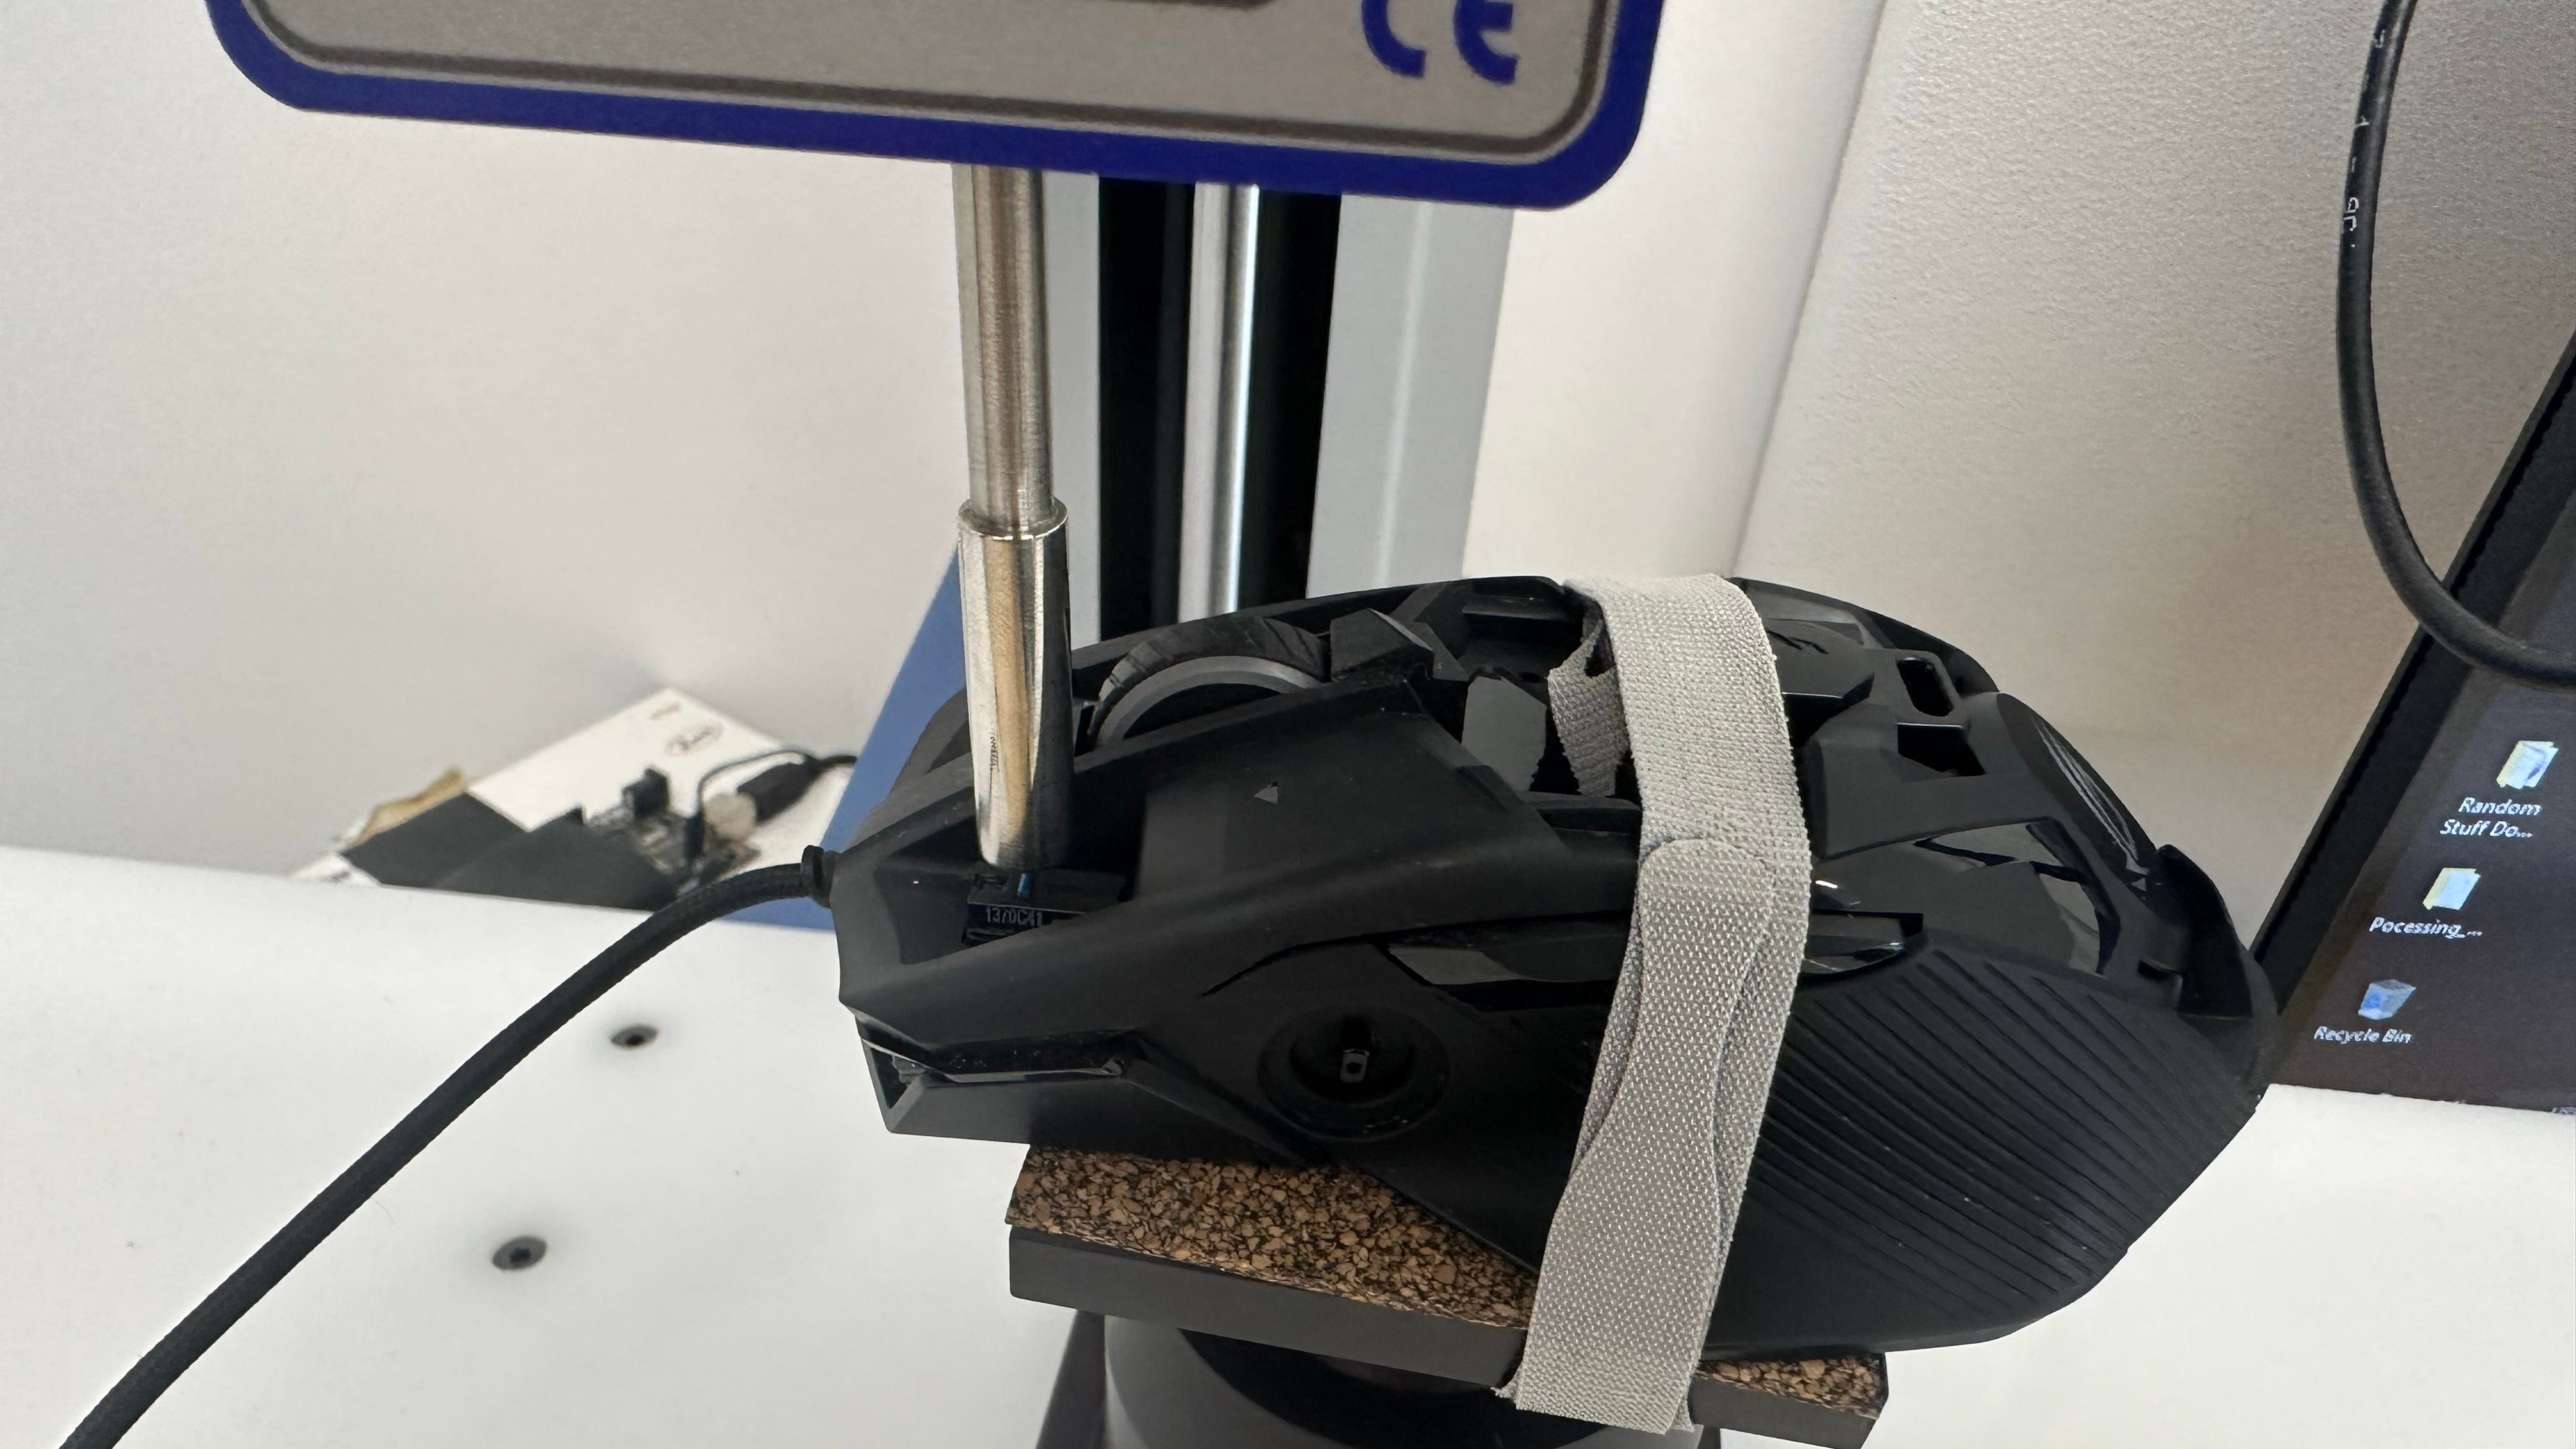
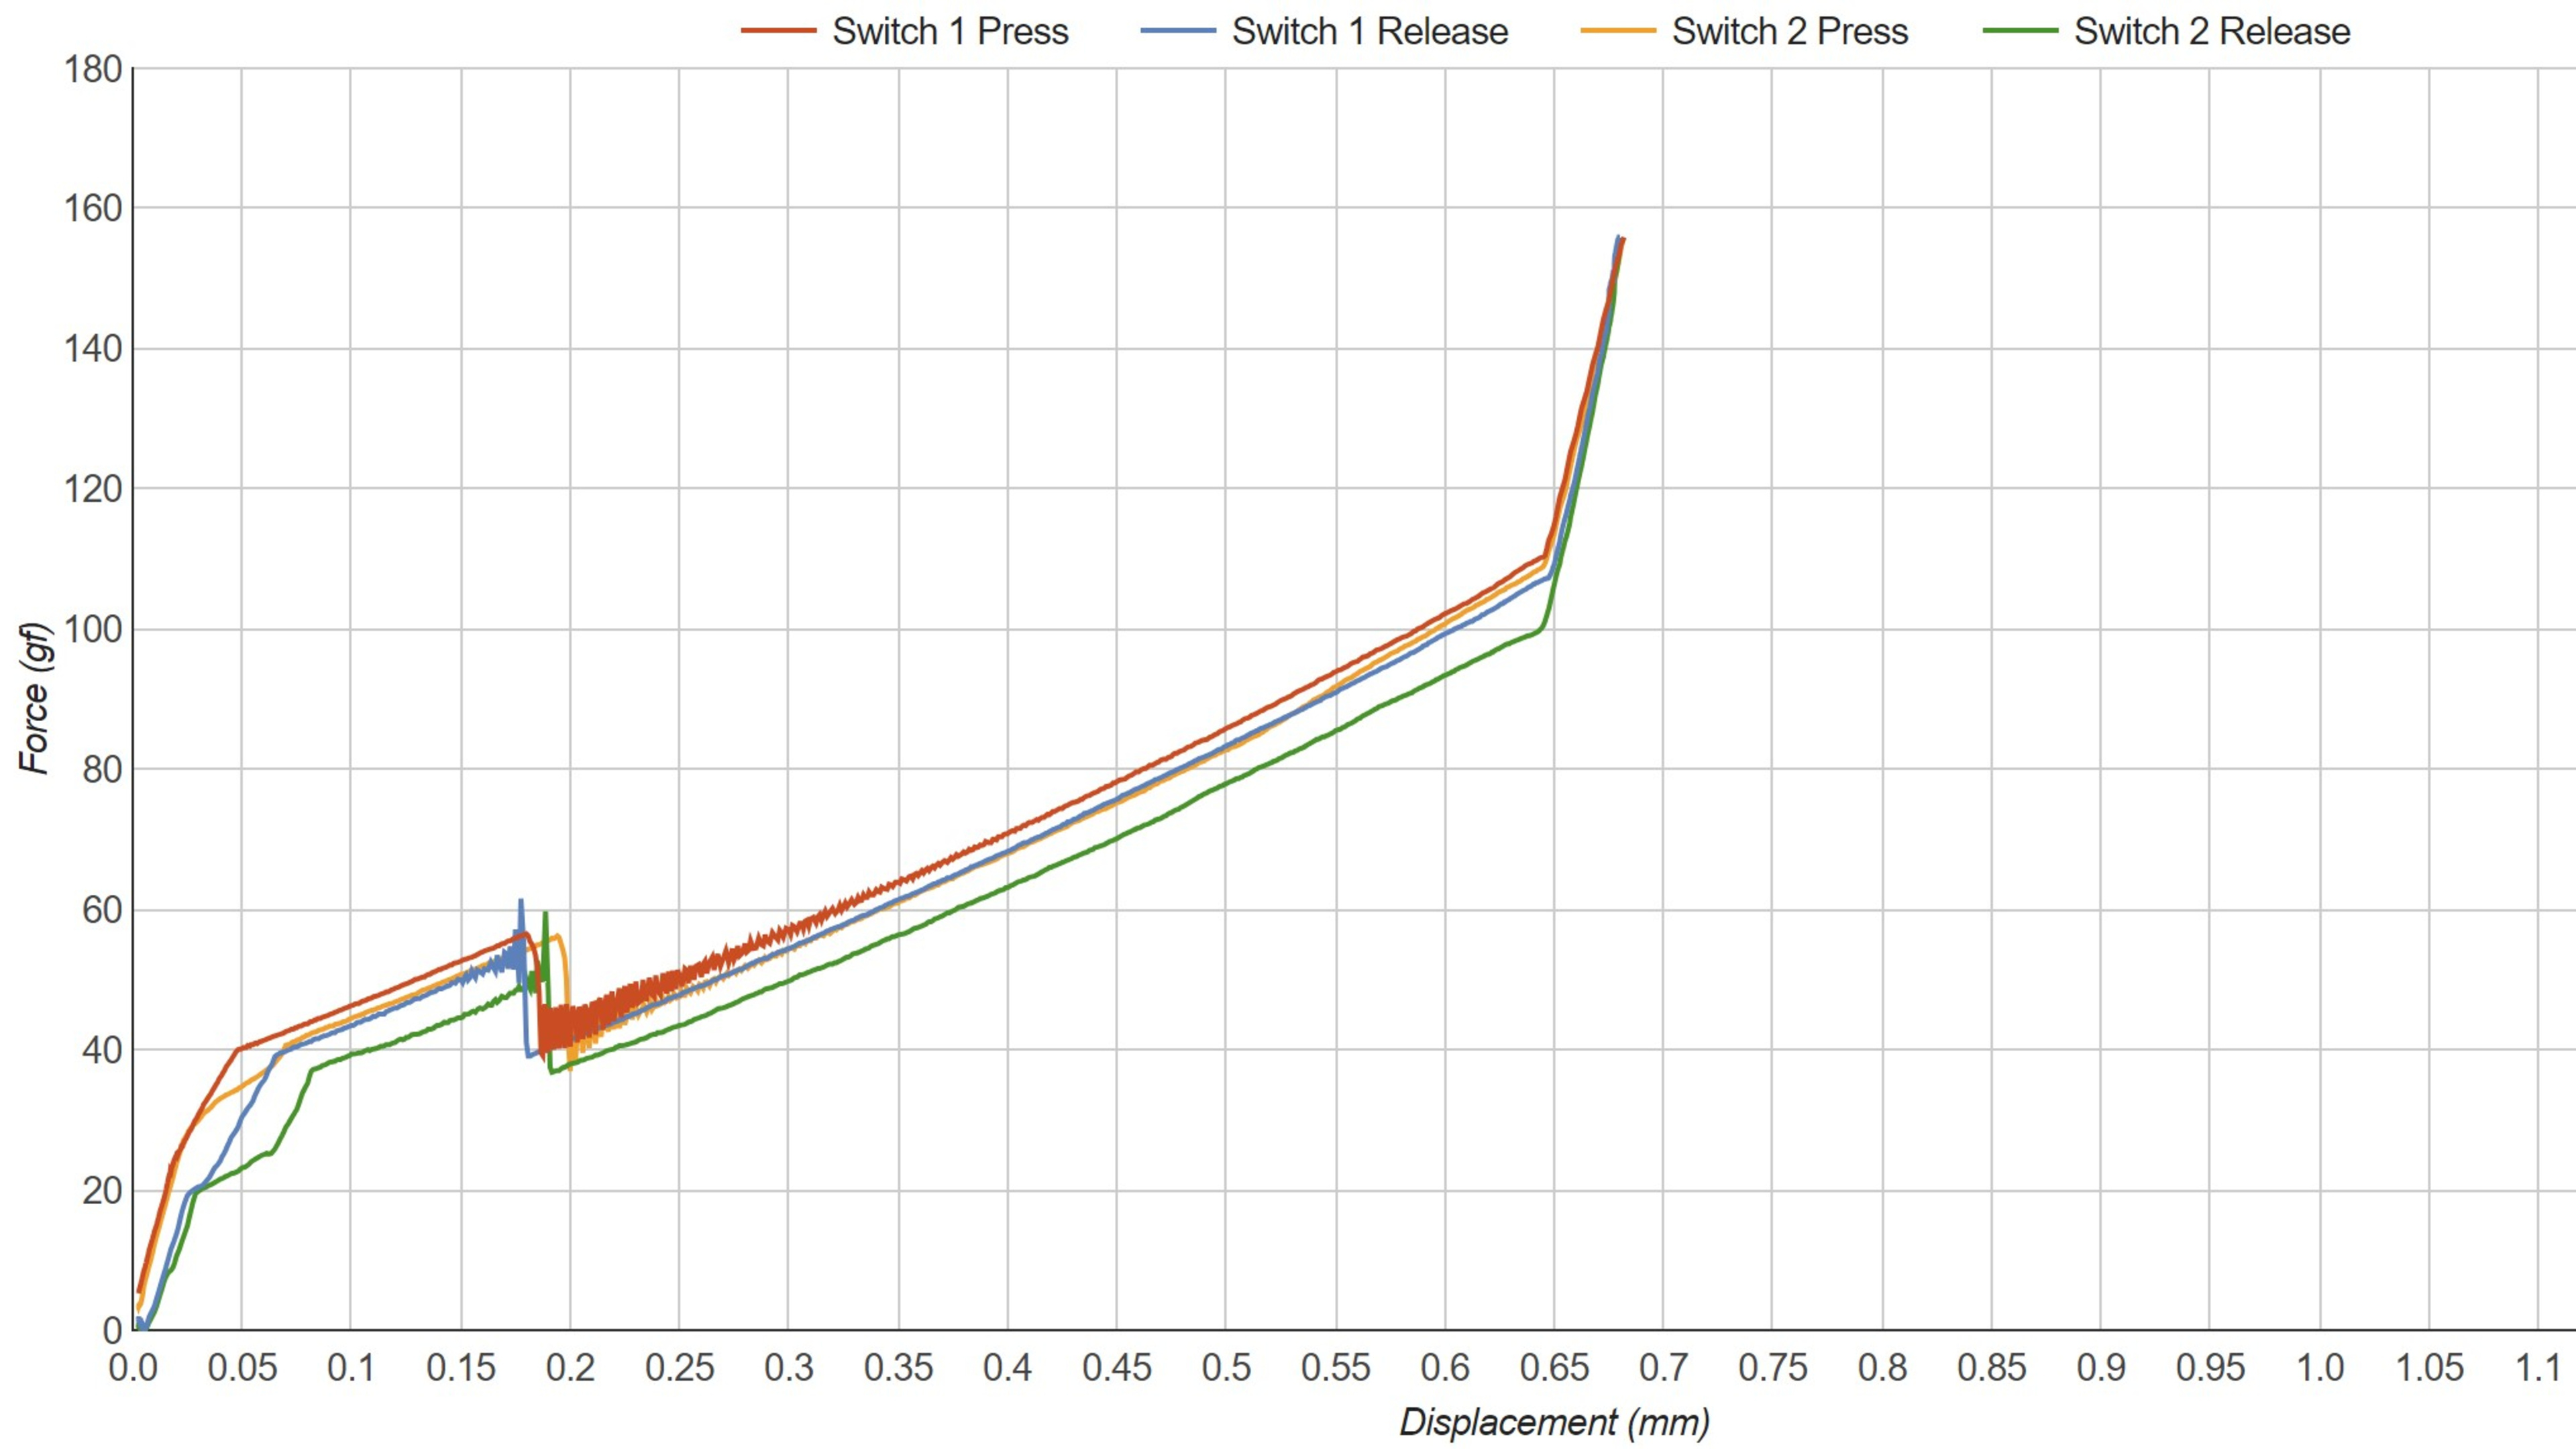
We also tested the ASUS ROG Chakram core to evaluate the variance between the left and right switches. The Chakram Core has hot-swappable switches, so, to eliminate as many variables as possible, we tested both switches in the left switch socket. We also removed the button cover to test directly on the switch. The switches in this mouse are the Omron D2FC-F-K (50M).
We can see from the actuation graphs that there's a very small but noticeable difference between the two switches. It's just another example of how switches can vary in terms of actuation characteristics and how the actuation characteristics can differ even between left- and right-click buttons on the same mouse. Differences this small are very minor and likely aren't noticeable when using the mouse normally.
These investigations are a good indicator that our test is accurate but sensitive to small changes. This can be good for differentiating minor differences between two mice (or two mouse buttons); however, there's a risk that reading too far into results can generate incorrect conclusions. Small differences like the ones seen in the Omron D2FC-F-K (50M) comparison above are visible but very difficult to perceive when using the mouse. Conversely, differences like the one shown in the Haste 2 could be distracting for some enthusiasts.
Comparing mice with the same switches but different build
An important aspect to consider when purchasing a mouse isn't only the switch but how the switch performs within that mouse. Not all switches will perform equally, given a different mouse body. Switches each have specific characteristics (like tactile force and travel distances), but how the switch is implemented will impact to what degree these characteristics are felt.
To demonstrate, we can compare several mice that use the same switches. The Razer Basilisk V3 Pro, Razer Cobra, and the Razer Viper V2 Pro all use Razer Optical Mouse Switch Gen 3 switches, but there are identifiable differences in the click characteristics between them. The graphs below show that the tactile force, pre-travel, and total travel all vary by a sizeable amount. Some of this variation may be due to switch variance, but it's unlikely that it would be this significant for all three mice. It's more likely that the mouse construction and how the switch is implemented impact how the main button feels and performs.
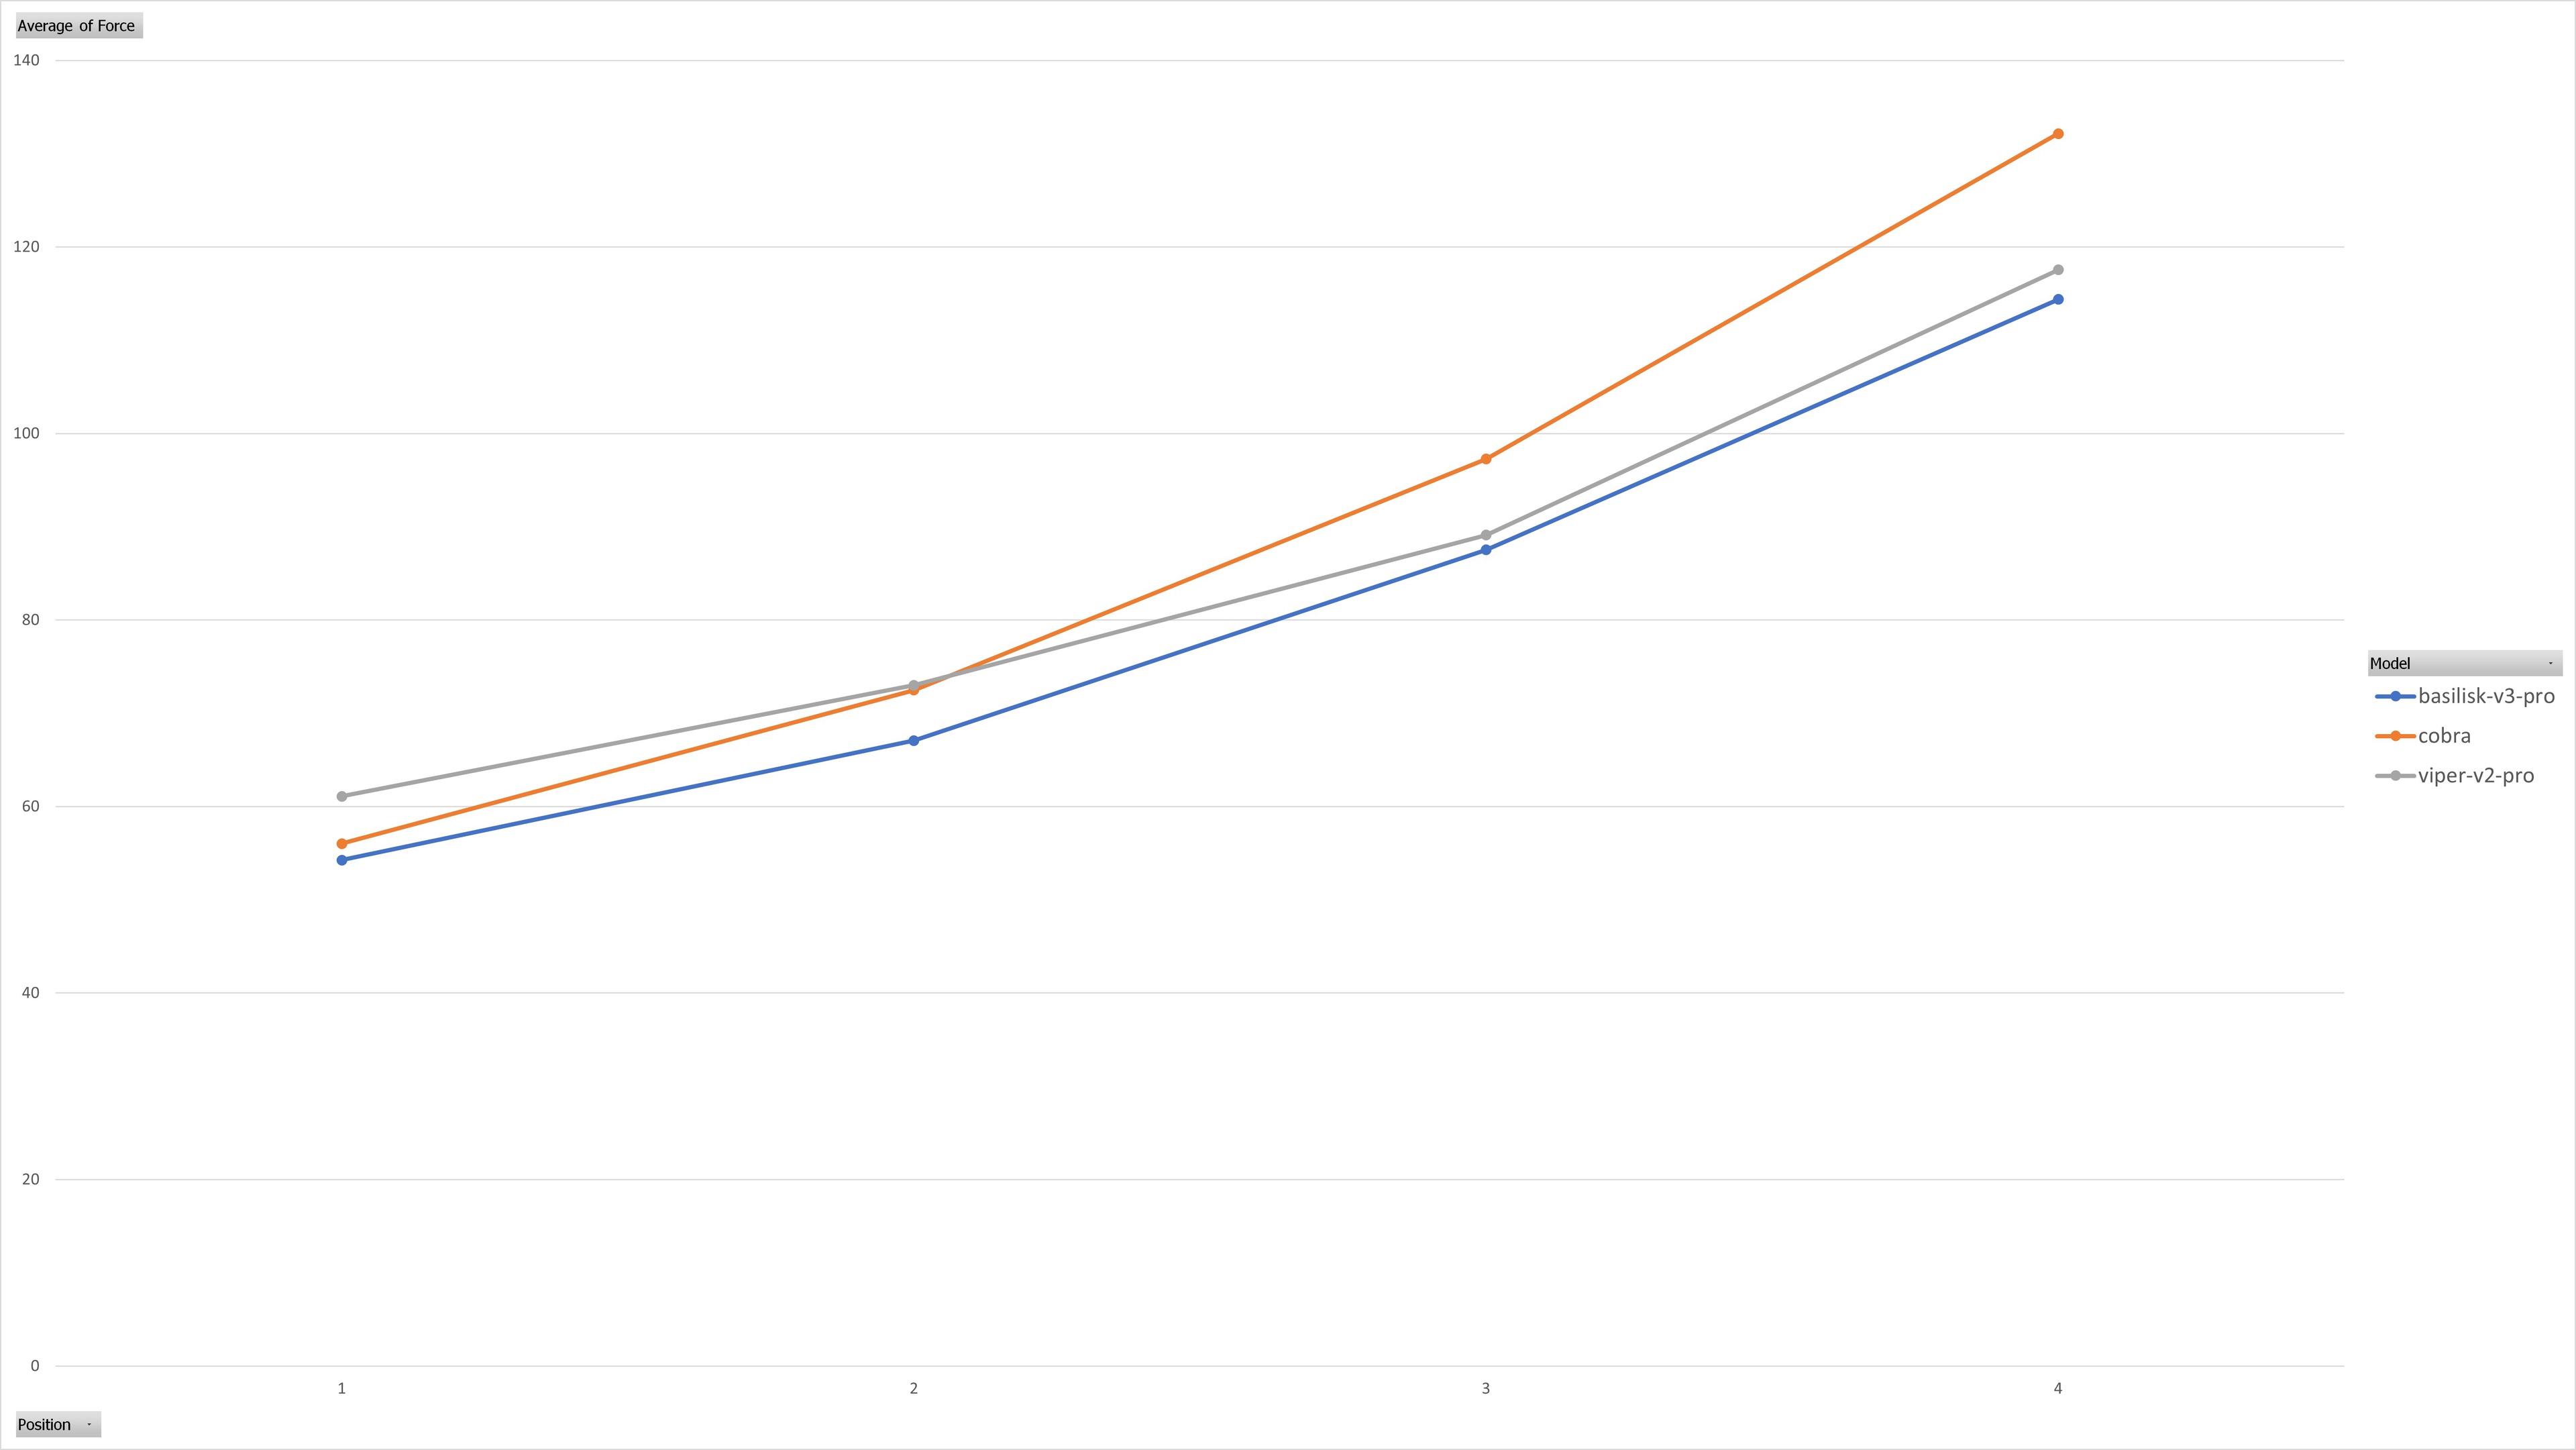
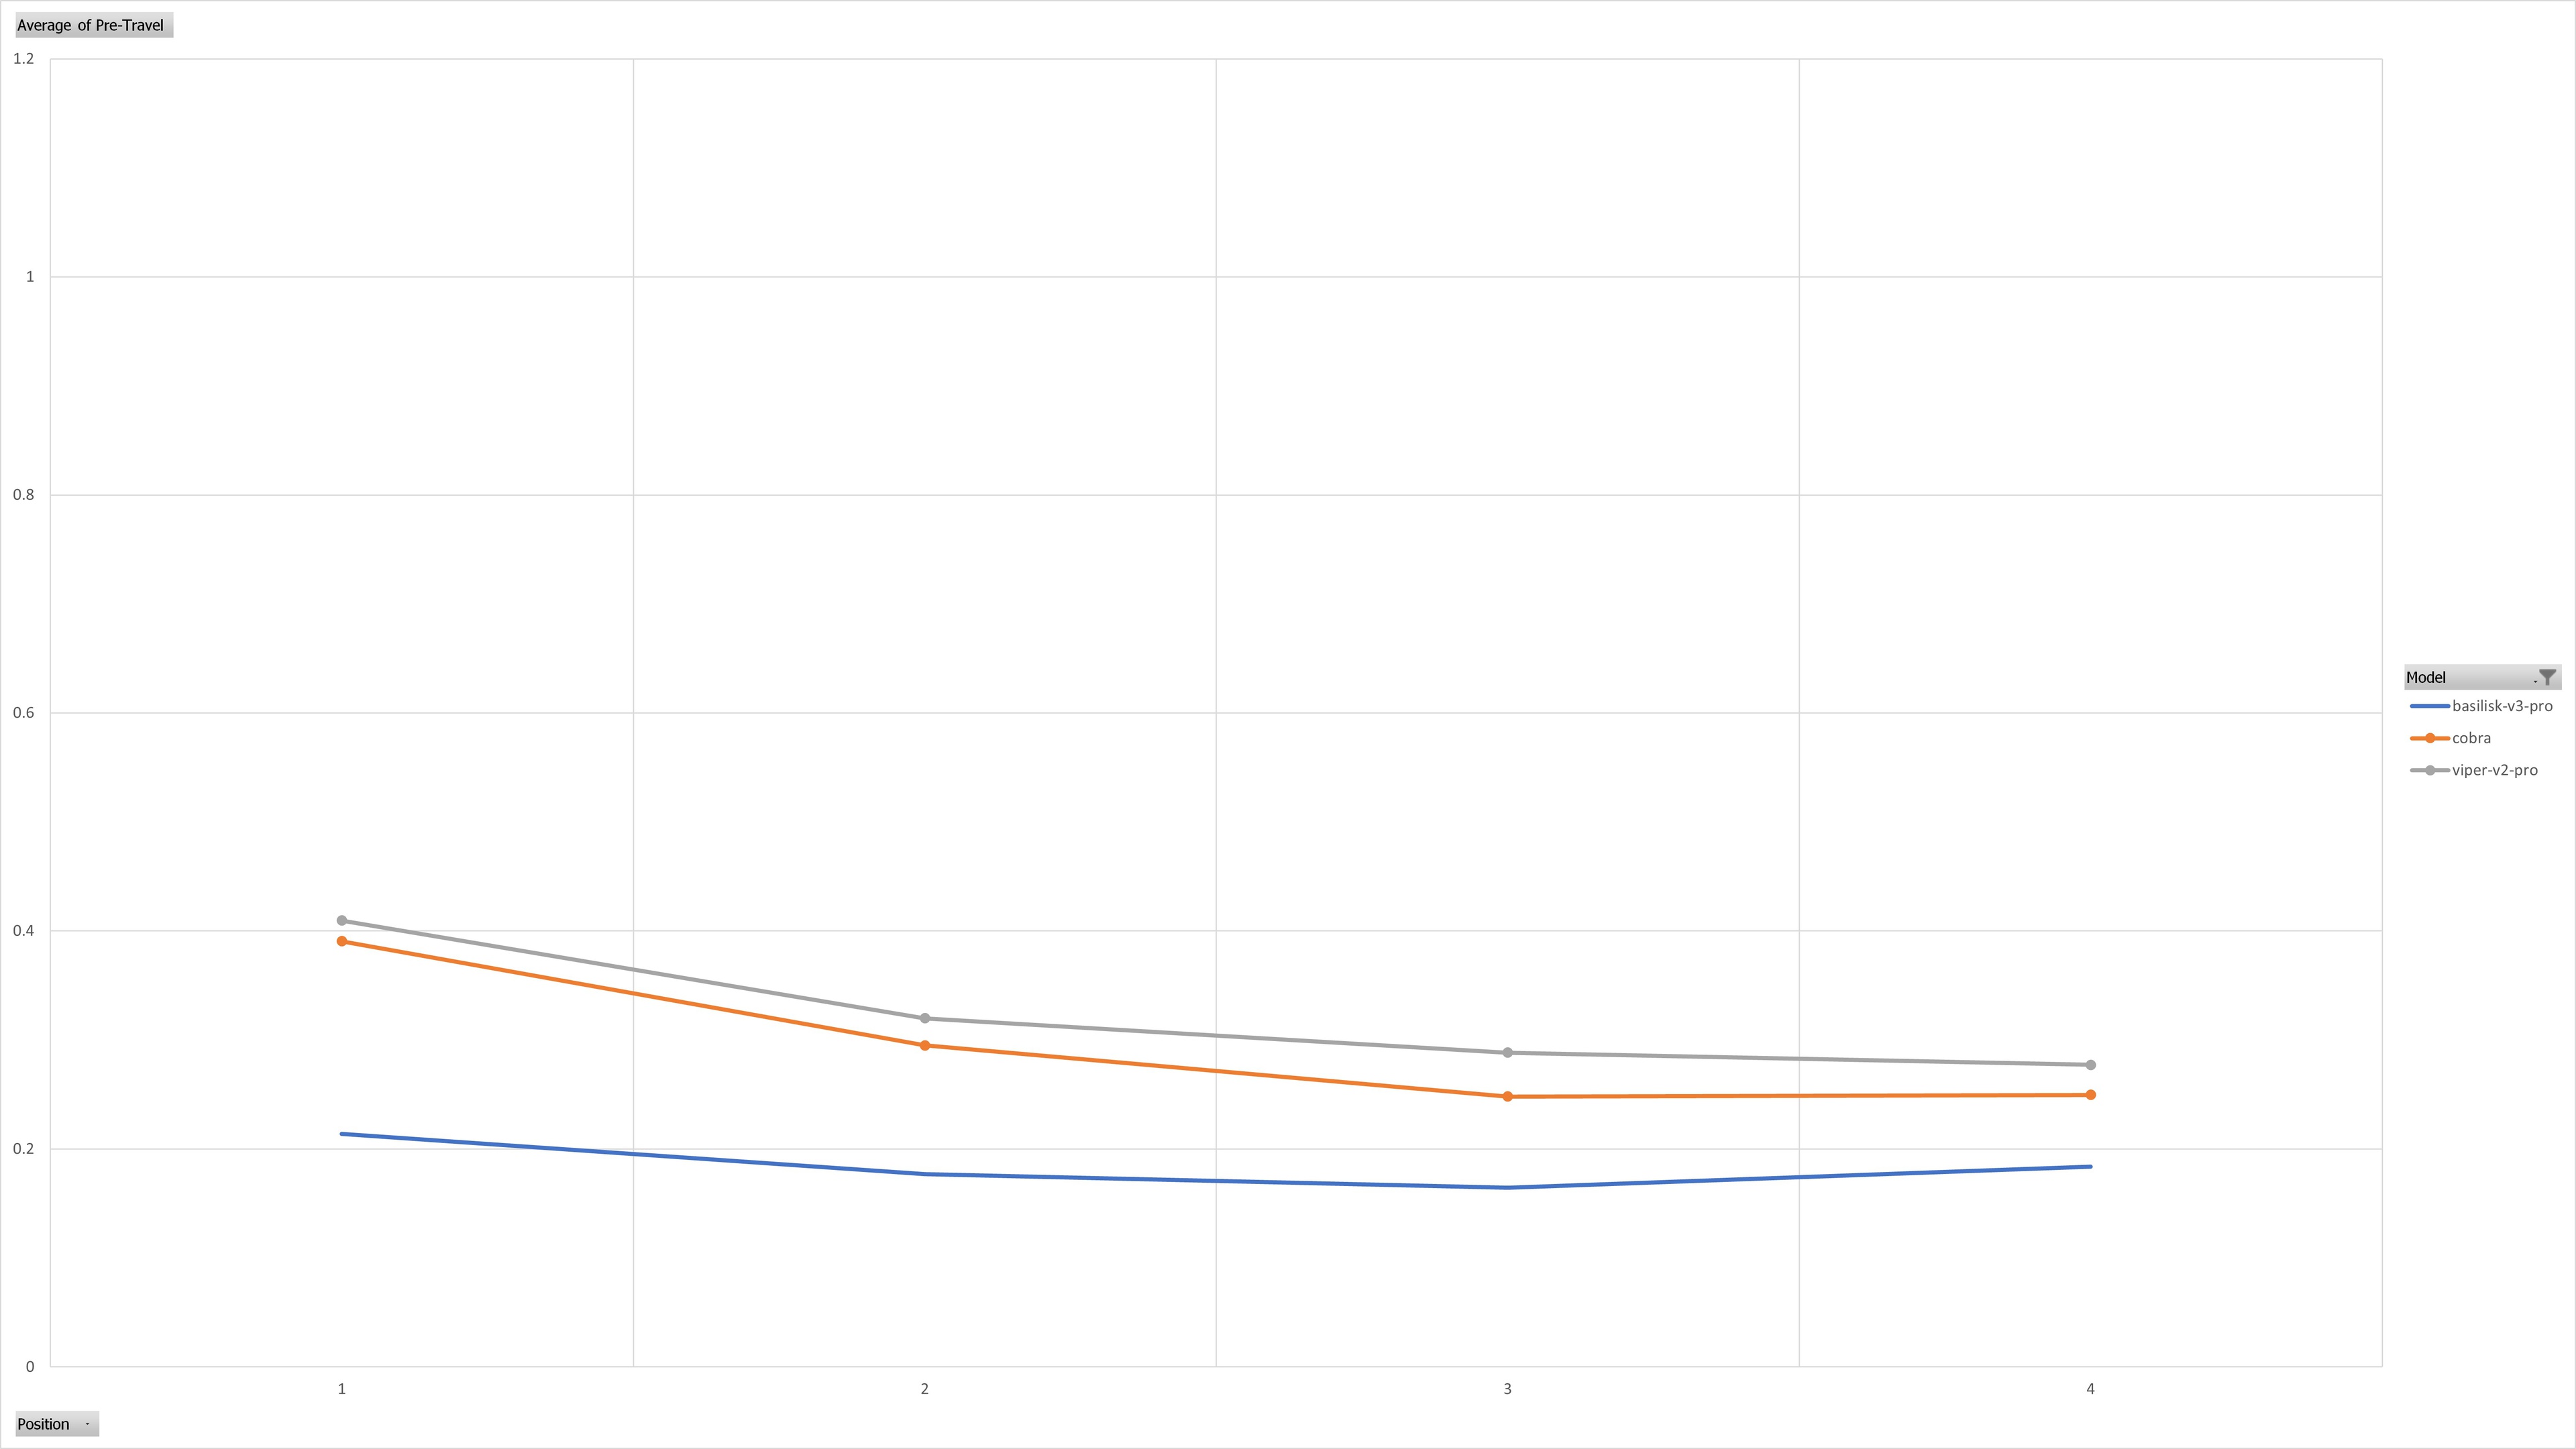
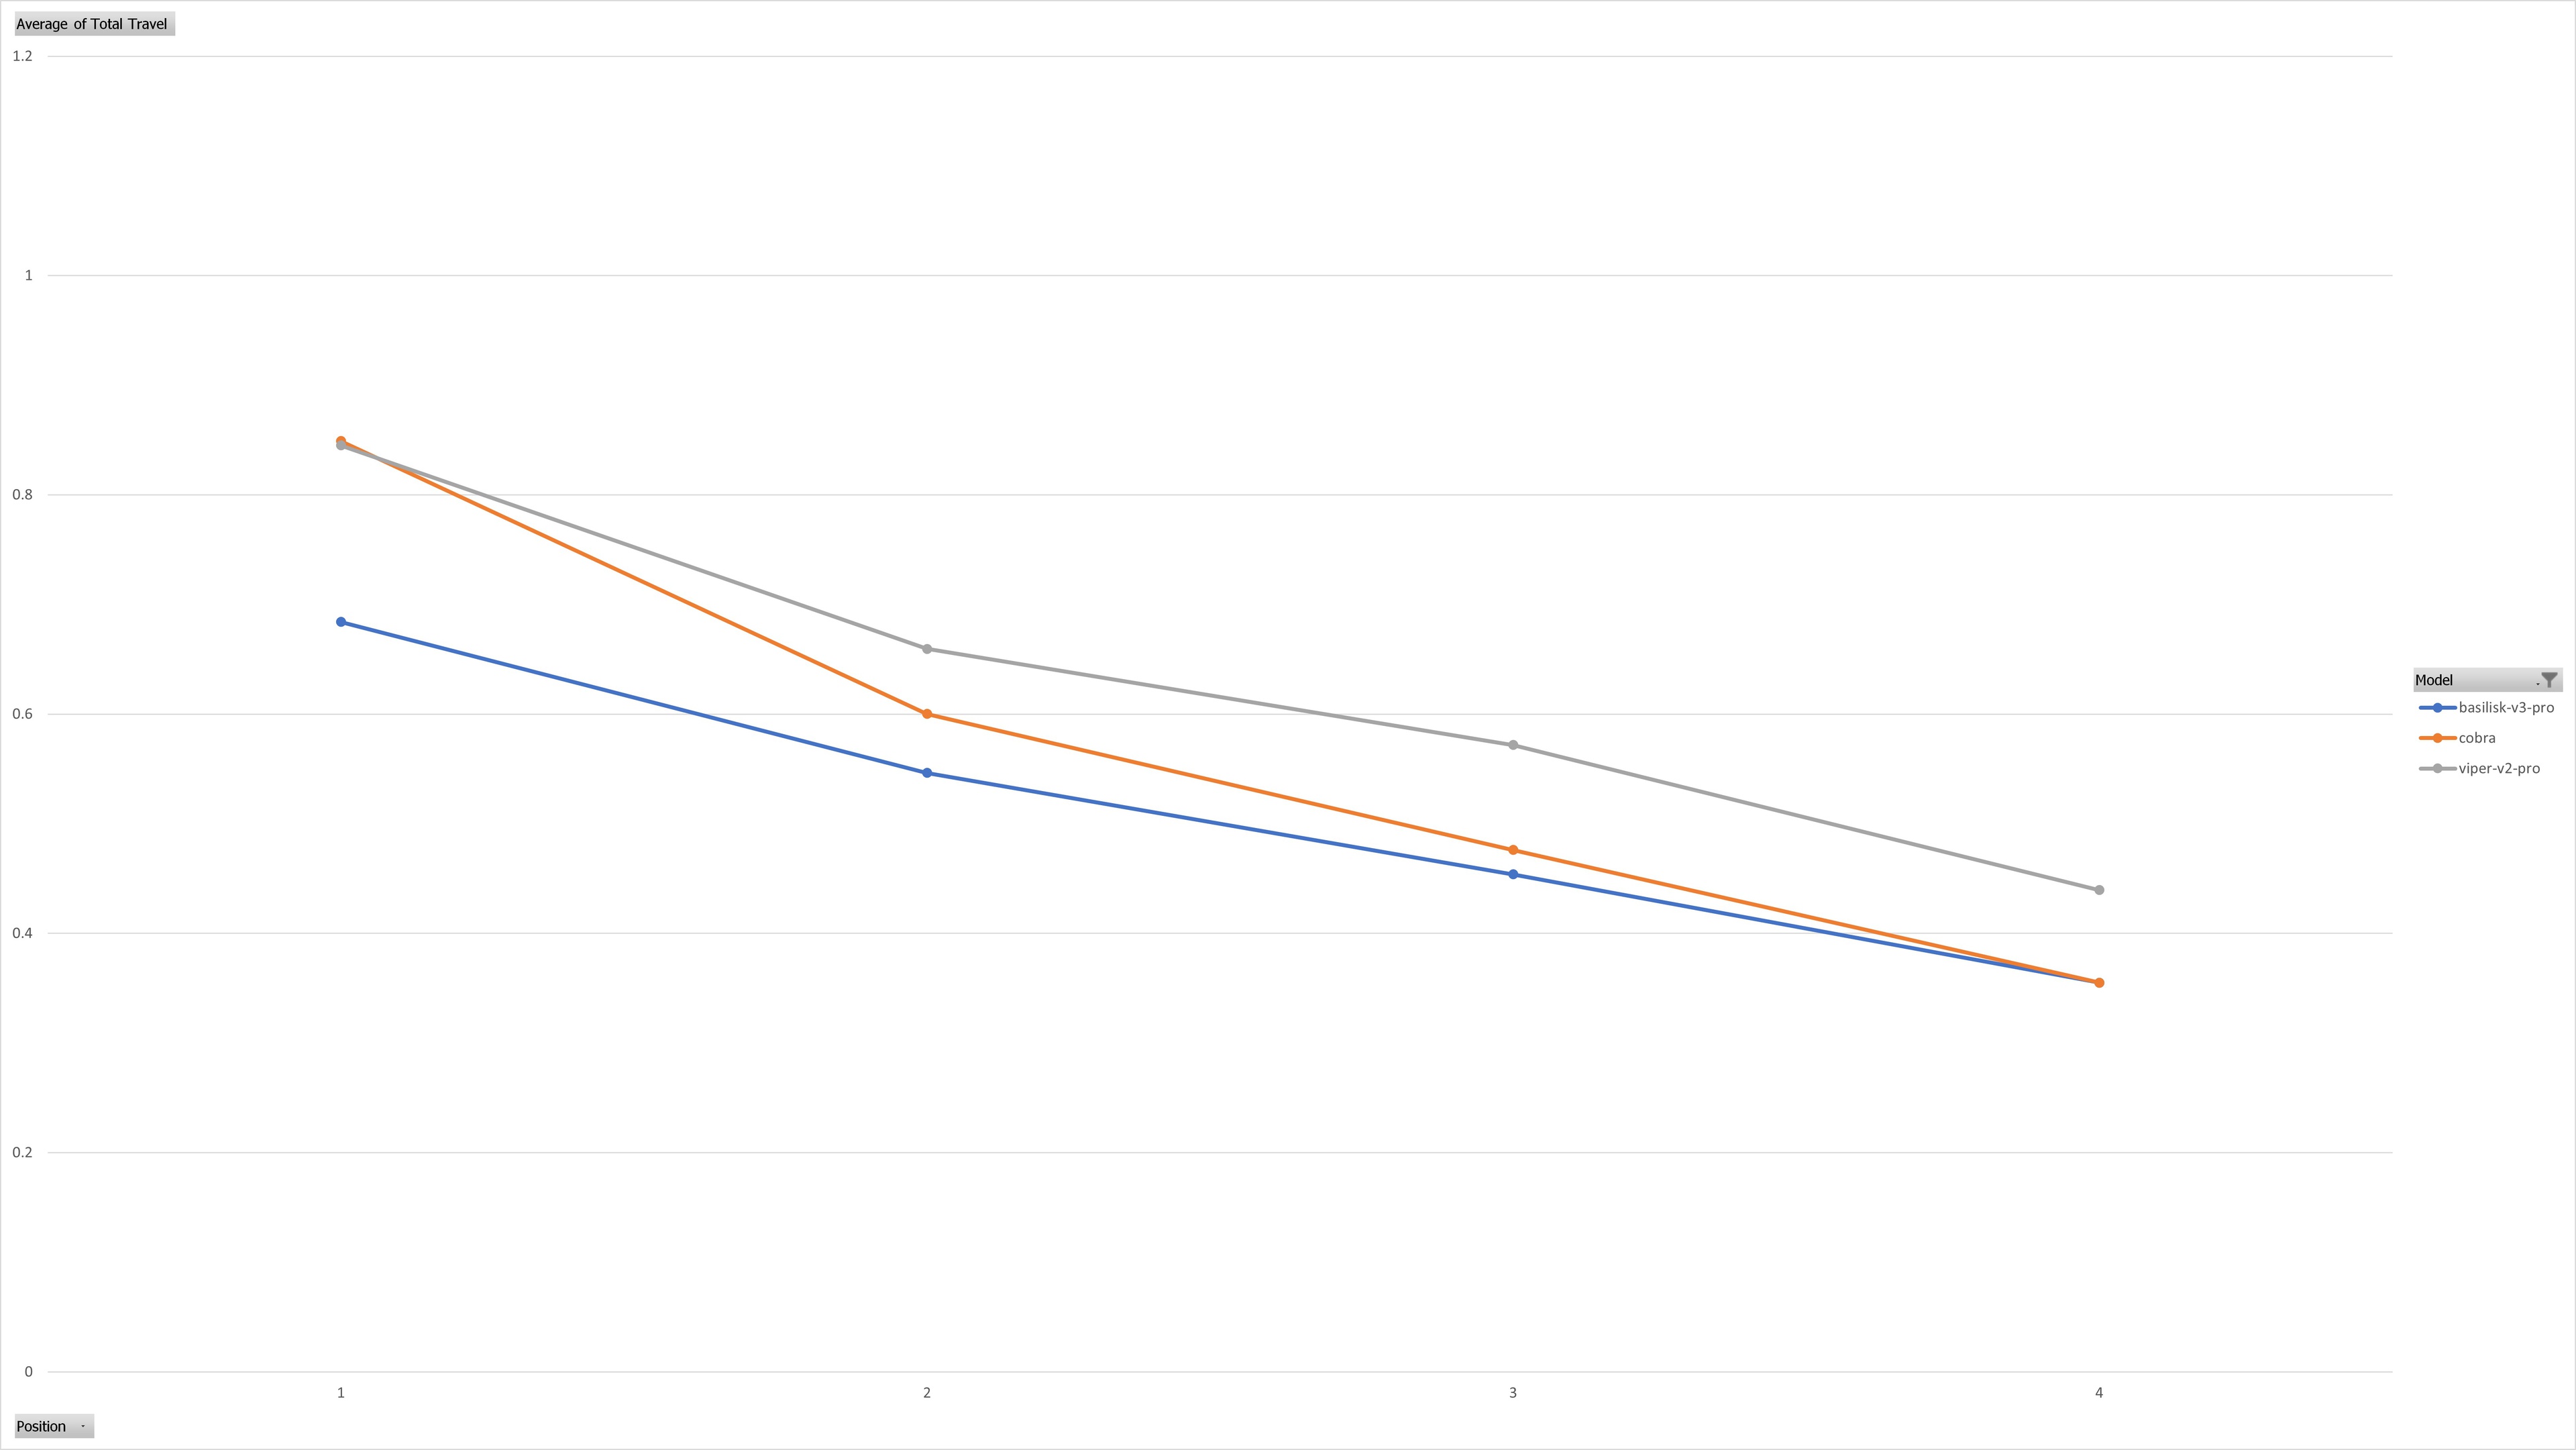
Because of this variance, it's difficult to recommend a specific switch without knowing how that switch will perform in a specific mouse body. Just because a switch has a specific tactile force or displacement doesn't mean those characteristics will translate when implemented into a given mouse.
Other features that could affect tactile force
One design feature influencing actuation characteristics is the hinge placement and whether a spring is used to keep the button against the switch. Since having a gap between the mouse button and the switch can feel distracting, mice manufacturers use different ways to keep the button against the switch.
For example, both the Razer Viper 8KHz and the ASUS ROG Chakram Core have springs that keep the mouse button pressed against the switch; however, they operate slightly differently. These springs push the mouse button down slightly in both cases, but depending on spring strength, location, and angle, the force of these springs can impact actuation results differently.
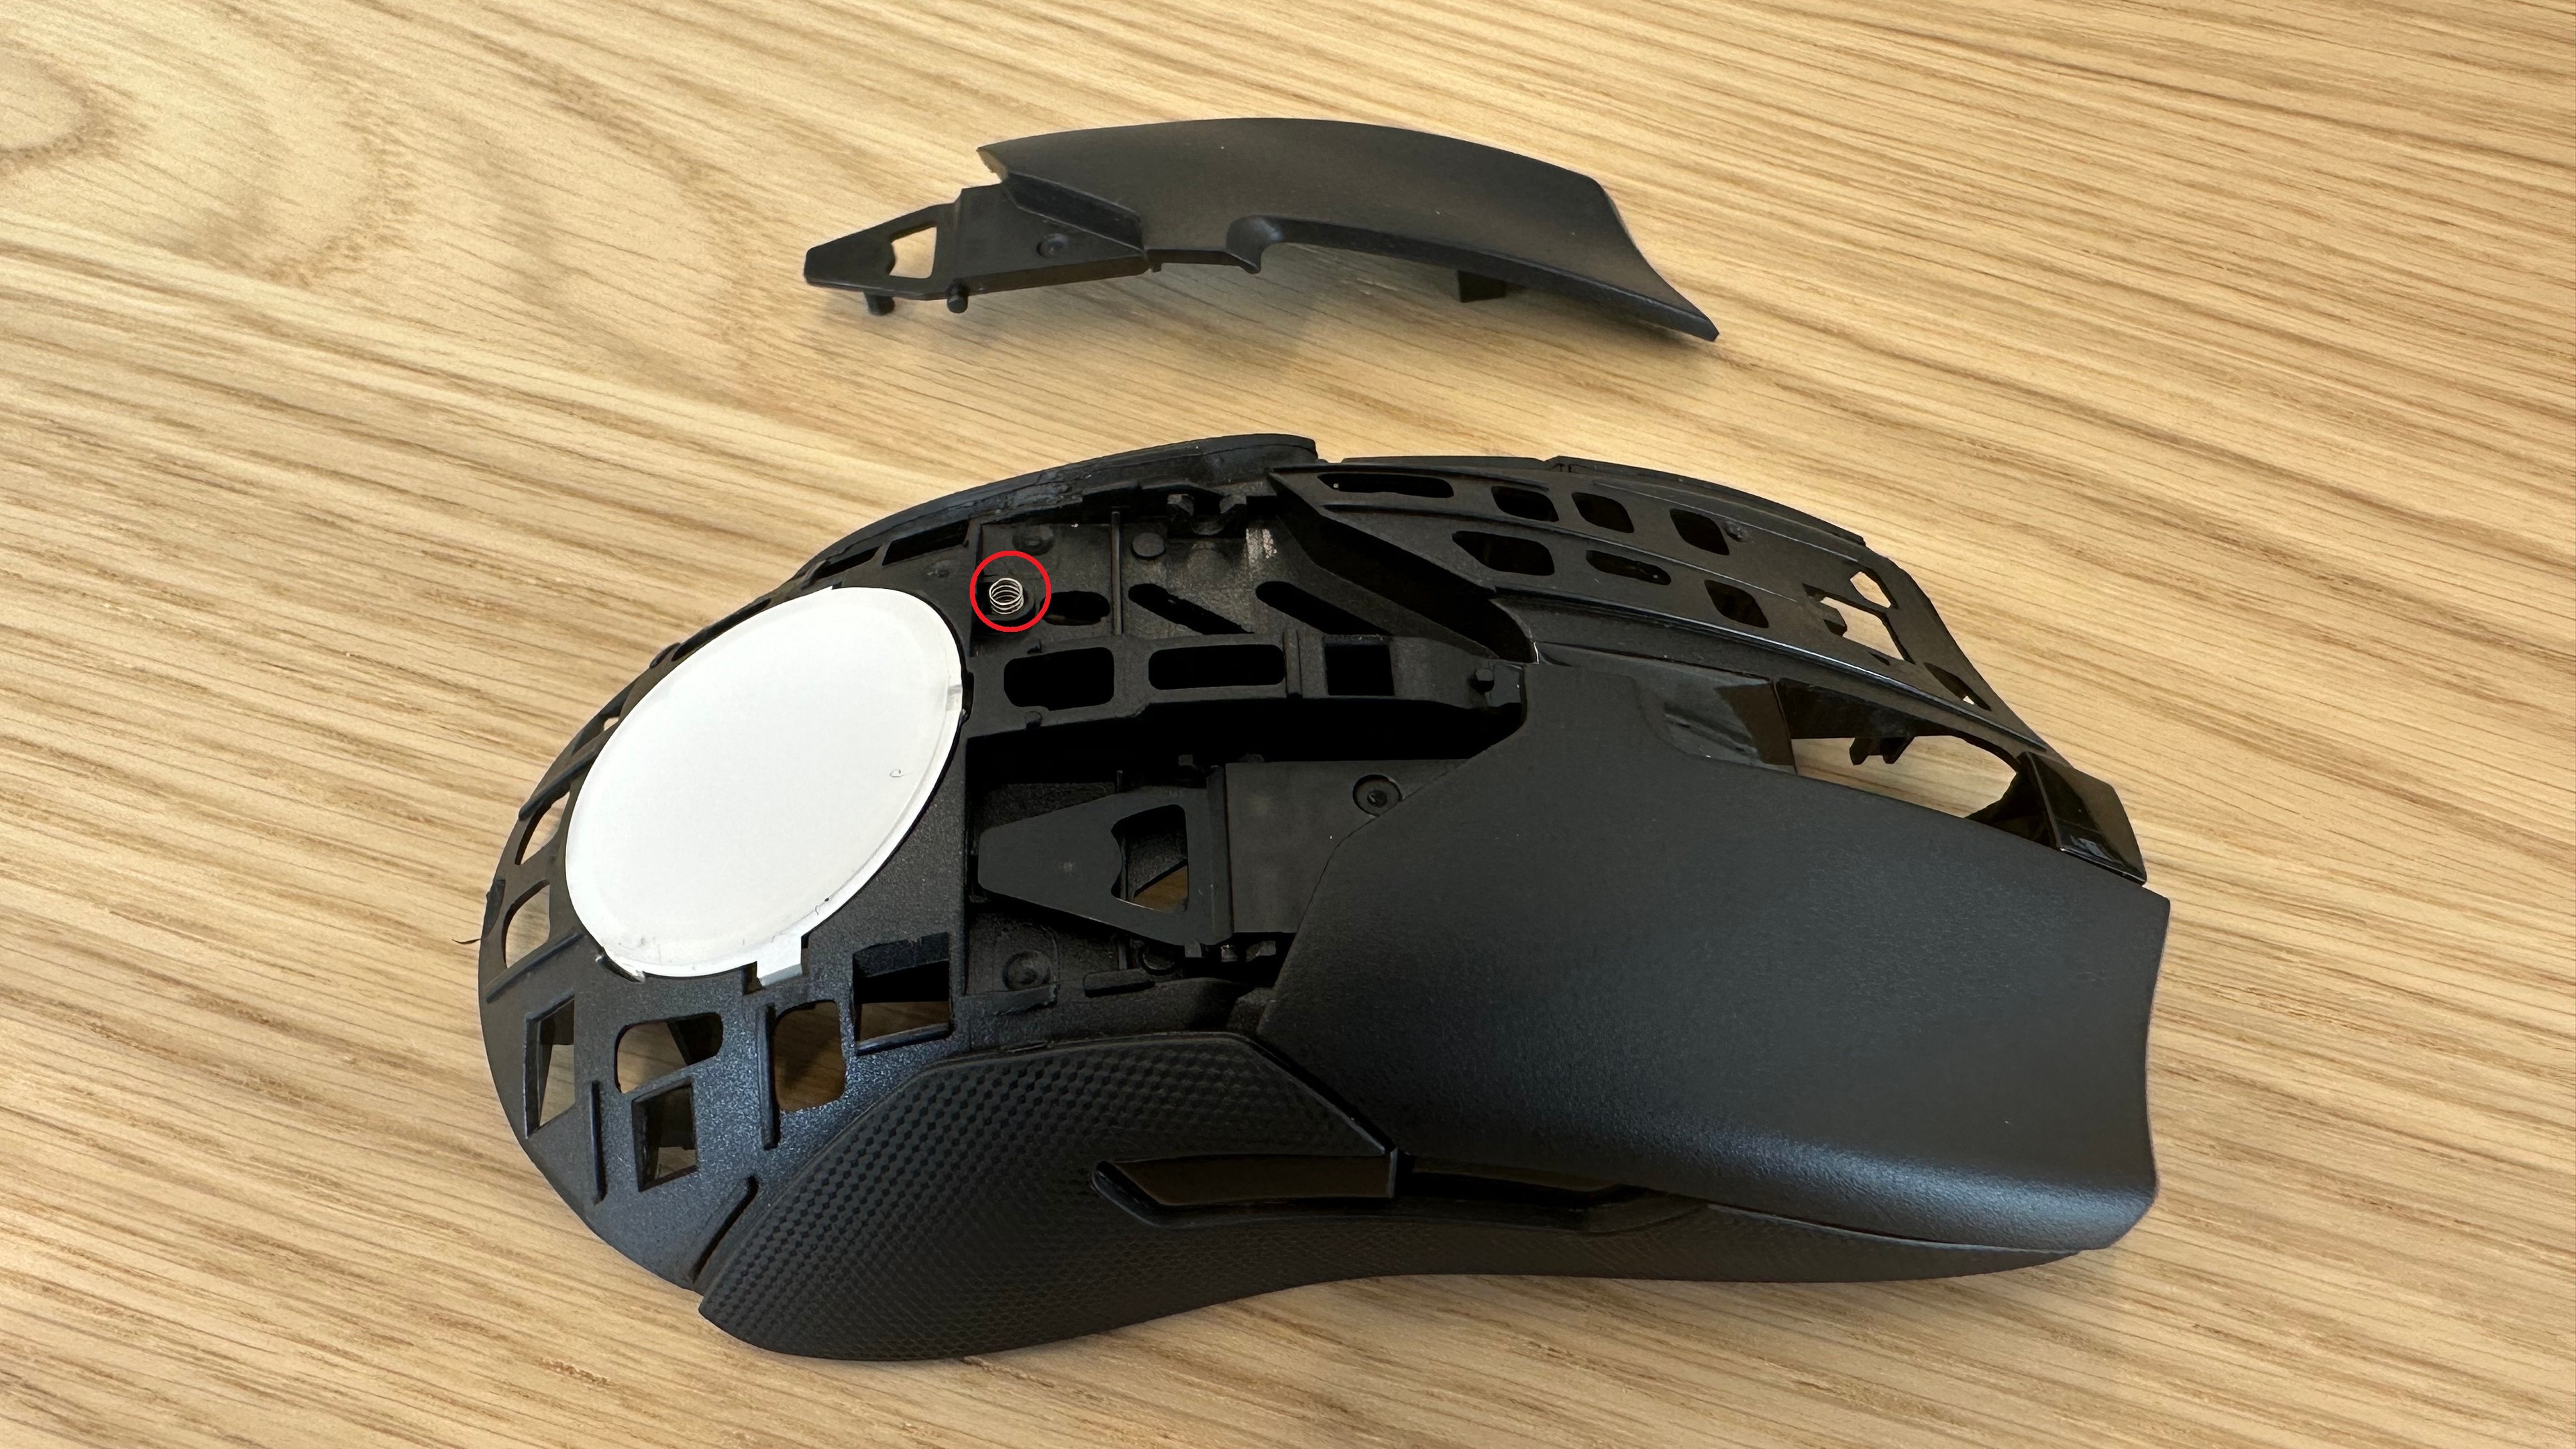
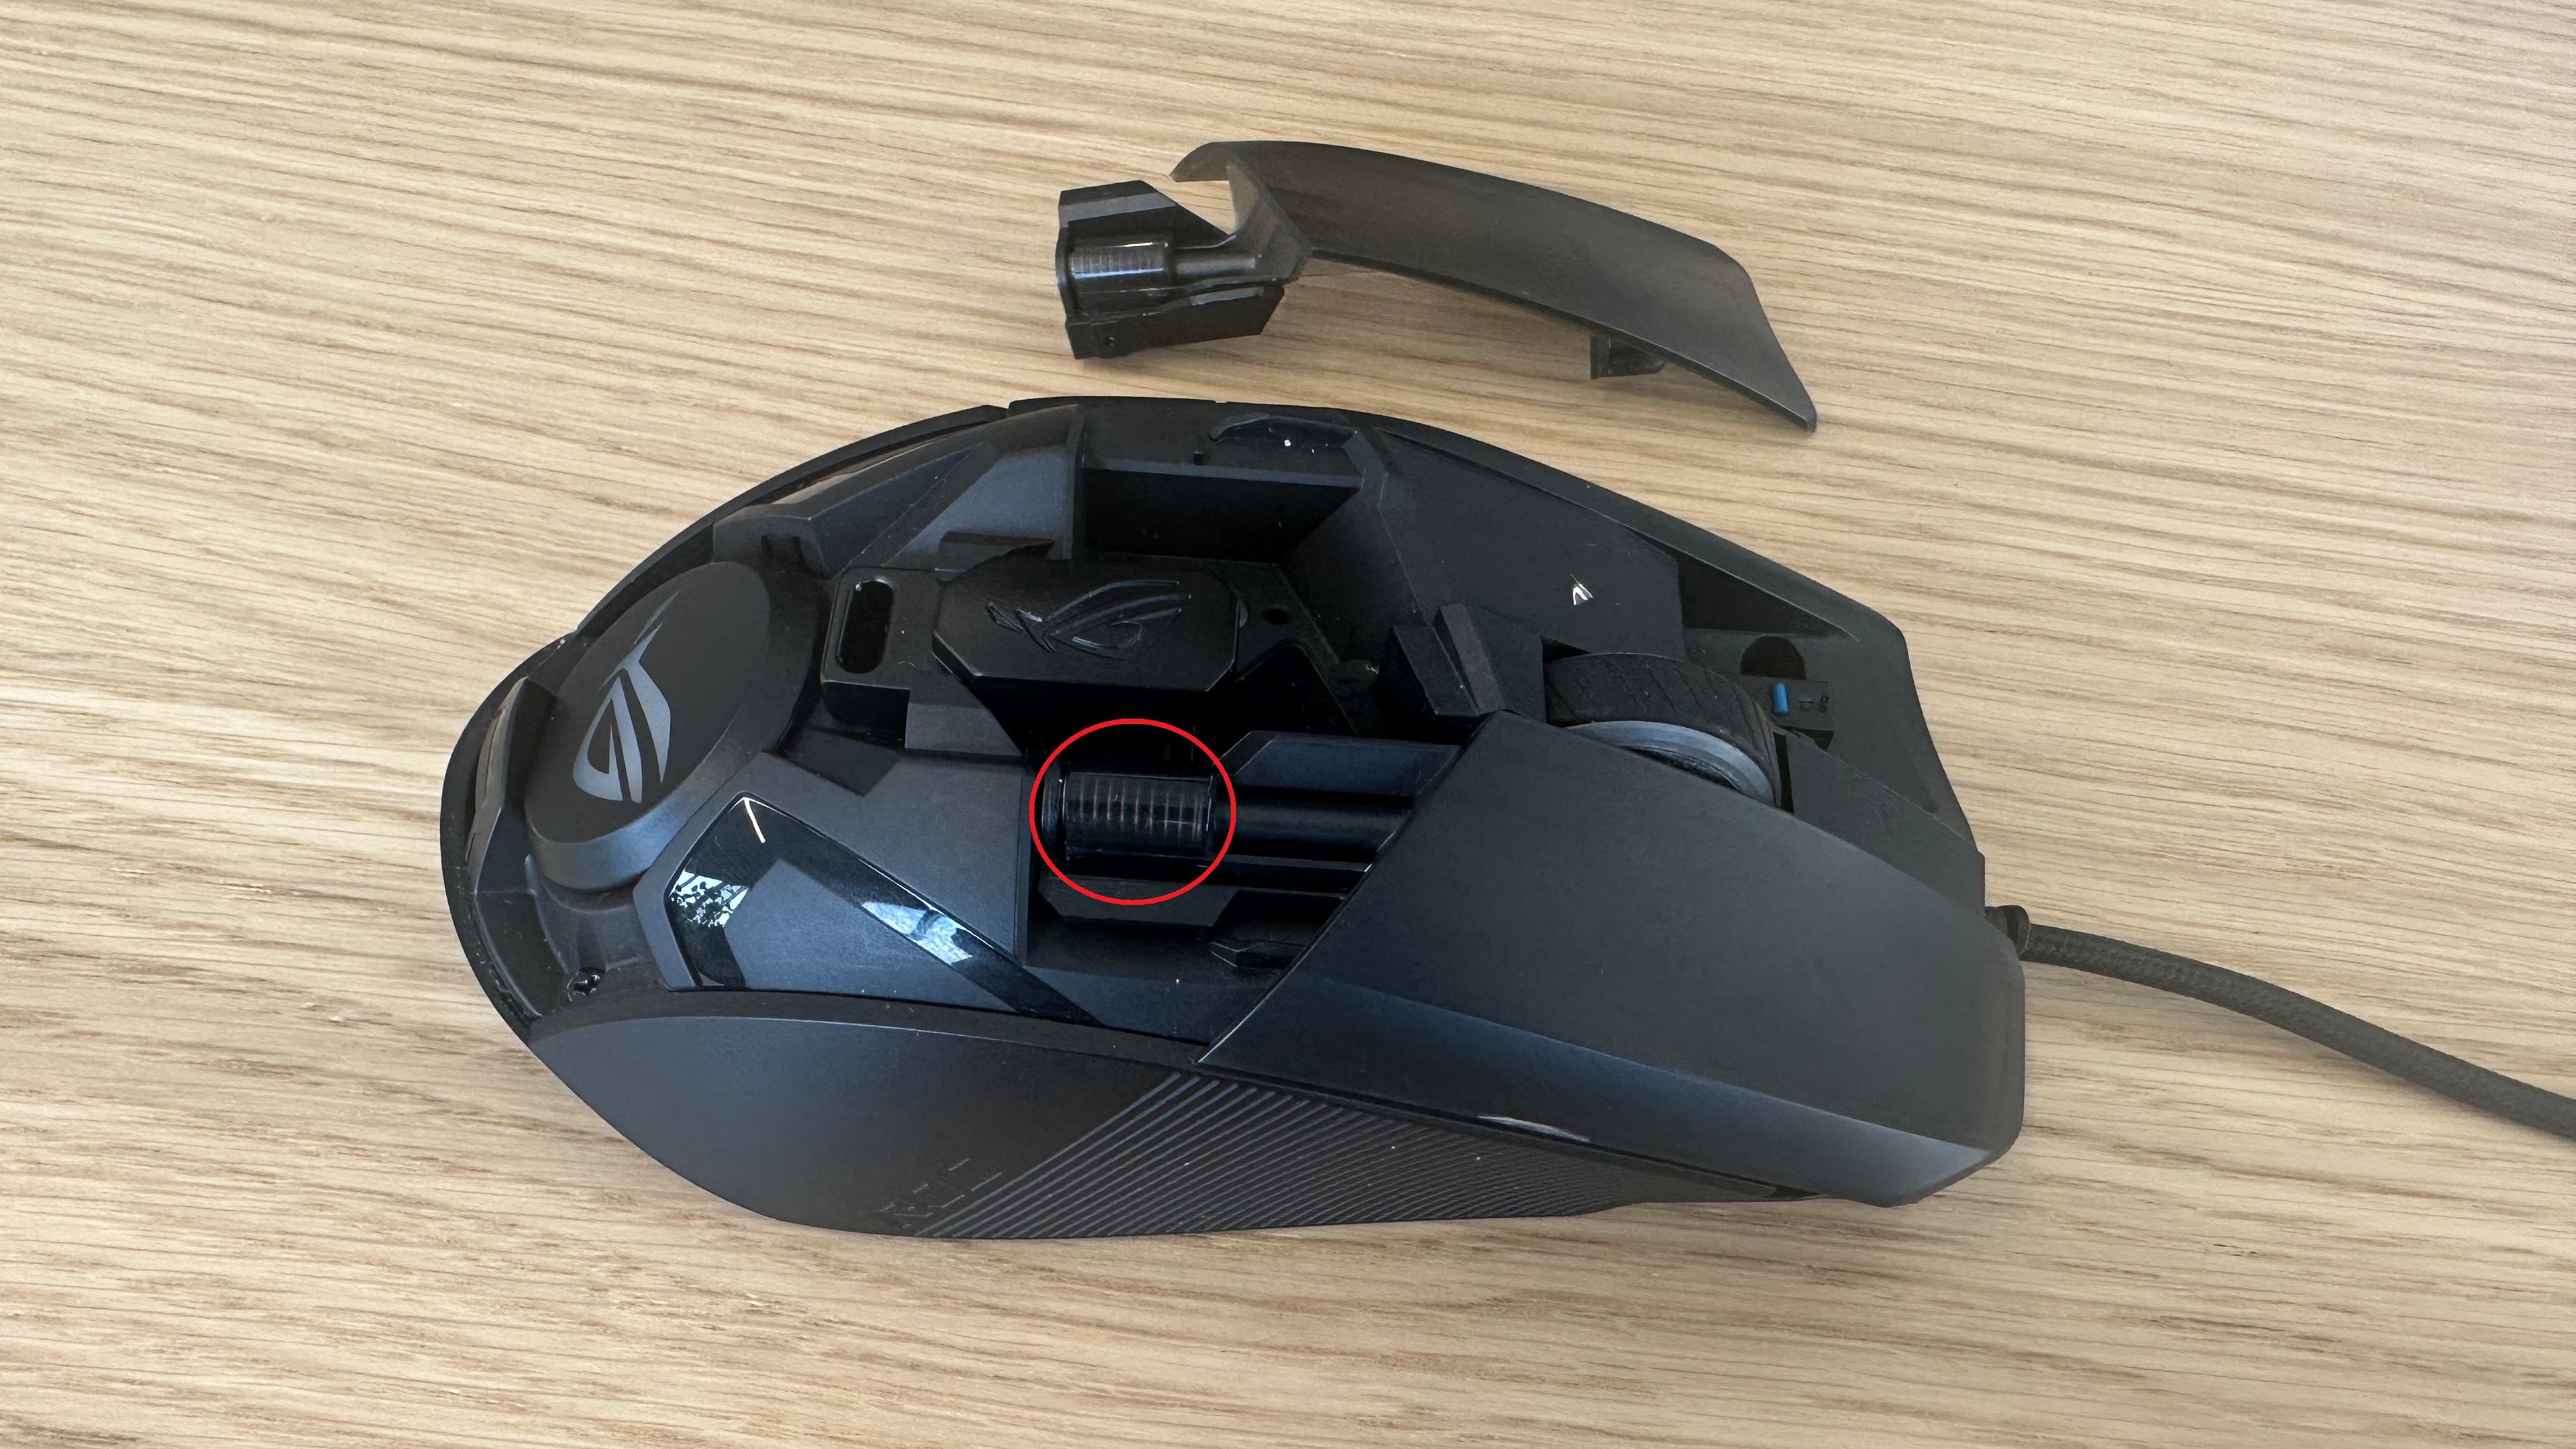 ASUS ROG Chakram Core with button removed and button spring highlighted.
Another method manufacturers use to keep the mouse button against the switch is by designing the button shell in one piece instead of having the buttons hinge. Mice like the BenQ Zowie FK1-B are designed like this.
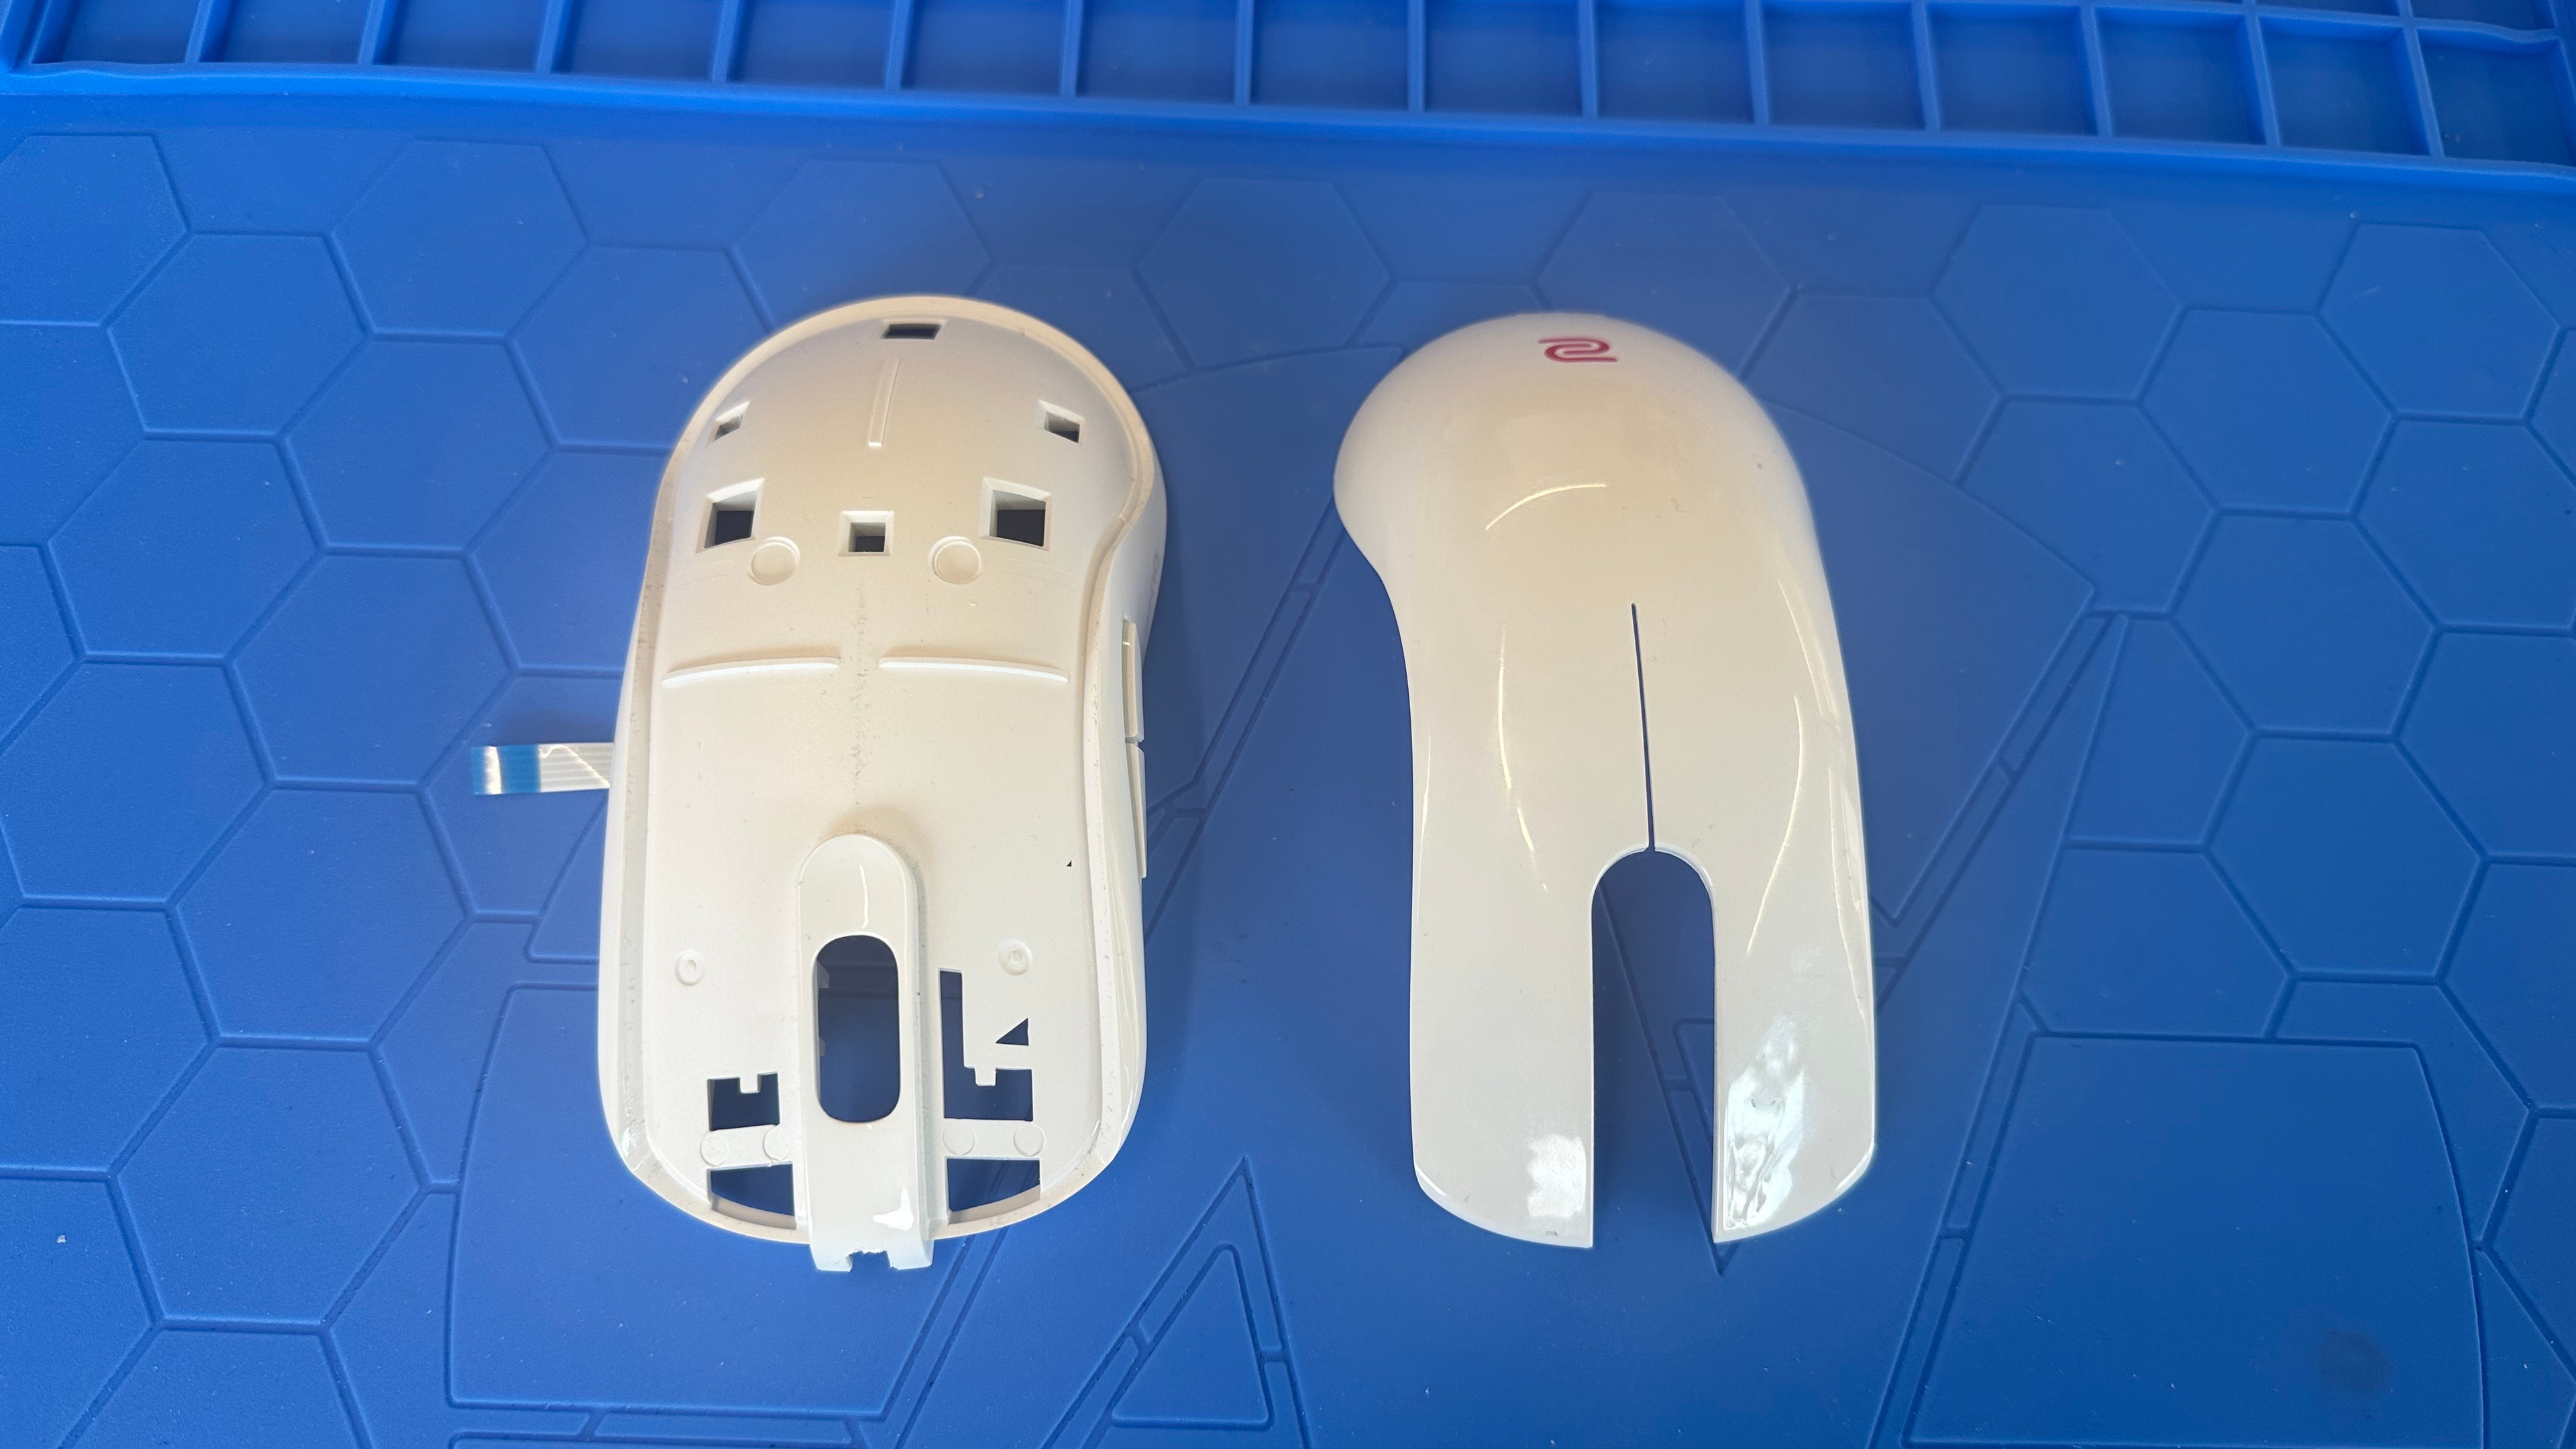 BenQ Zowie FK1-B with the top shell removed.
Can we suggest a mouse based on tactile force and grip Style?
As mentioned, depending on your hand size and grip style, certain mice may be more or less suited to you based on tactile force where your fingers rest. Using the distance/force actuation graphs, we can identify the tactile force required to actuate the main button, depending on where you rest your finger. This can help recommend a mouse for different hand sizes, grip styles, and tactile force preferences. Using both the Hand Size Recommendation box and the new Main Button box together provides the best indication of how the mouse main button performs.
One great example is the comparison between the Logitech MX Master 3S and the Fantech Aria XD7. When we compare the tactile force/displacement graph for these two mice, we see that the MX Master 3S is lower in tactile force for any given point. However, that doesn't tell the whole story.
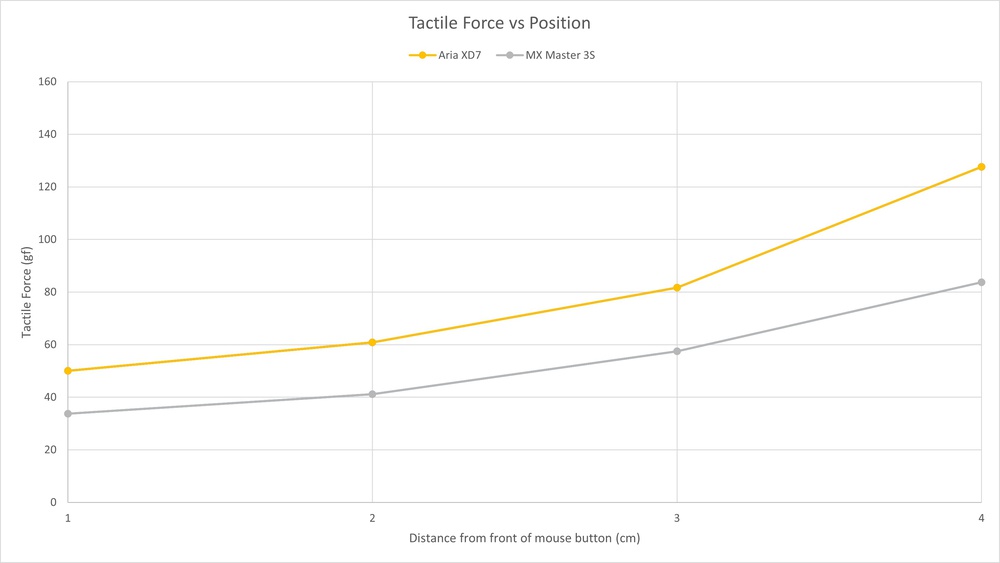 Tactile Force vs. Position graph for the Logitech MX Master 3S and the Fantech Aria XD7.
The Logitech MX Master 3S has a much larger body than the Fantech Aria XD7, which can be seen using our Shape Compare Tool. As a result, a person will likely be placing their fingers further from the front of the main button on the MX Master 3S for a given hand size and grip. A great example of this can be seen using the Hand Size Recommendation box.
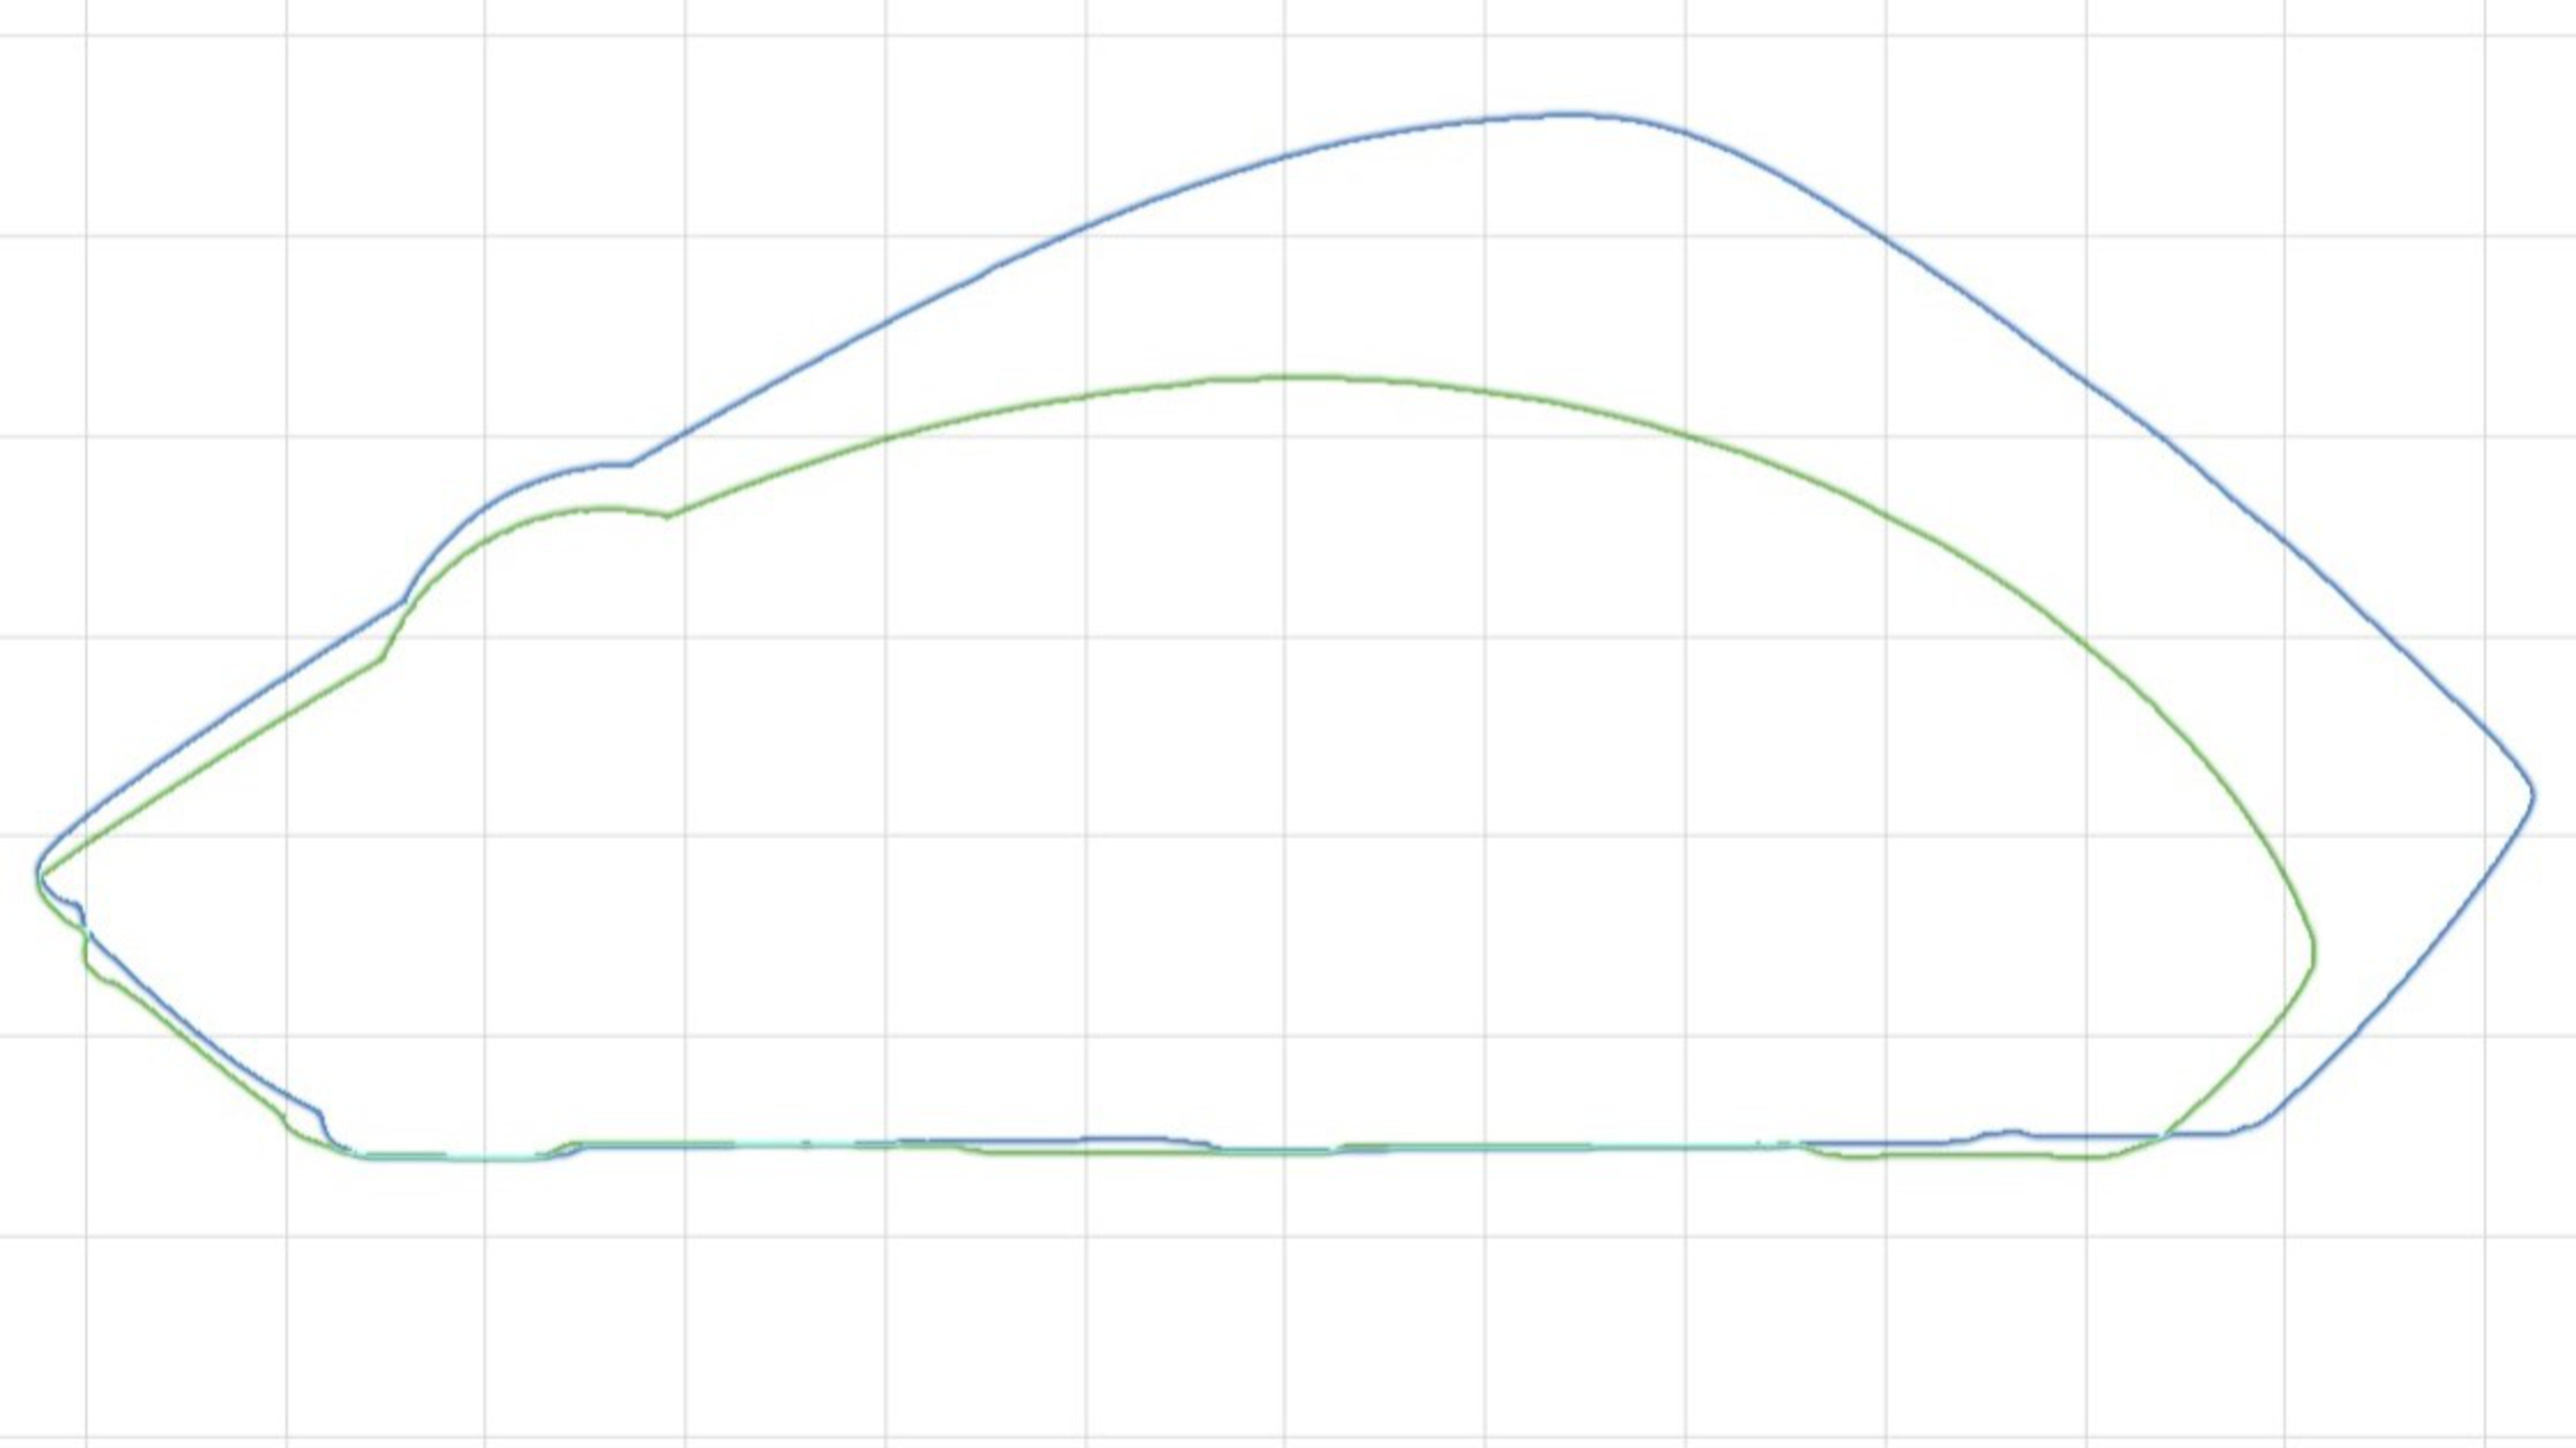 Logitech MX Master 3S (blue) vs. Fantech Aria XD7 (green) side profile outline.
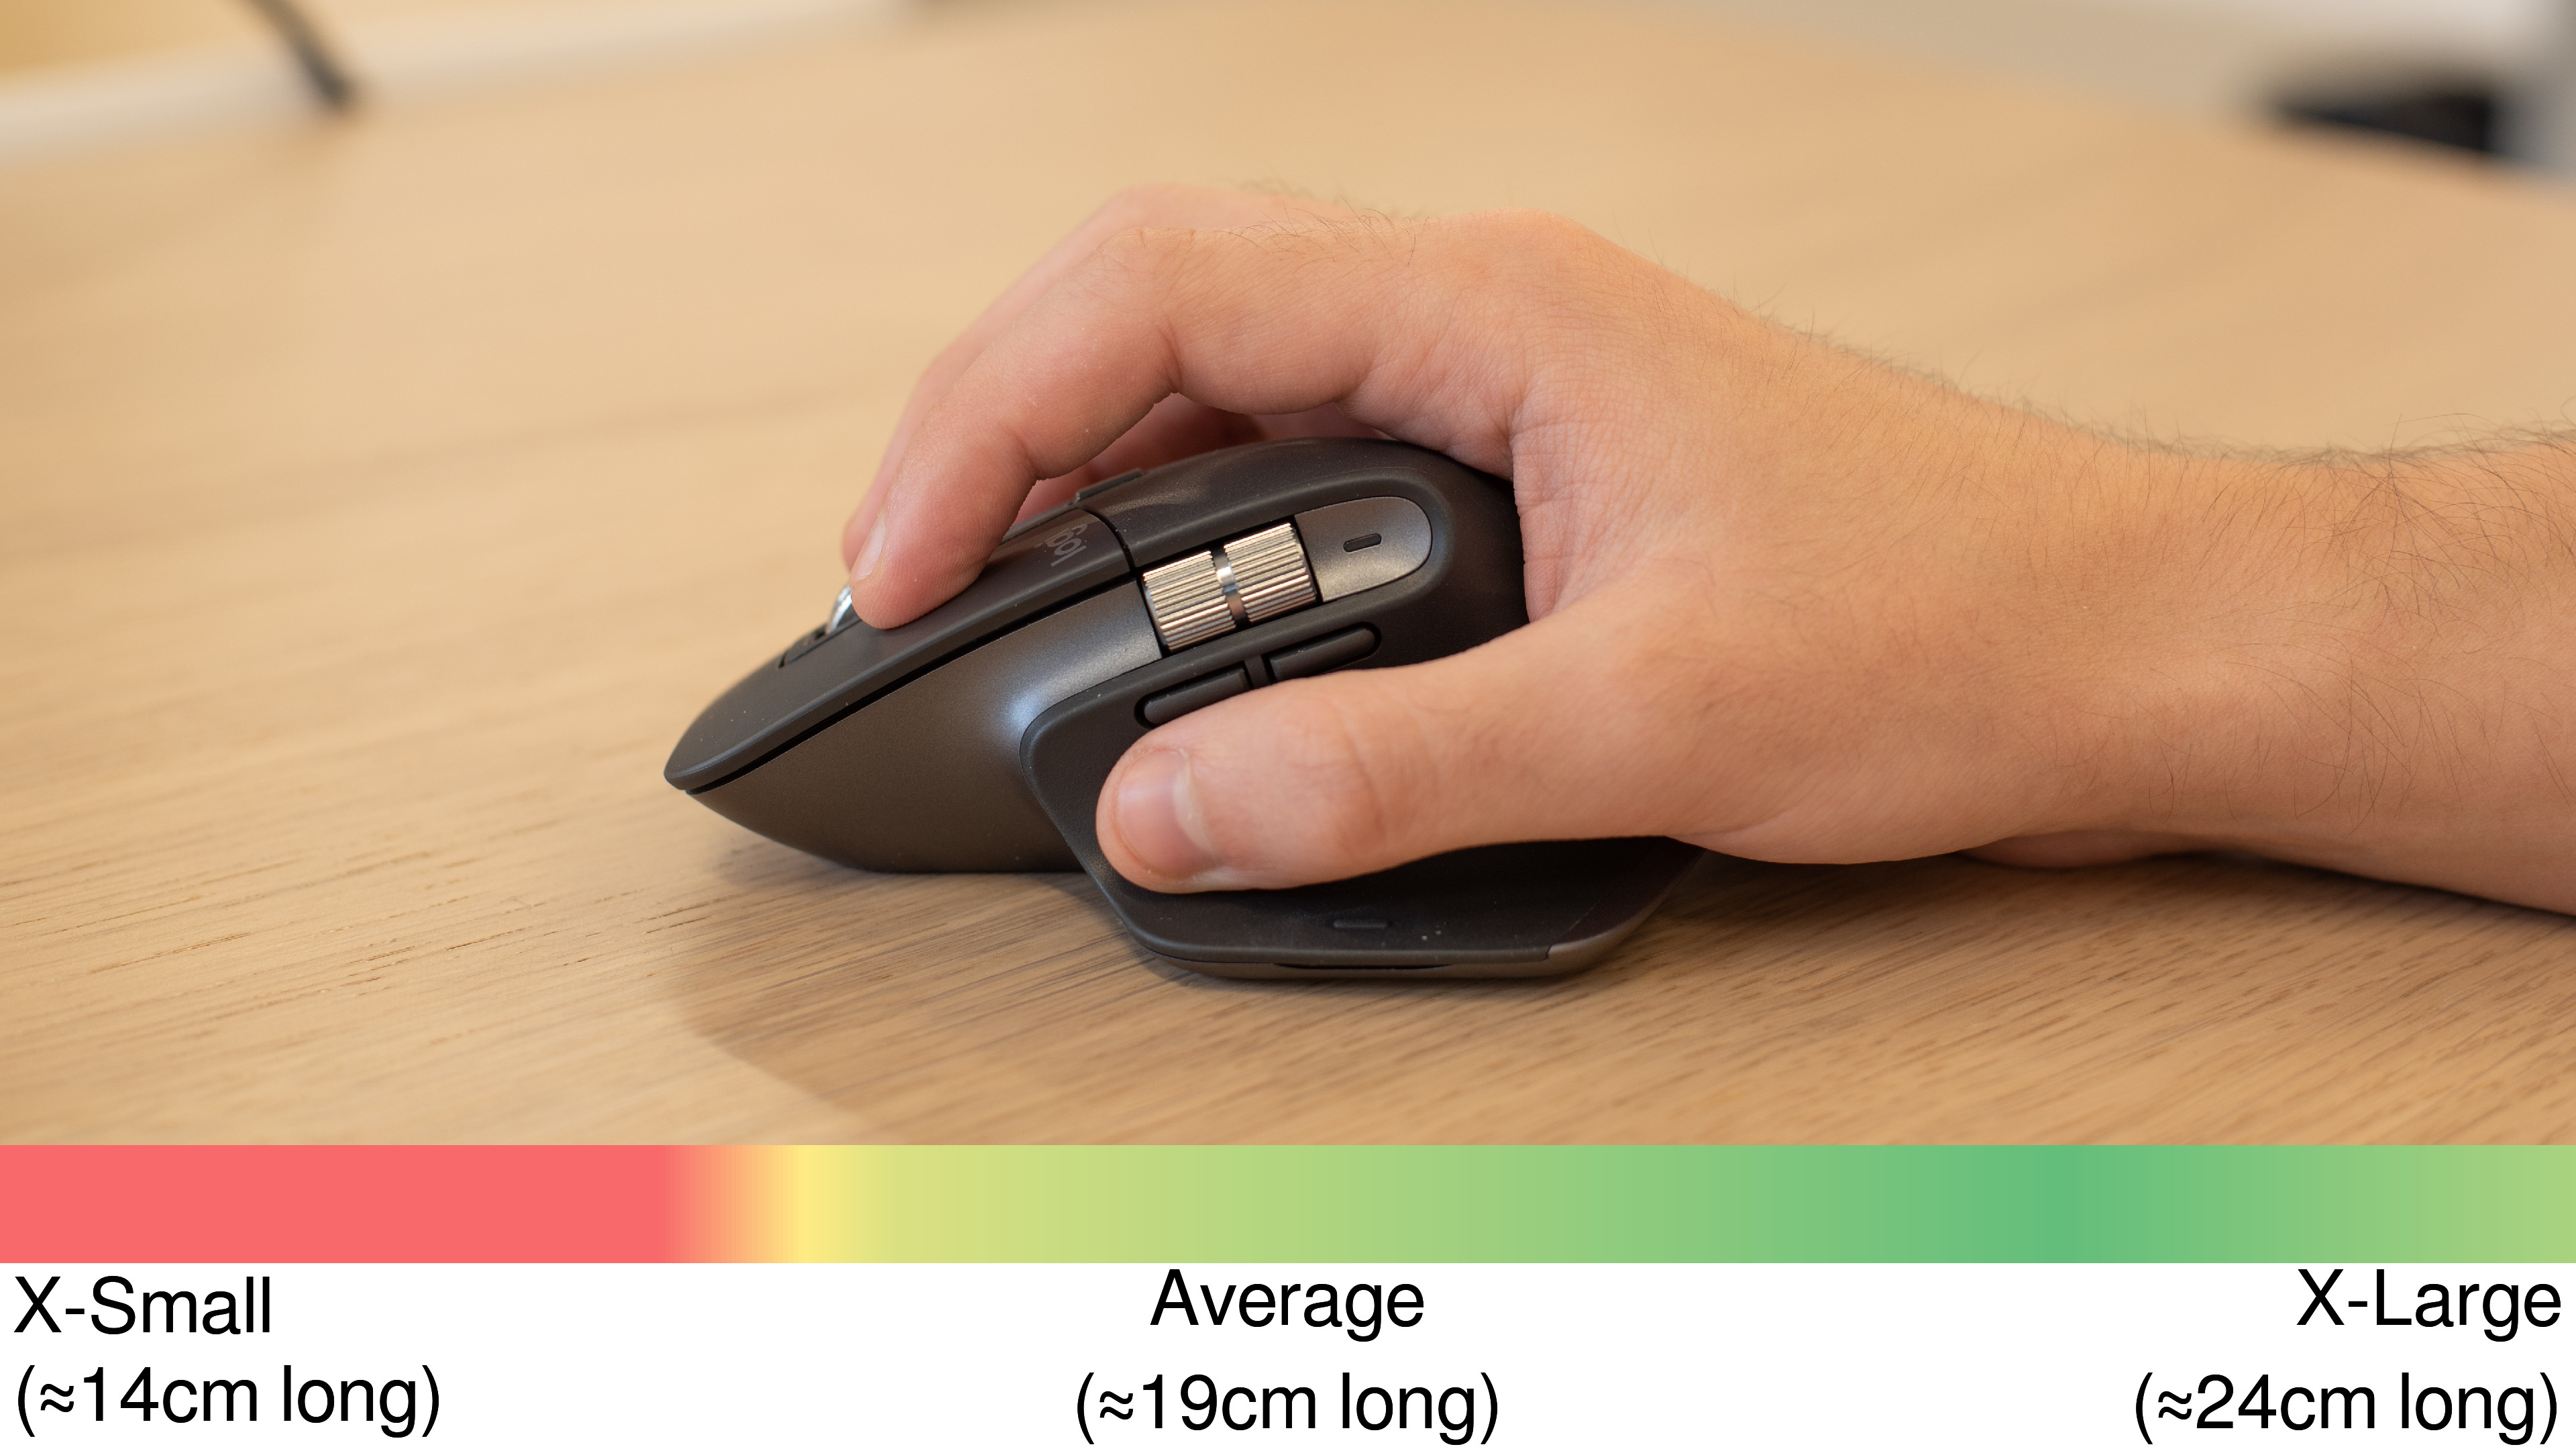 Logitech MX Master 3S claw grip hand size recommendation
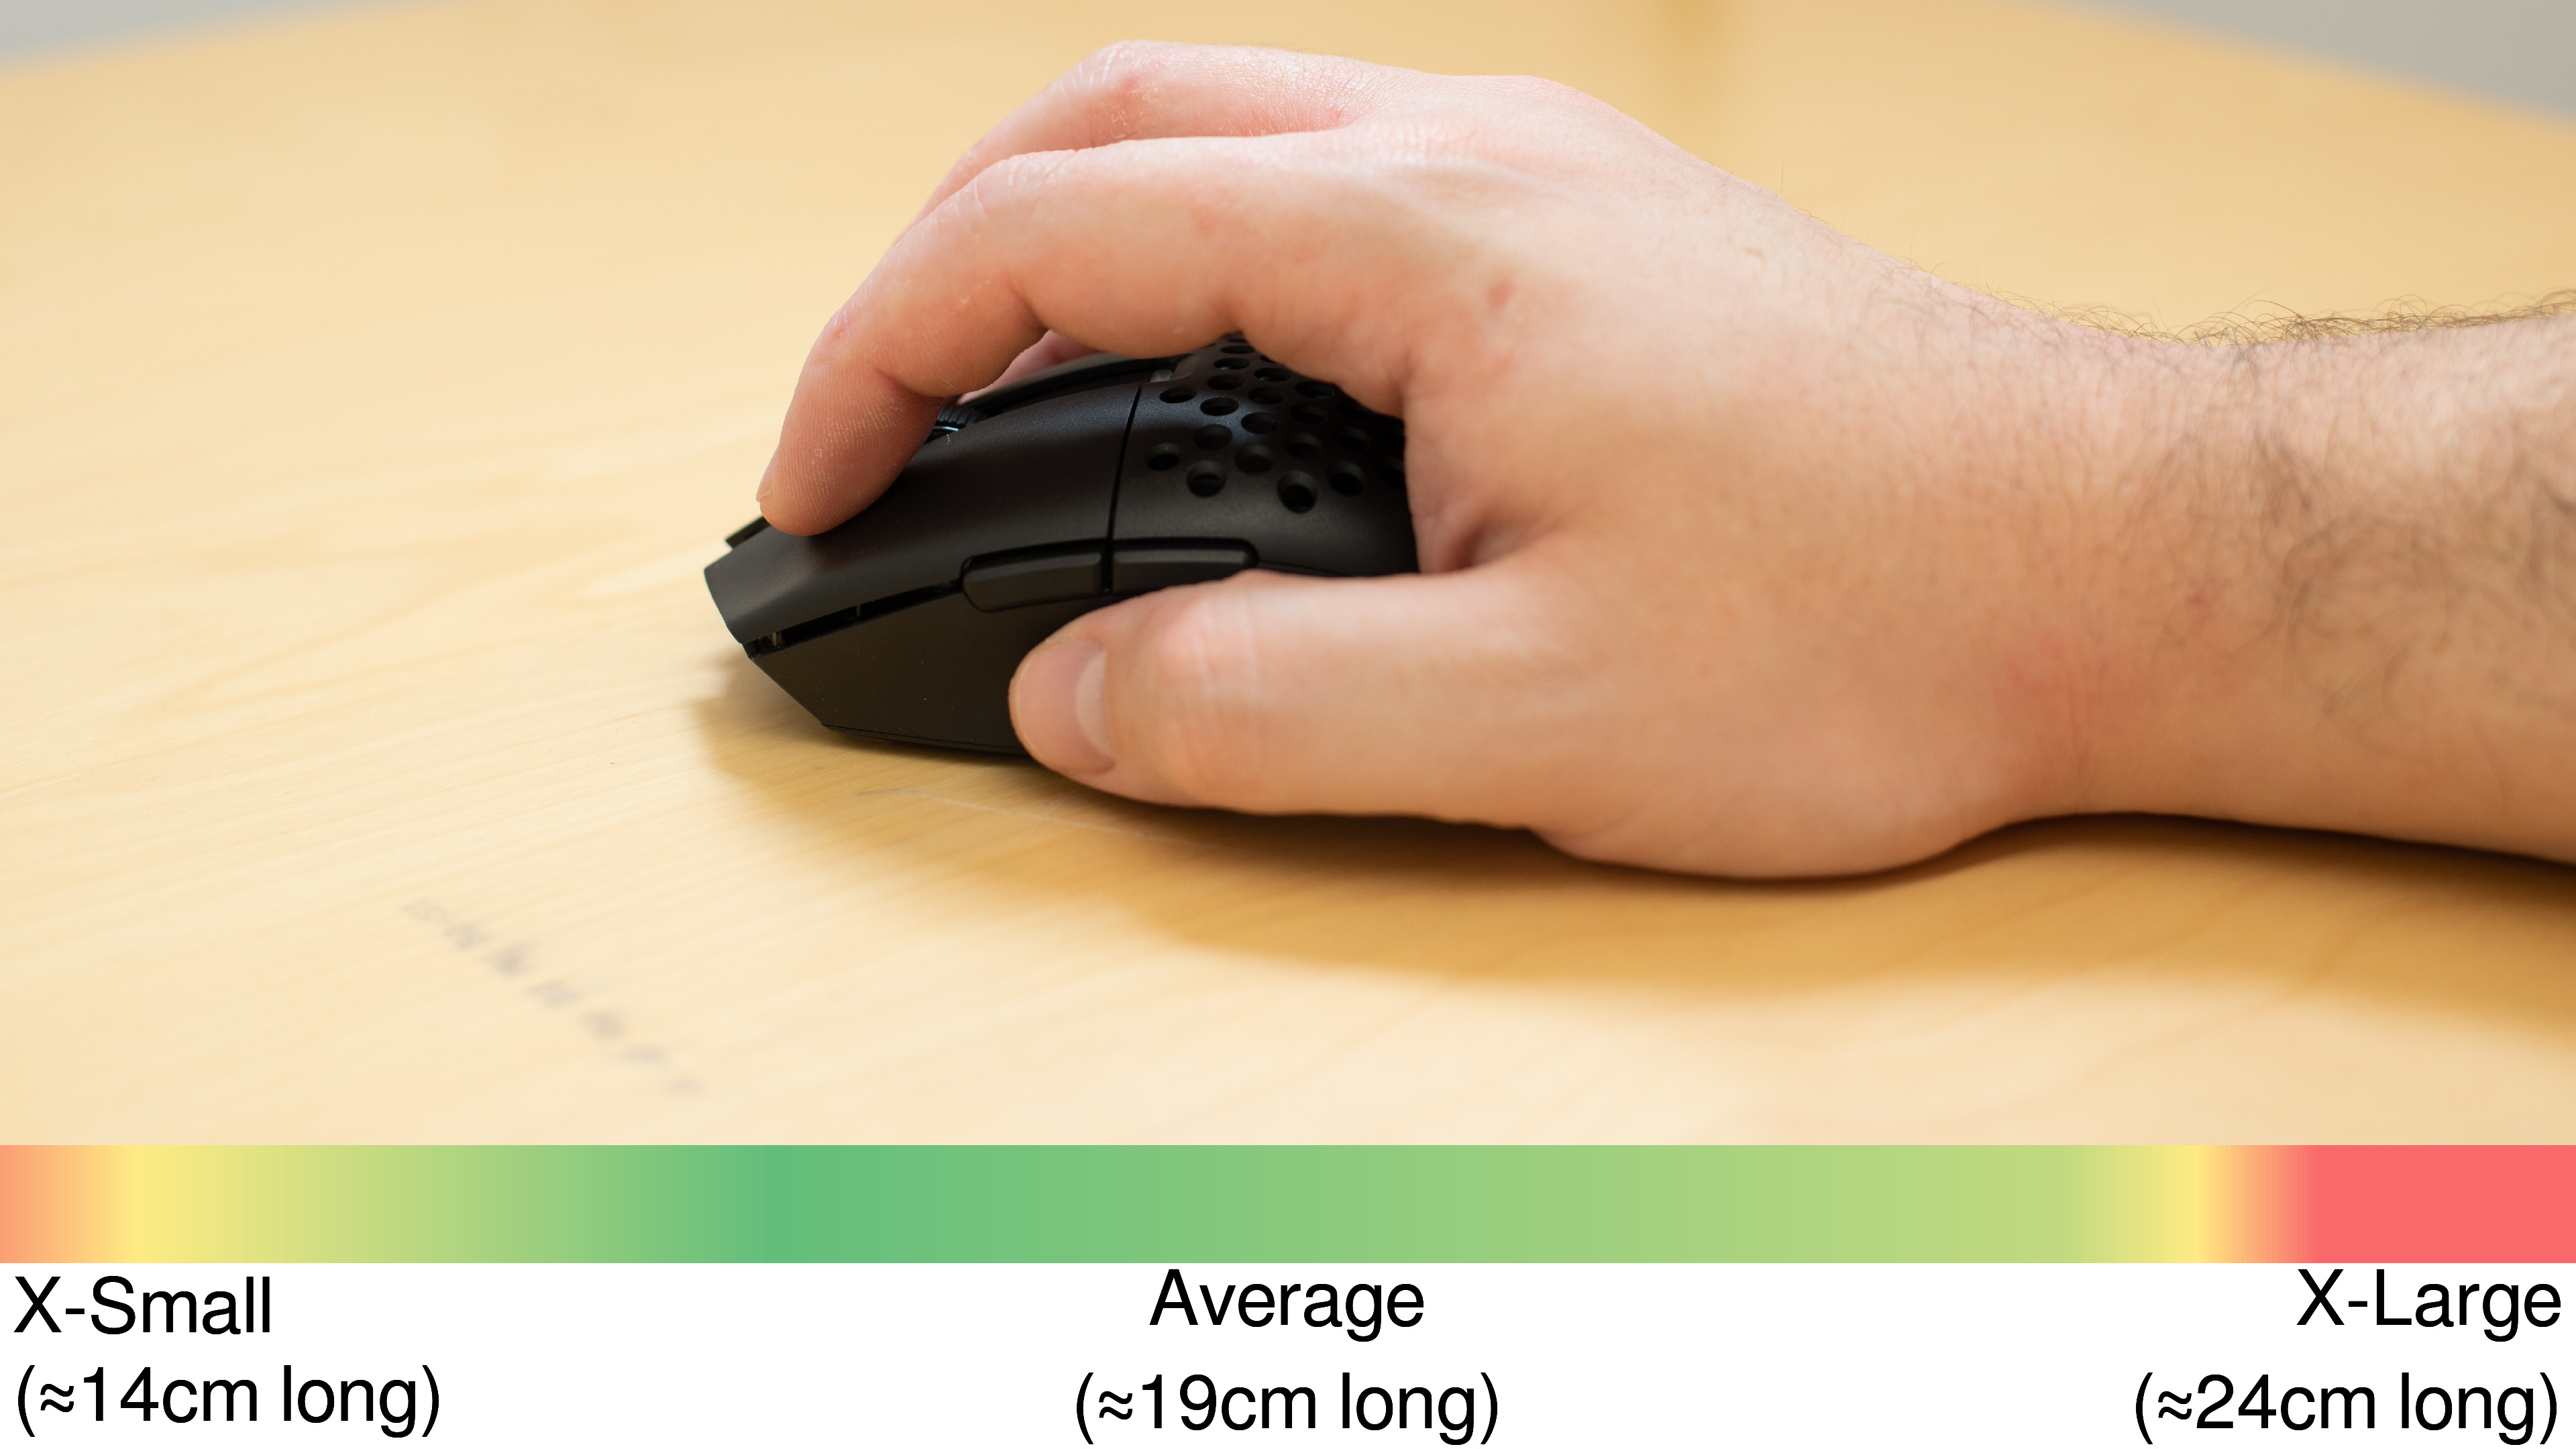 Fantech Aria XD7 claw grip hand size recommendation
Someone with an average hand size using a claw grip may rest their finger naturally about 3 cm from the front of the button on the MX Master 3S, while that same person may rest their finger closer to 1 cm from the front of the XD7. If we compare the results for this person, the Aria XD7 would have lower tactile force than the MX Master 3S.
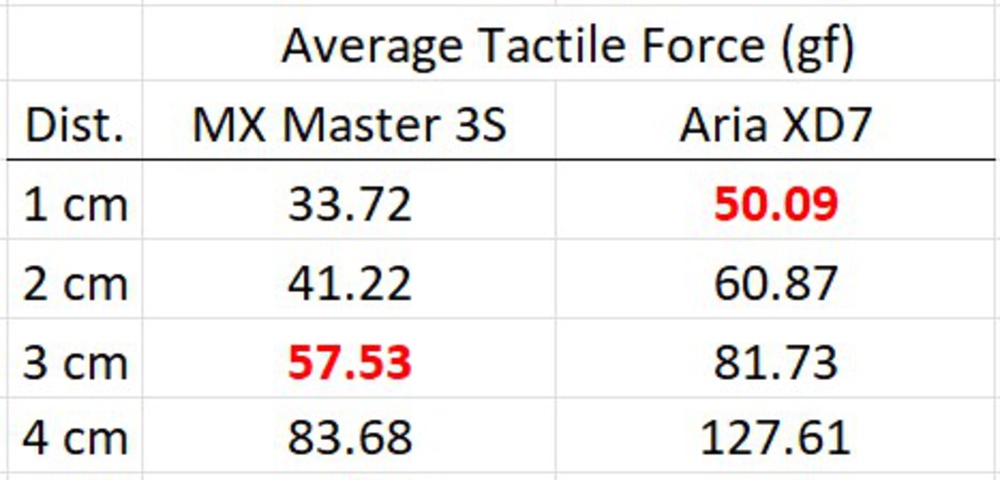 Average tactile force of Logitech MX Master 3S vs. Fantech Aria XD7
For this reason, we can't directly compare the tactile force/distance graphs from mouse to mouse. Despite this, we can provide all the information to help you make the best decision using our hand size recommendation and tactile force/displacement graphs. If you know your hand size/grip style and know what type of main button actuation you want, our tools will be able to help you choose the right mouse for you.
Bounce and Debounce
What's the issue?
As seen in almost any of our actuation graphs, there are visible oscillations just after the tactile and reset points. In this article, we refer to these oscillations as bouncing, which isn't to be confused with debounce. This bouncing isn't something you feel when you press a mouse button, but it does raise the question of where it comes from.
 Vaxee XE actuation graph with bouncing highlighted
Debounce
In theory, mice using optical switches should have no need for traditional debounce. Mice using mechanical switches exhibit electrical bouncing, which means they require debounce to operate properly. This is because mechanical switches are actuated when a metal spring plate hits a contact. The spring plate bounces multiple times in a short period of time, which results in multiple "clicks" being registered. Debounce is therefore required for the mouse to operate properly and remove the extra inputs.
Since optical switches actuate using a gate to block a beam of infrared light instead of the contact from the metal spring plate, there is no bouncing in the electrical signal, and therefore no need for debounce (generally). There are some indications that debounce can be used in optical mice to avoid slam-clicks, but this isn't covered in this article.
![Comparison between traditional mechanical switches and Razer optical switches [2]](/assets/pages/hi4H3kUu/razer-optical-vs-mechanical-diagram-large.jpg)
Oscilloscope testing - what did we test and why?
We selected the Razer Viper 8KHz, which uses optical switches, and the Zowie FK1-B, which uses mechanical switches, and connected both to an oscilloscope to see if we could observe the bouncing that we see in the actuation graphs. The goal was to see if the electrical bouncing (or lack thereof) is connected to the physical bouncing in our actuation graphs. We tested the actuation of the mice at various probe speeds ranging from 5 mm/min up to 100 mm/min. We also looked at the oscilloscope reading for when the mouse was pressed by a human at a normal speed (much faster than the force testing machine).
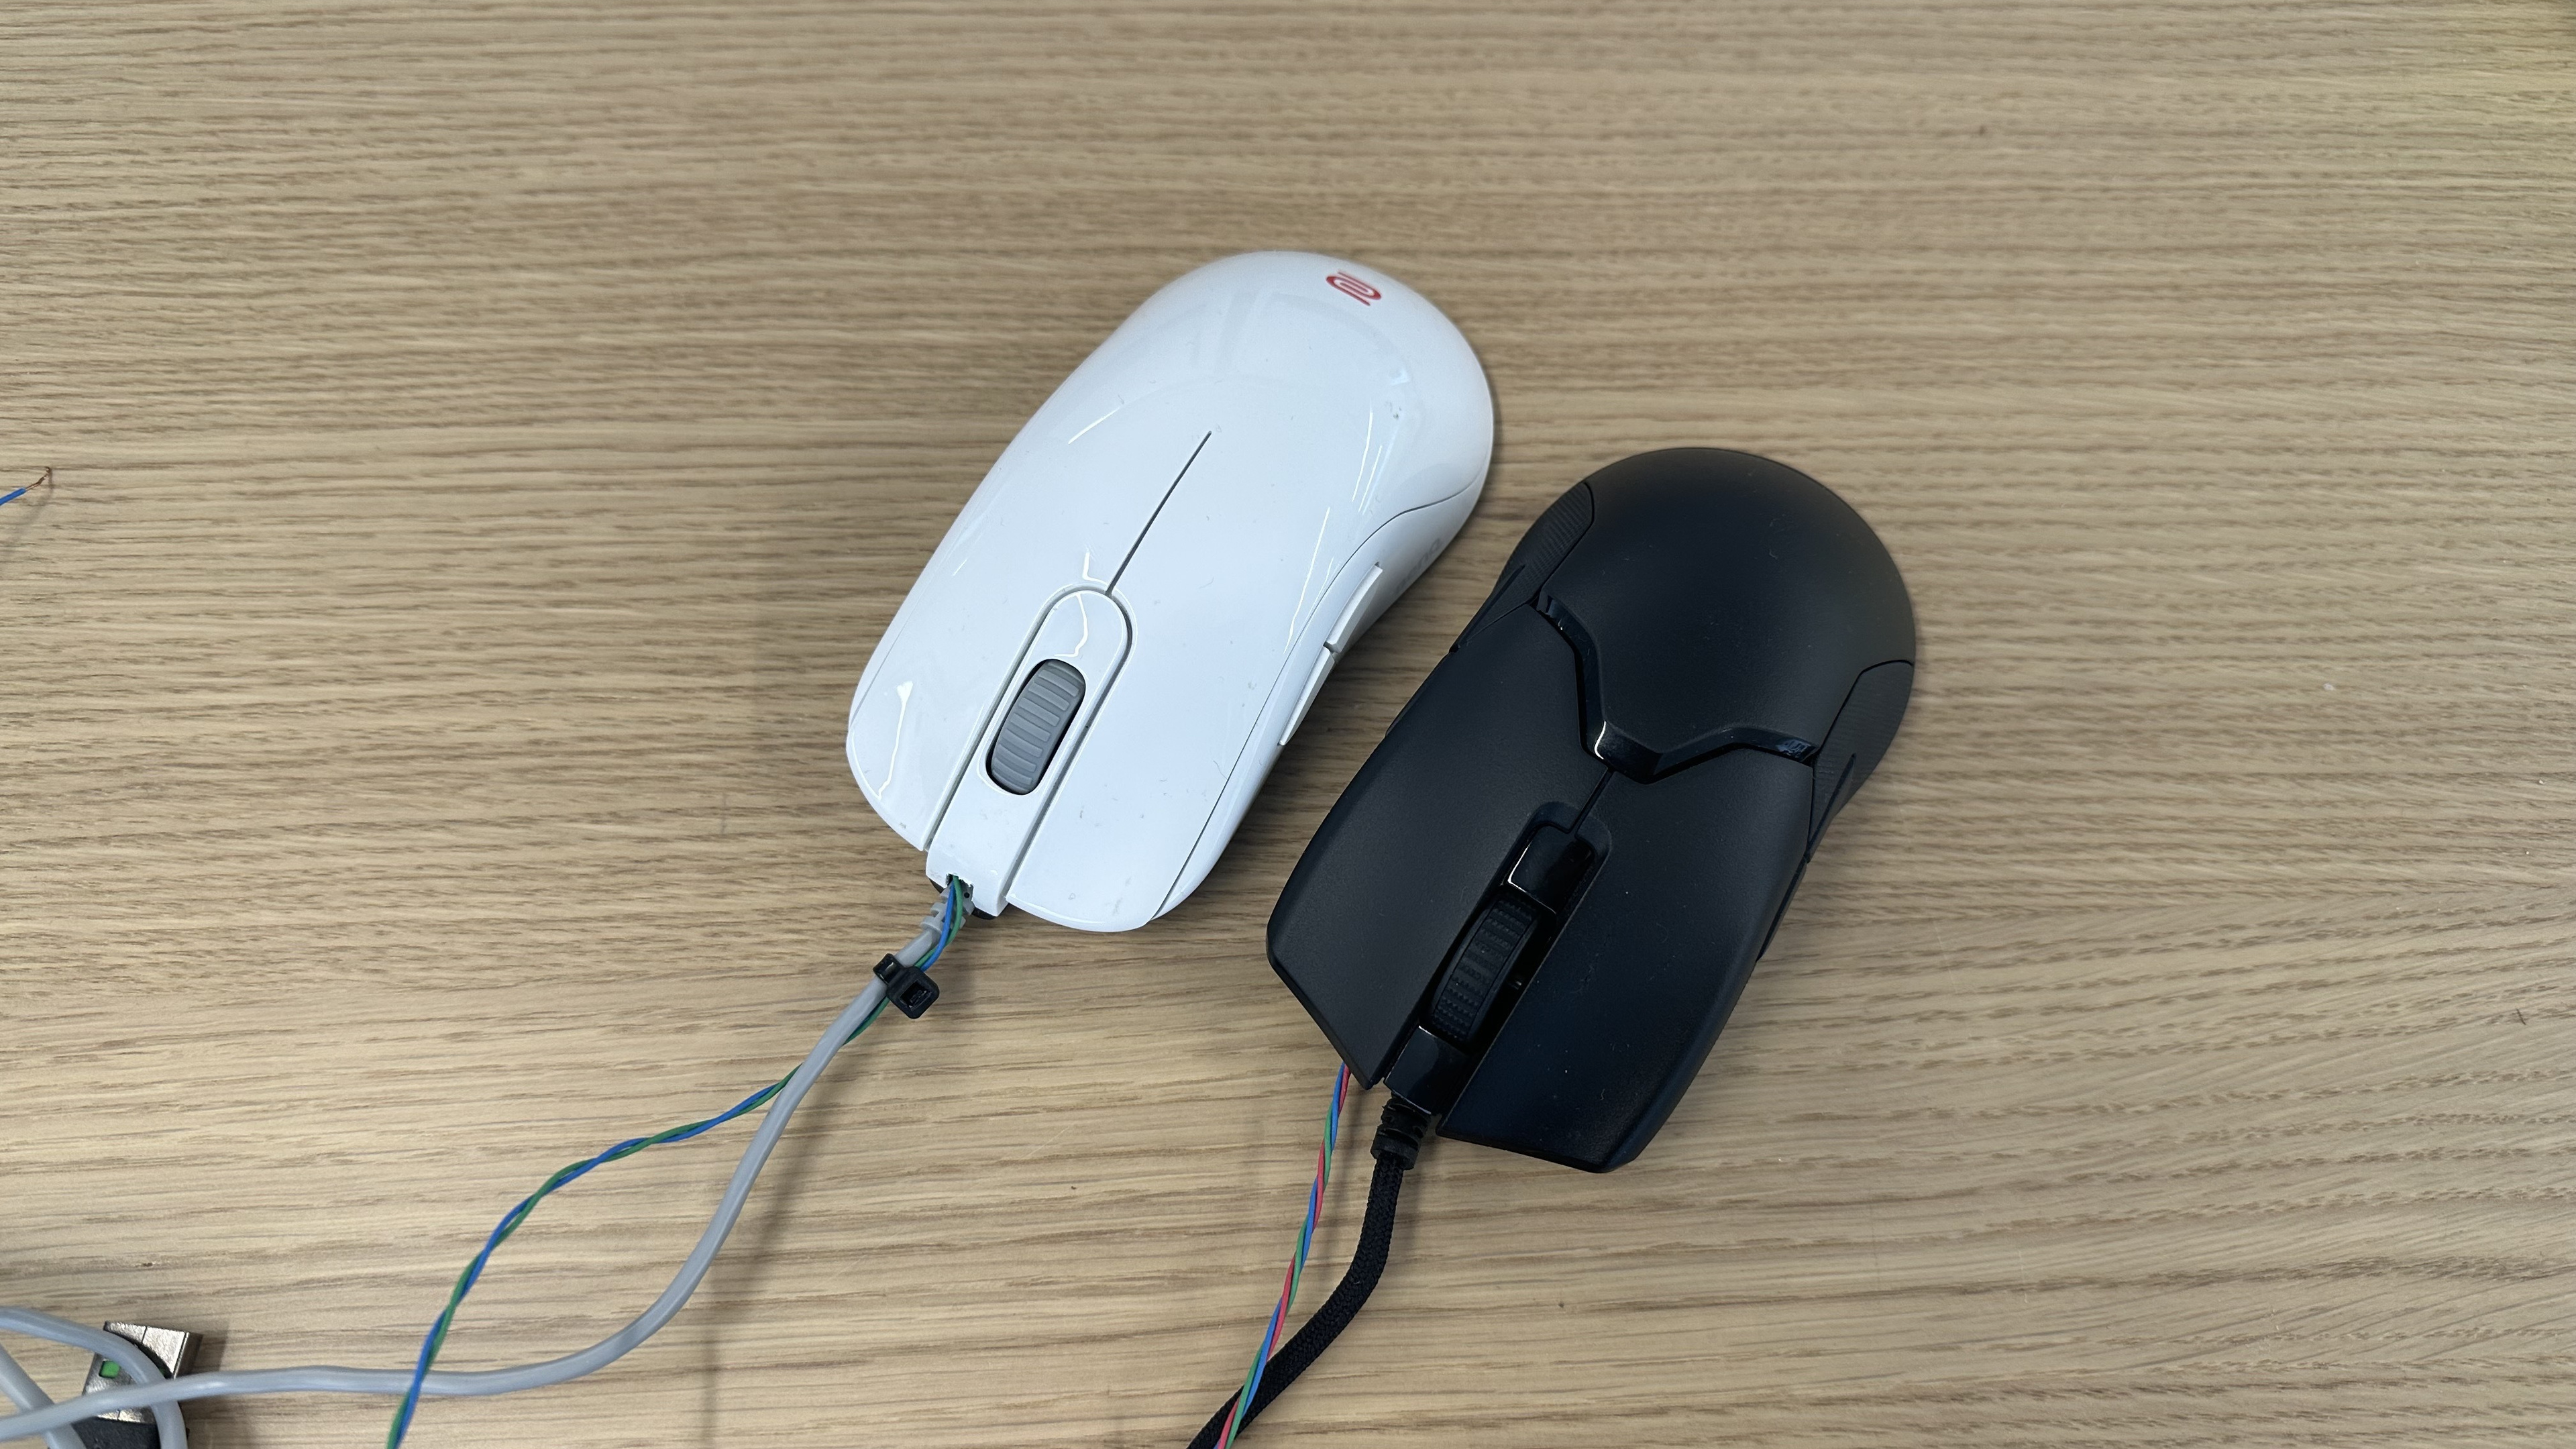 BenQ Zowie FK1-B and Razer Viper 8KHz wired for oscilloscope testing.
Optical mouse oscilloscope results
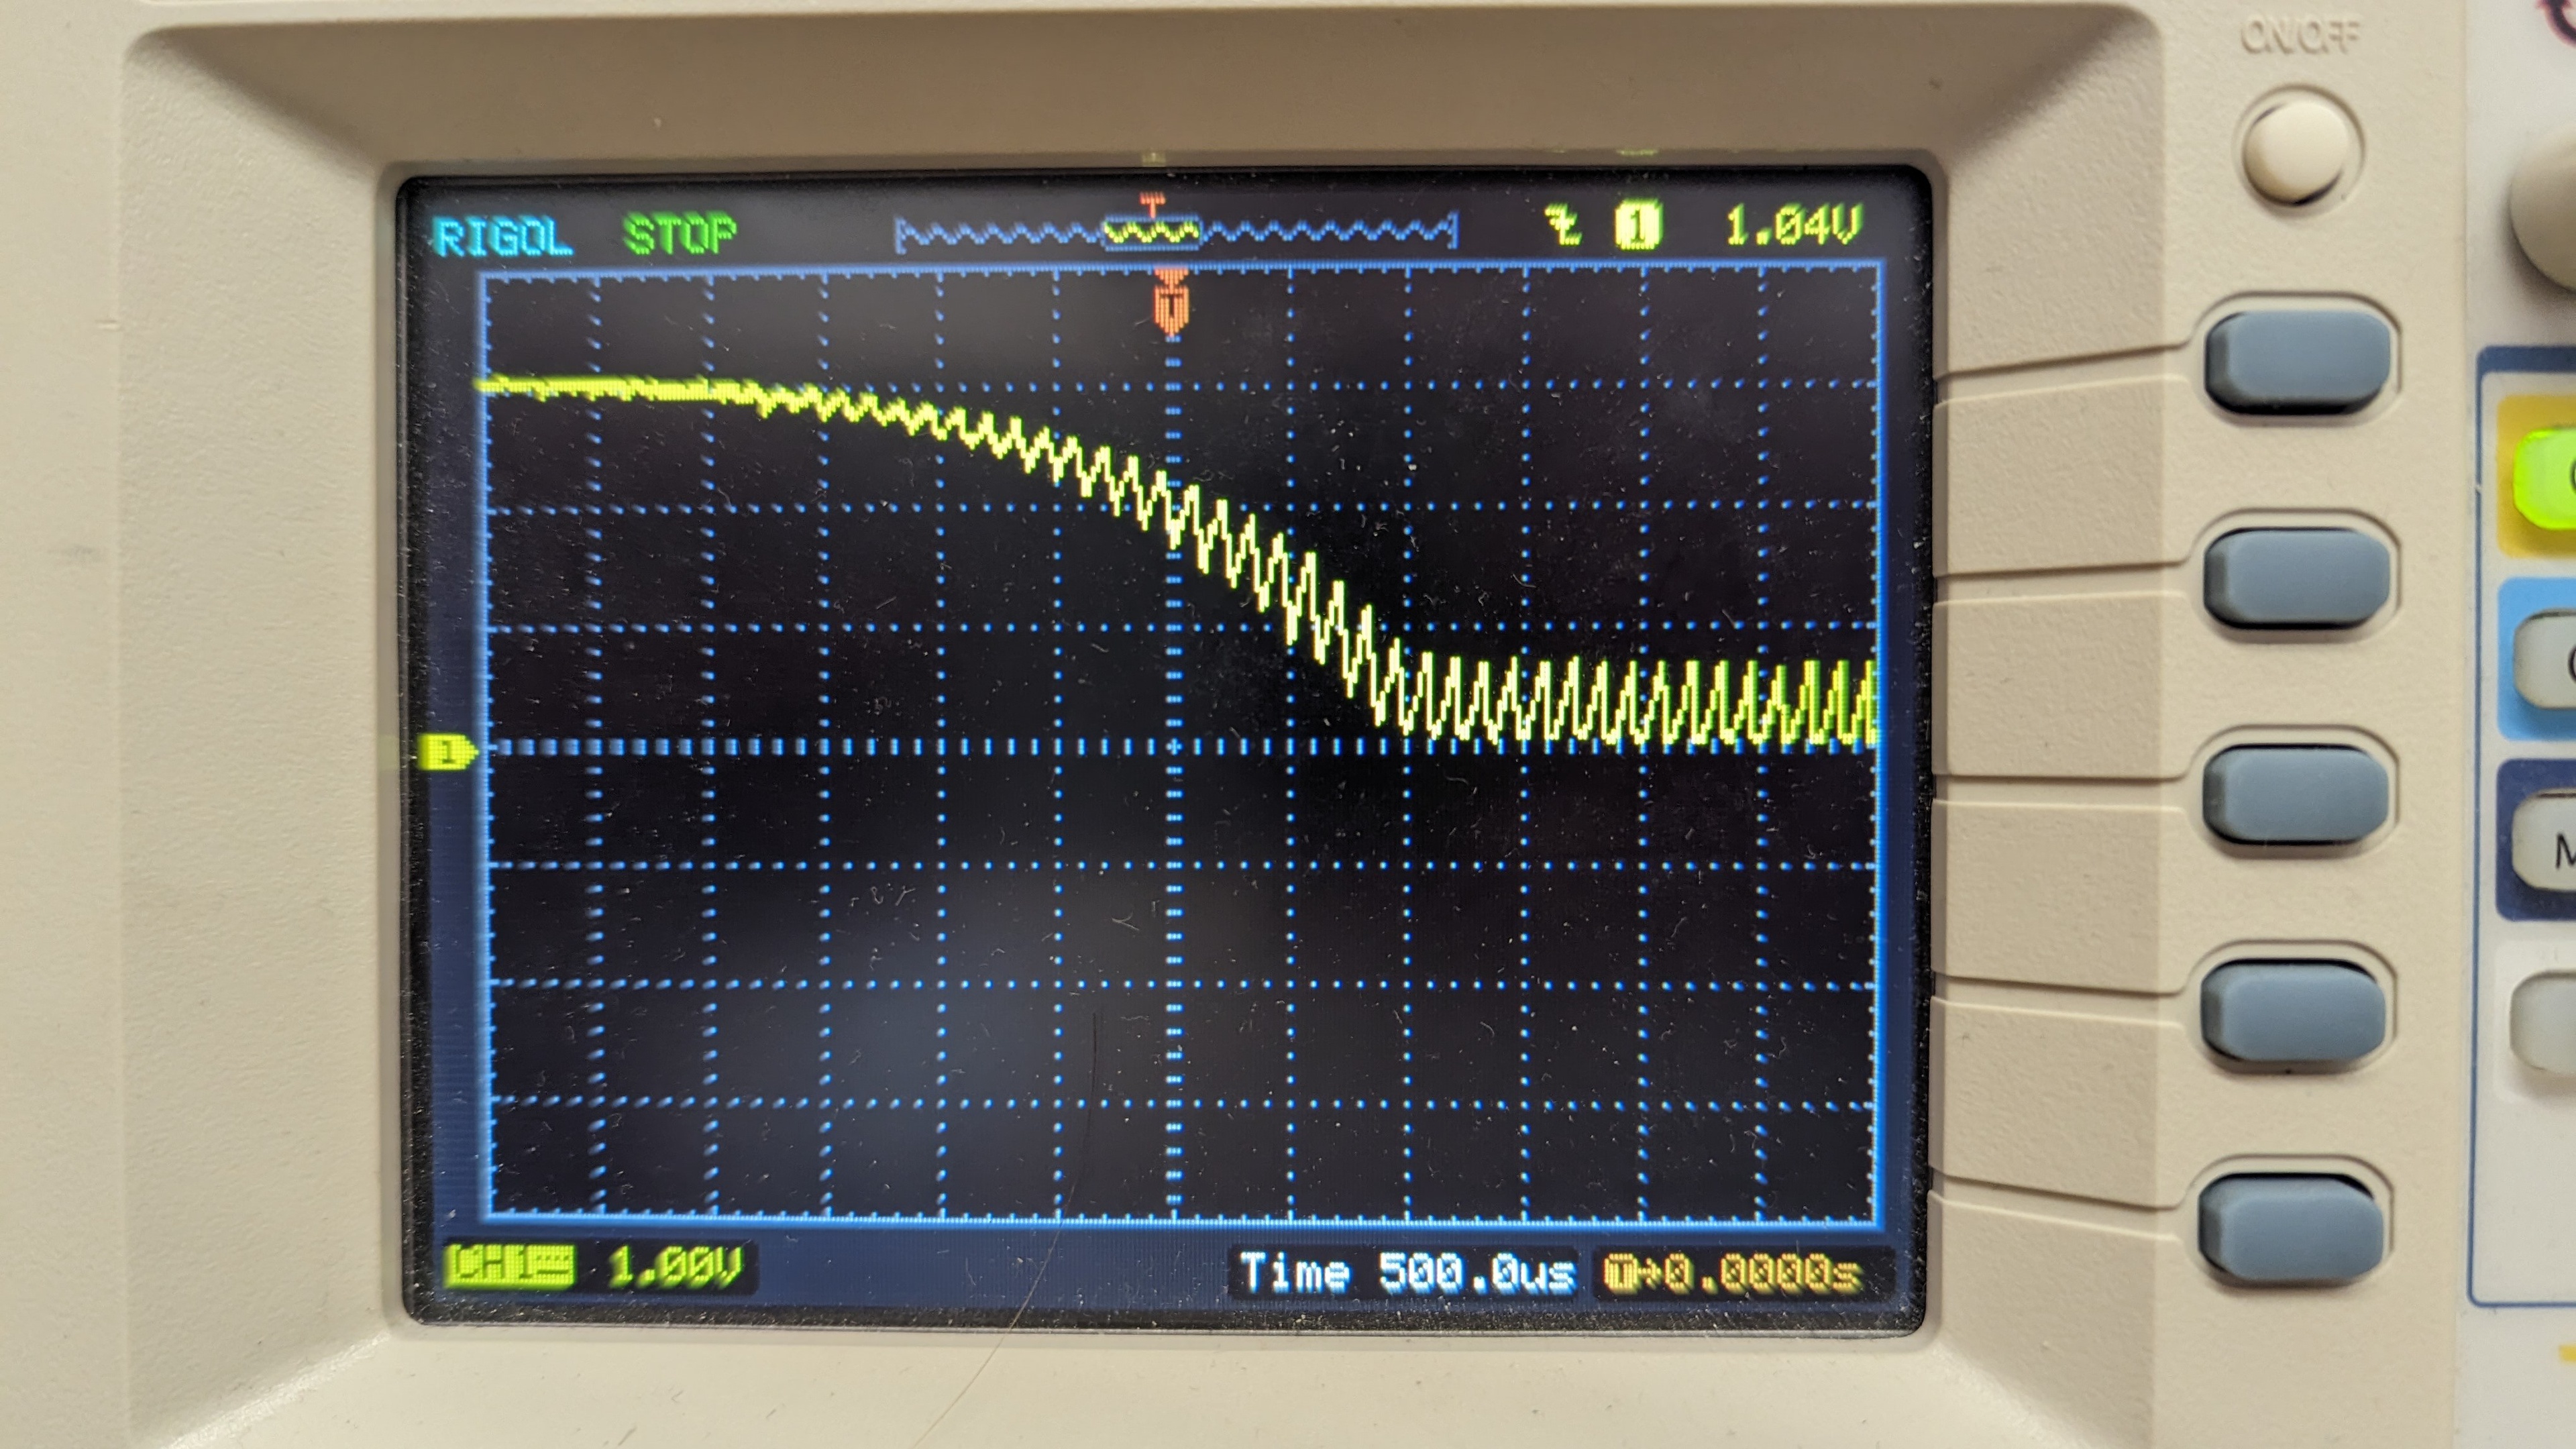
As expected, the oscilloscope readings from the optical switches on the Razer Viper 8KHz did not show electrical bouncing. As speed decreased, they did show a flatter curve. This is likely because the gate that blocks the infrared light is blocking/exposing the photodiode at a slower rate. The following two pictures are oscilloscope readings of the Razer Viper 8KHz mouse.
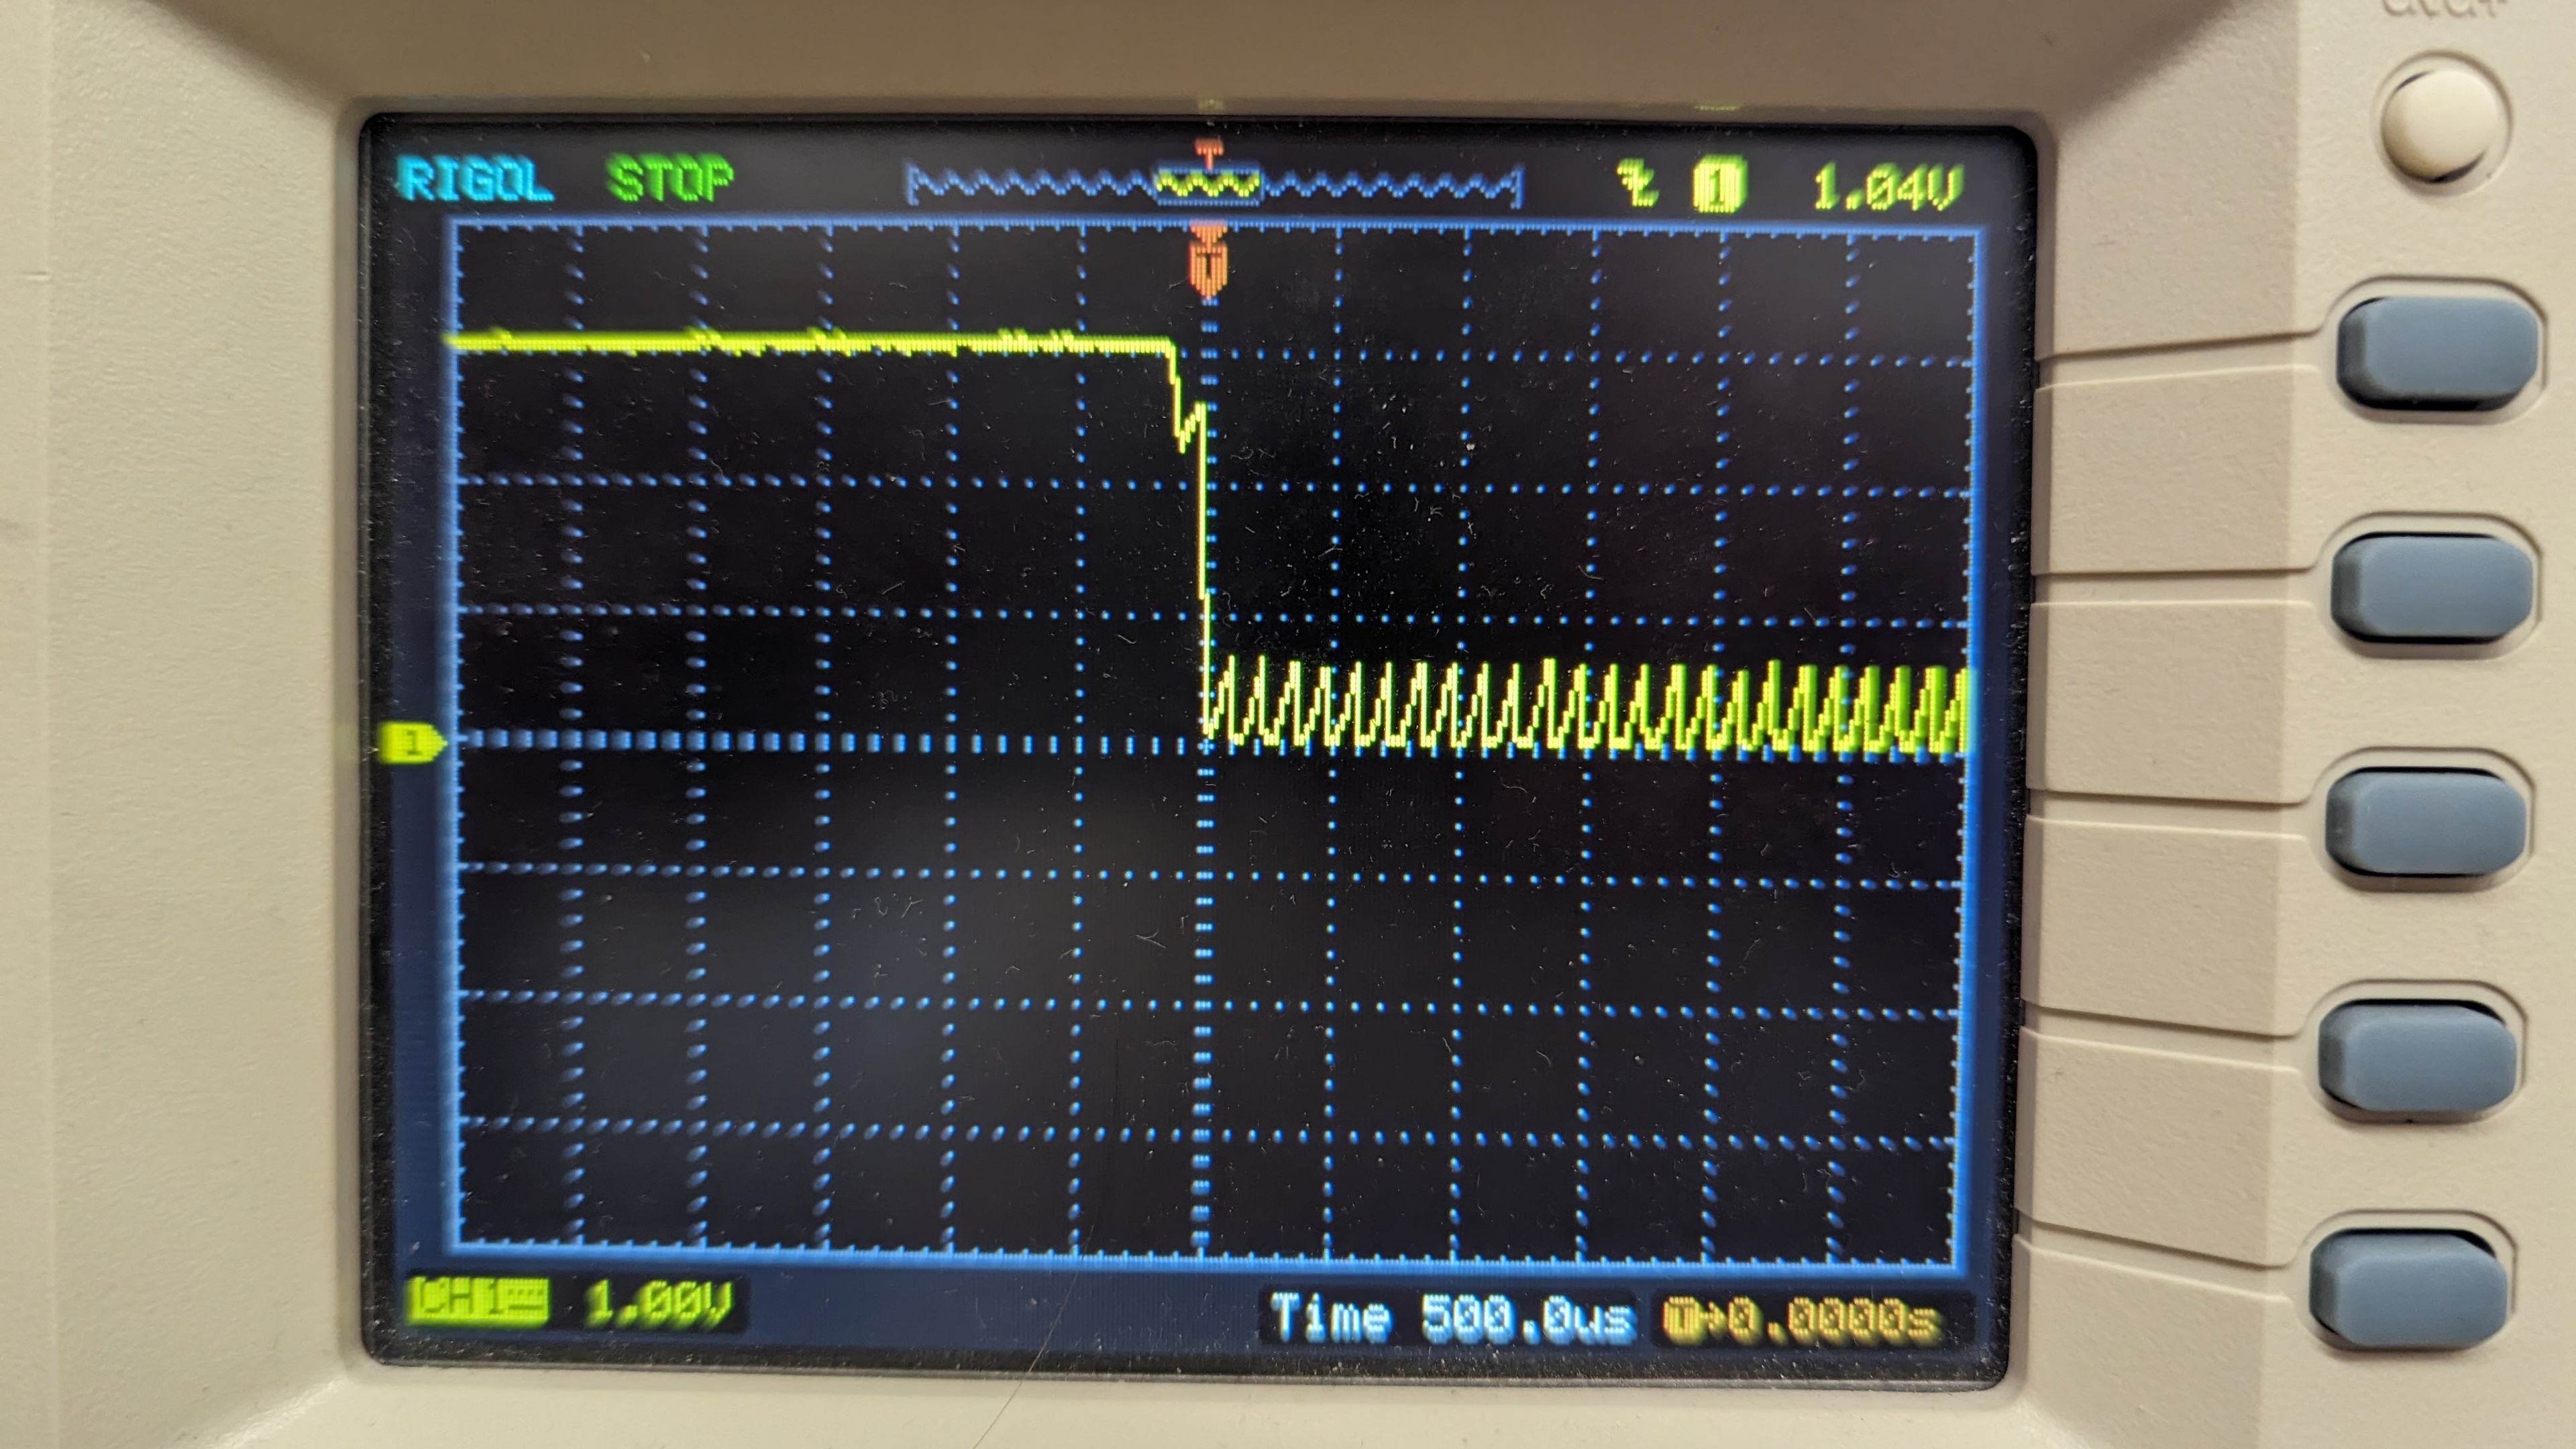
 Razer Viper 8KHz oscilloscope reading when pressed at 30 mm/min (relatively slow)
We don't see any bouncing in the electrical signal in either situation that would require debounce. The oscillations we see are constant and relatively low amplitude (~0.7 V). They also stay constant when holding the mouse button down for a long period. If this were due to electrical bounce, we would expect that these oscillations would be higher amplitude and stop shortly after actuation. It's likely that the oscillations we see are electrical noise.
Mechanical mouse oscilloscope results
For the BenQ Zowie FK-B, which uses mechanical switches, the oscilloscope readings were very similar to each other (regardless of how fast the button is pressed). The results can be seen below, where the oscilloscope reading when pressed by a human (relatively fast) is almost the same as when pressed by the machine at 30 mm/min (relatively slow).
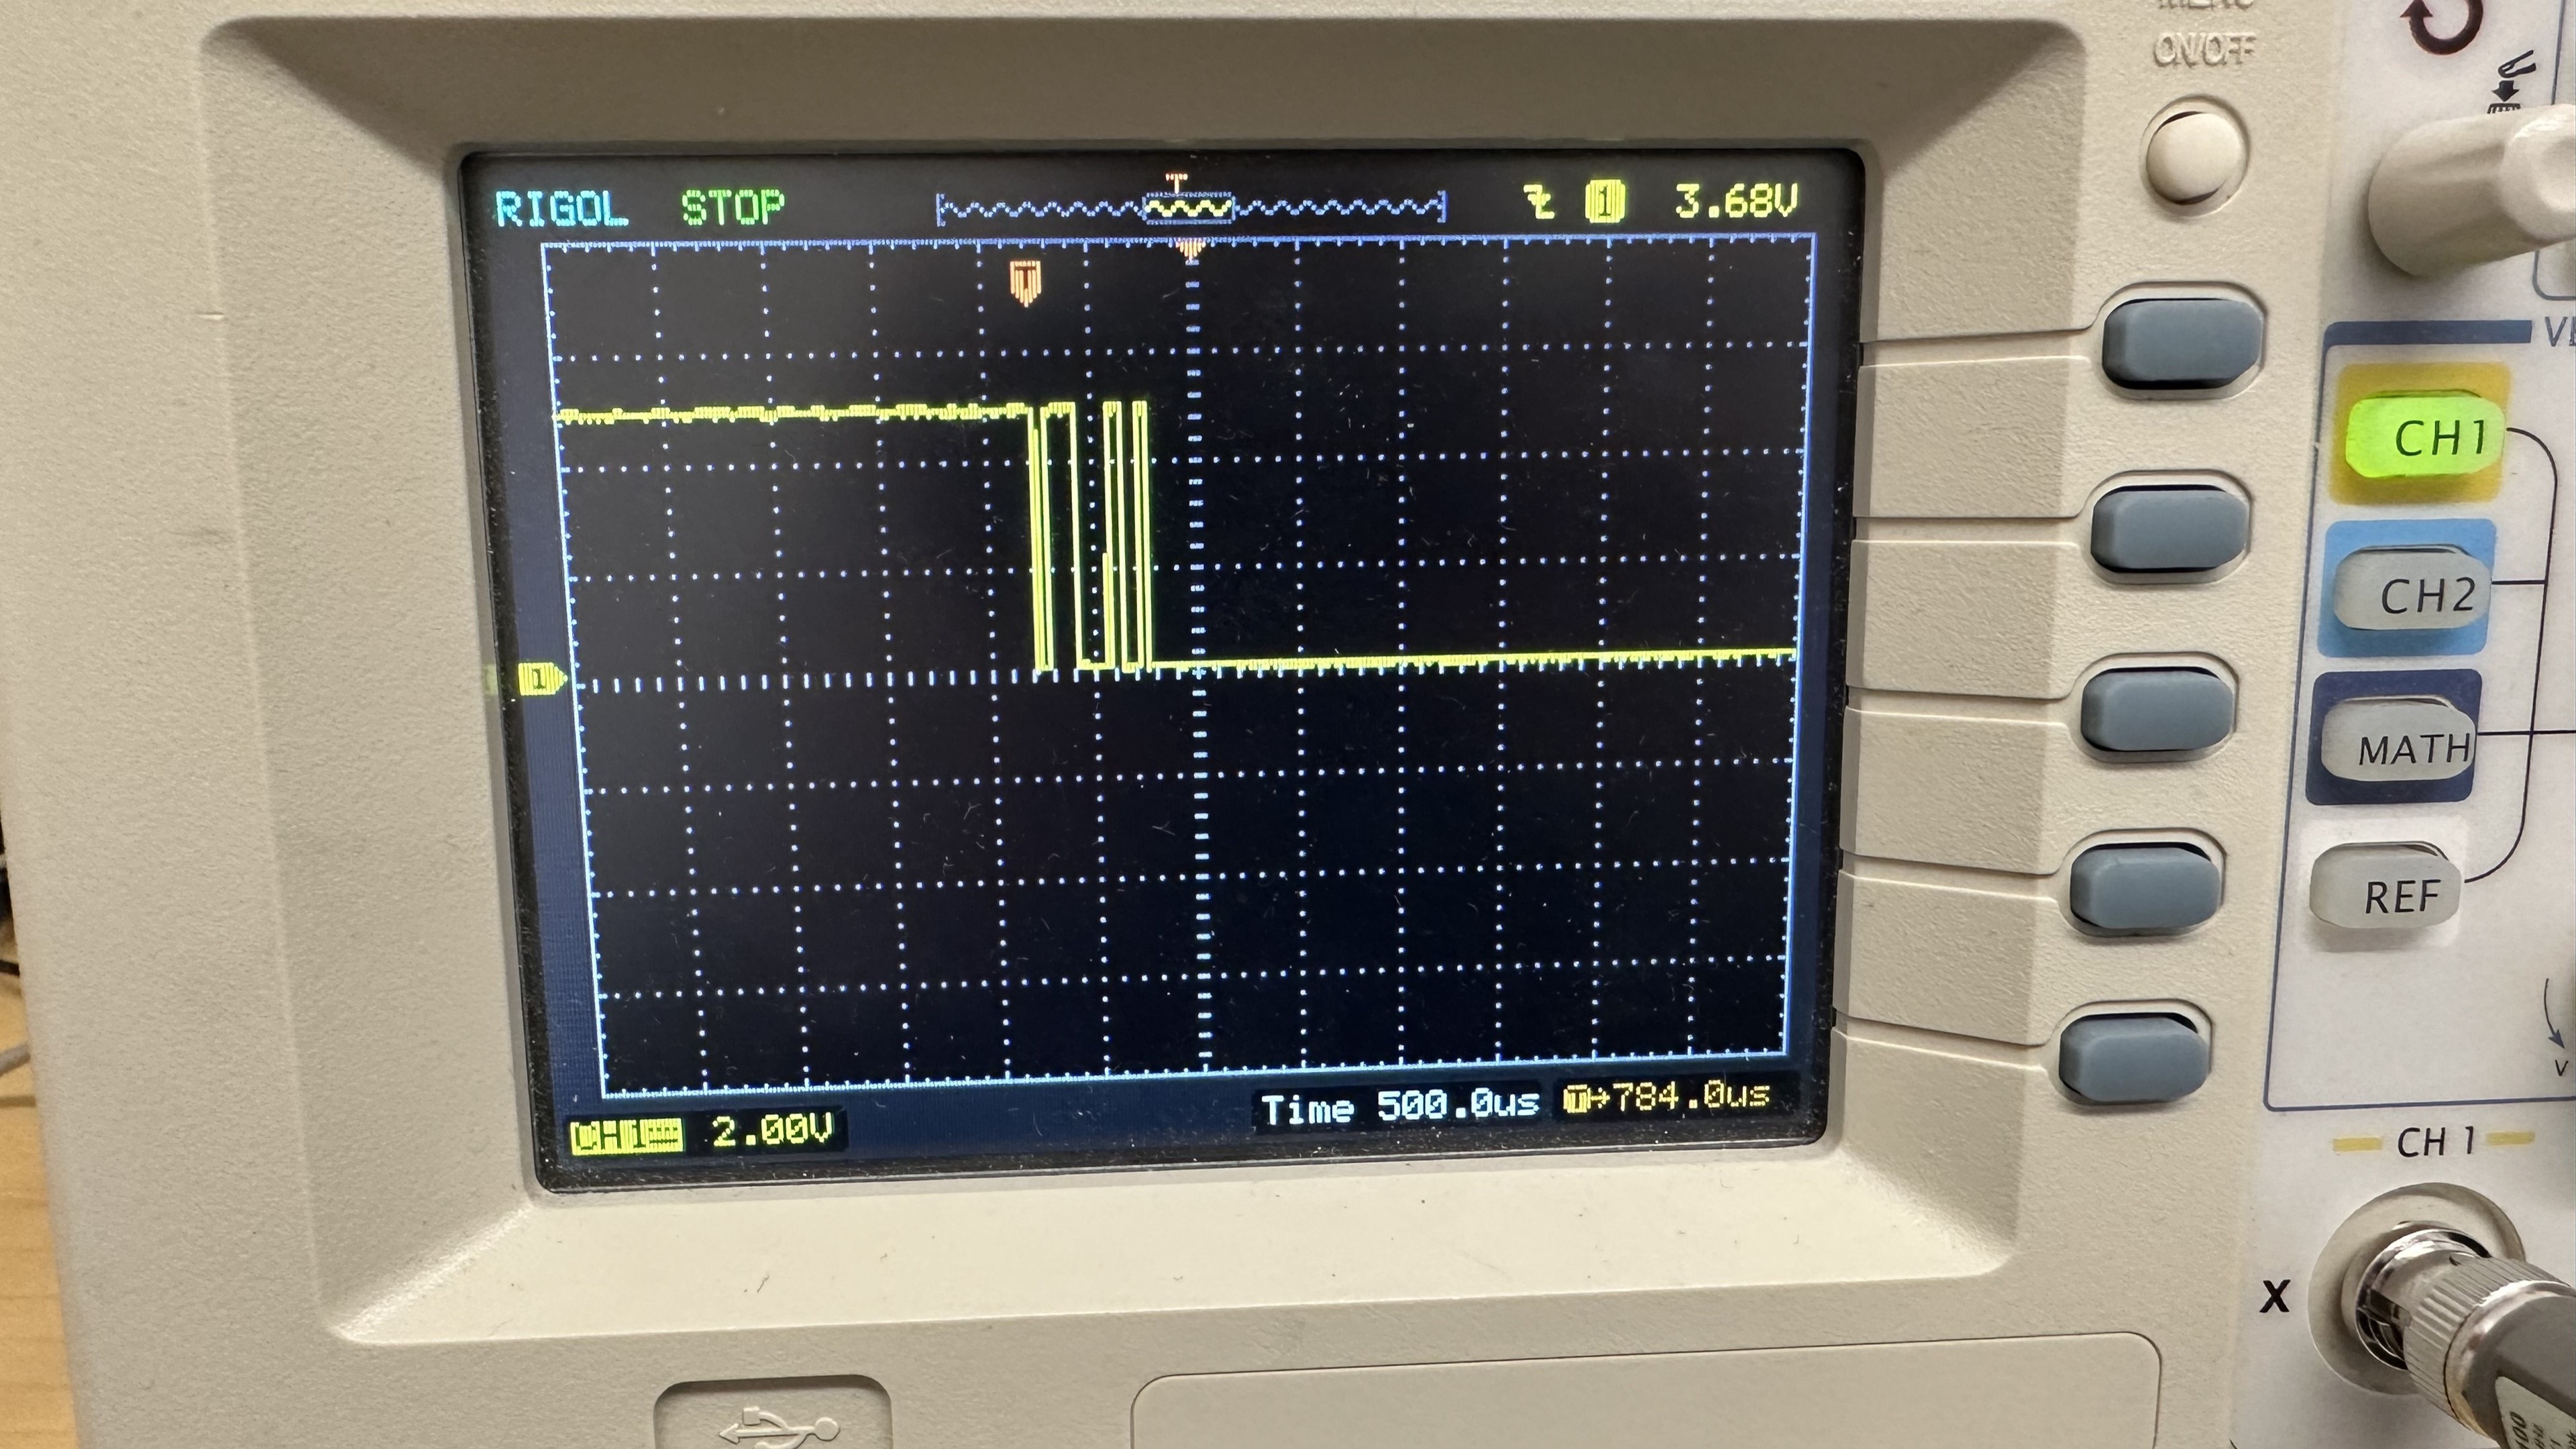 BenQ Zowie FK1-B oscilloscope human press (relatively fast)
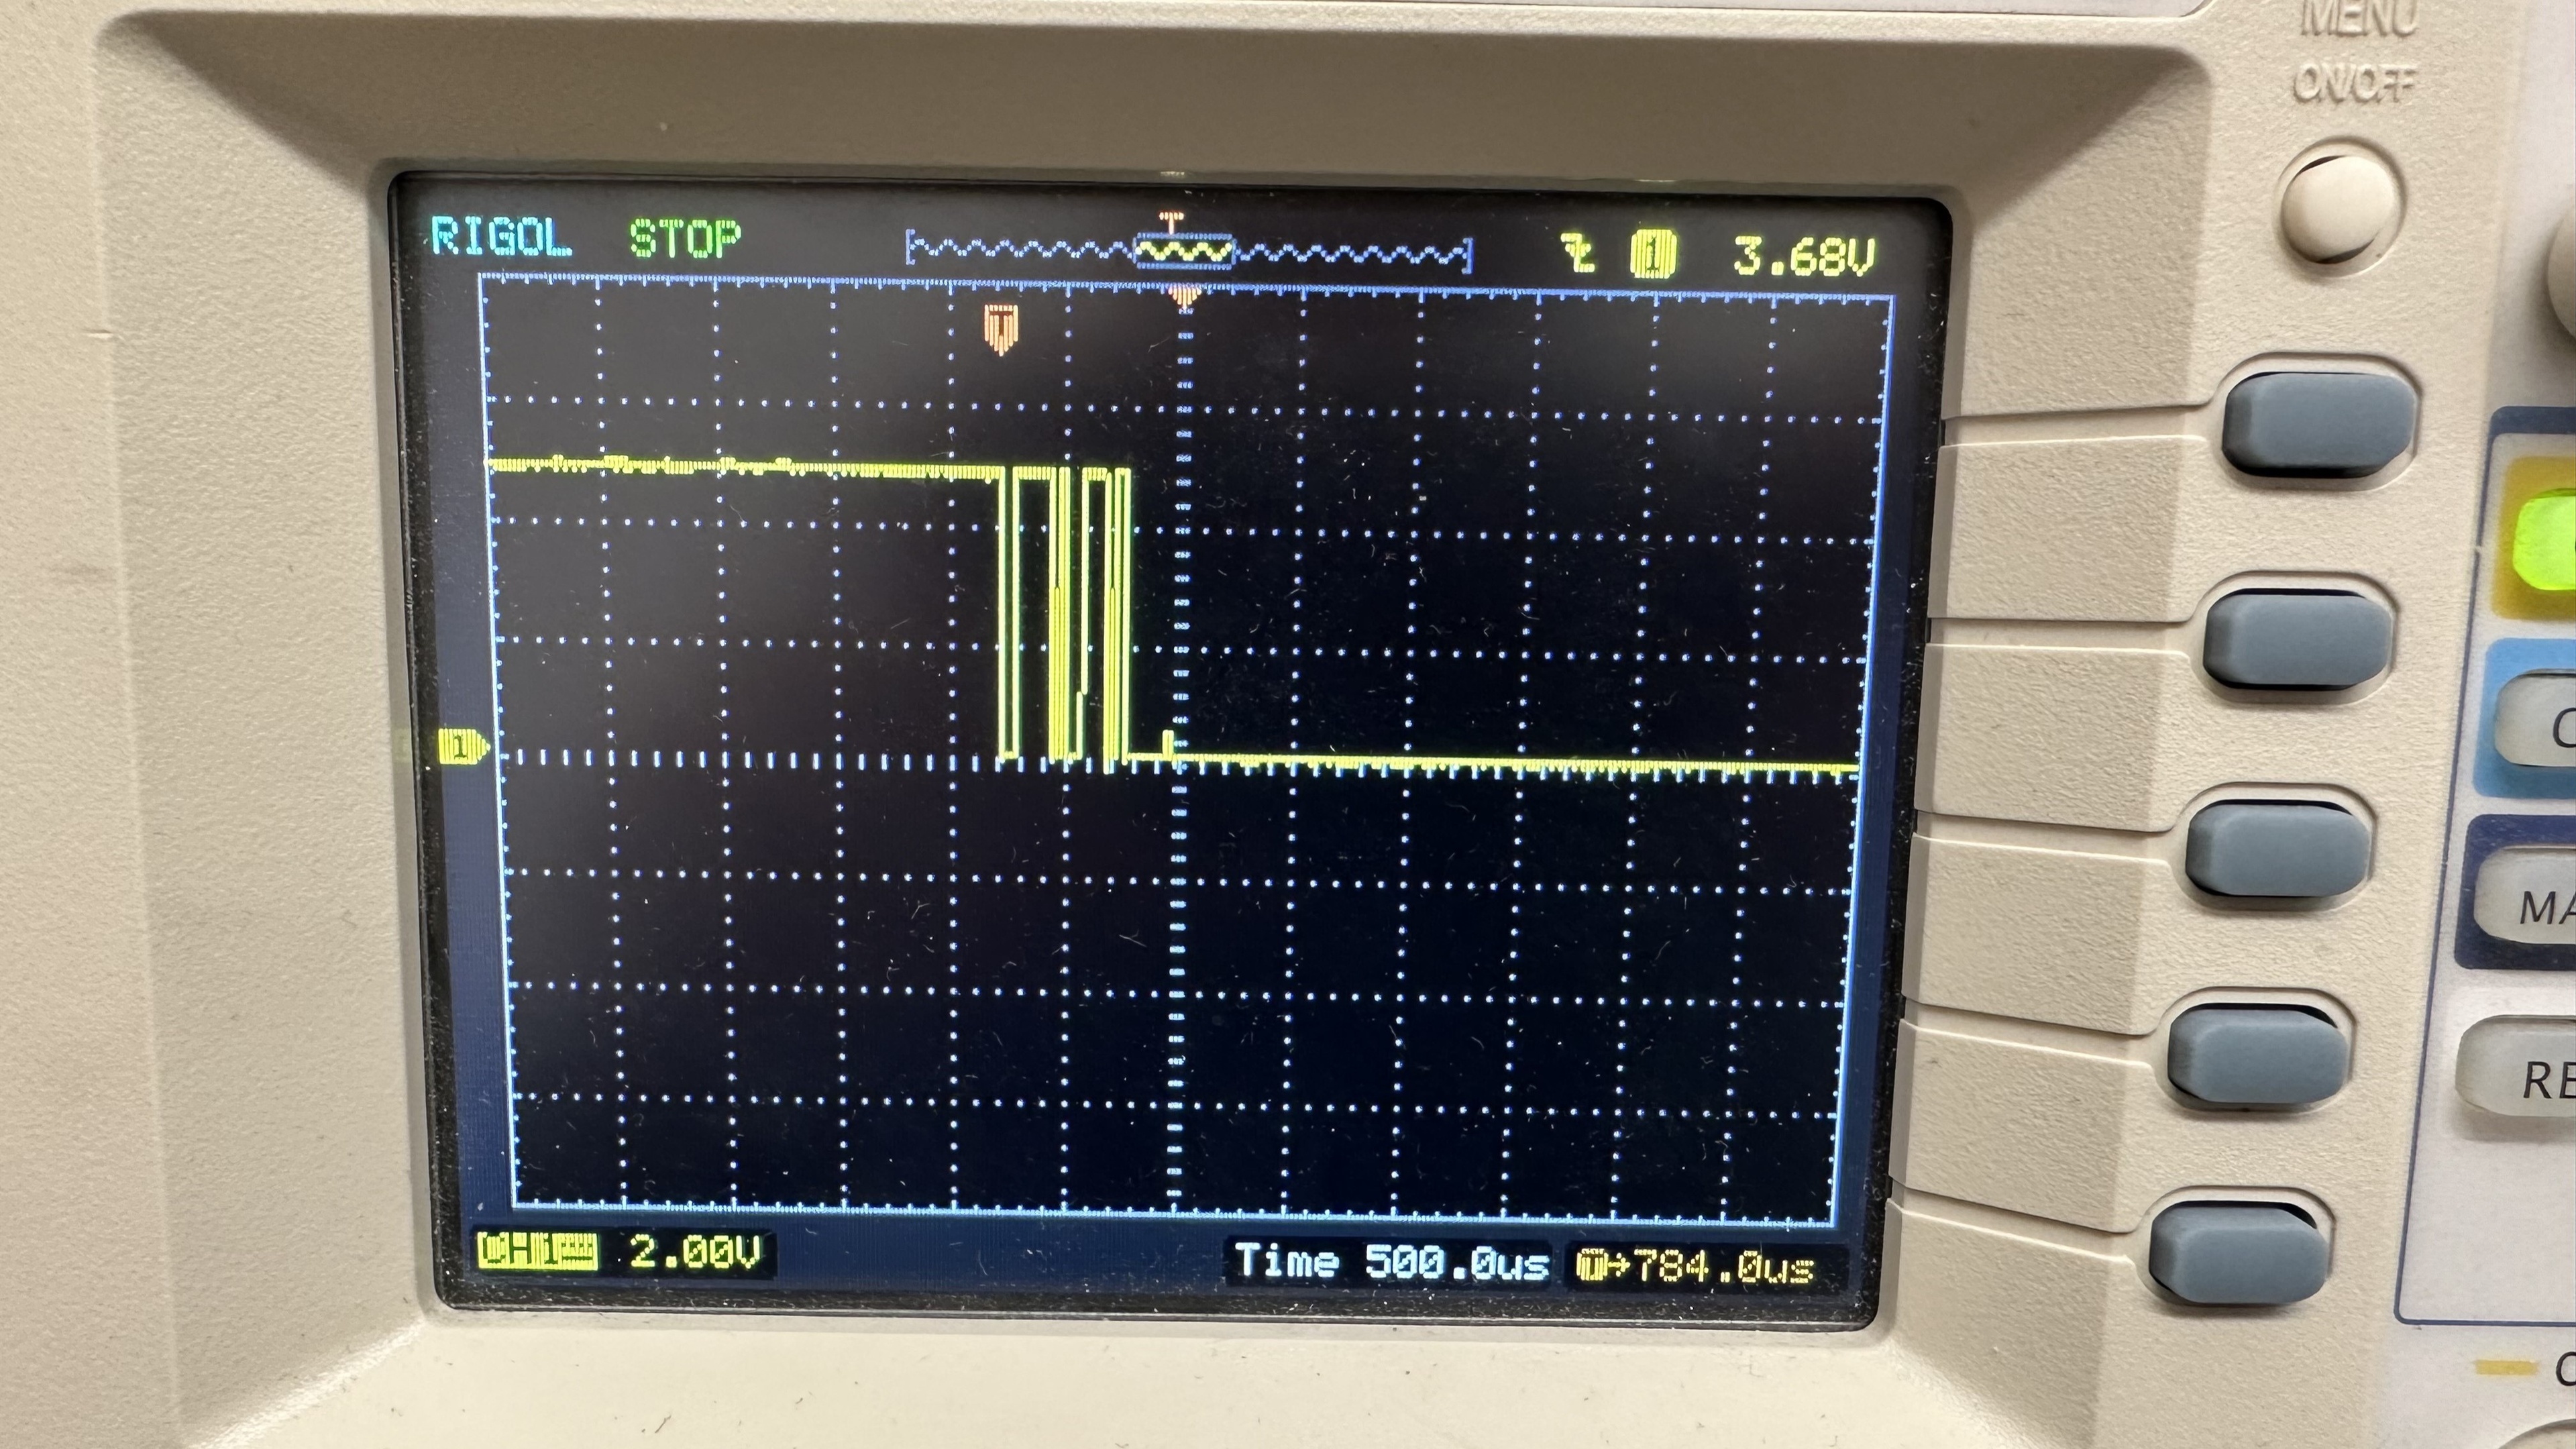
All testing speeds we tried produced bouncing for a period of about 500 µs (equal to 0.0005 seconds). When we looked at the actuation graph data from the test at 30 mm/min, the physical bouncing lasts for about 0.05 seconds (this looked like a typical amount of bouncing compared to other mice with mechanical switches).
That means that the electrical bouncing lasted for about 1/100th of the time that the force tester registered bouncing. This likely means that the amount of bouncing we see in the actuation graph does not indicate the amount of electrical bounce we will see in a switch.
What does this mean for our test?
As expected, our testing shows that optical switches show no sign of electrical bouncing, while mechanical switches do. Despite this, the actuation curves for most optical mice still show physical bouncing after the tactile point, much like the Razer Viper 8KHz below. For the slower sample, the bouncing is much less pronounced. However, it's still there (more on this in later sections). We, therefore, needed to look more into the bouncing and how to deal with it.
How we deal with the bouncing
Limitation of our testing rig
One limitation in our testing is that the testing probe is made of metal, which doesn't fully represent how a finger reacts to pressing a mouse button. The metal probe is good for accurately recording the press distance, but it can potentially contribute to the bouncing we see. Our theory was that since the probe is a rigid object moving at a constant speed, the mouse button could bounce back and forth against the probe when the spring plate buckles, causing the force readings to bounce. We tried observing the bouncing under slow motion (960 fps), but we couldn't observe any bouncing.
Testing with a more finger-like probe
To check whether the bouncing was due to our probe being rigid, we used a soft foam insert between the probe and mouse button to see how it would affect the results, the goal being to mimic the softness of a human finger. We performed this test on the Vaxee XE, which has mechanical switches and demonstrated very prominent bouncing.
 Vaxee XE with foam insert between probe and mouse button
The results reveal that the bouncing is only slightly dampened with the foam insert, which shows that the rigid probe likely isn't the primary cause of the bouncing. This testing method also introduced more pre- and post-travel since the foam compressed. For this reason, we stuck with the metal probe since the bouncing results weren't affected.
Is it the mouse button or the switch bouncing?
To better understand the bouncing, we tested a mechanical switch on its own. We used the ASUS ROG Chakram Core and removed the mouse button covers to reveal the bare Omron D2FC-F-K (50M) mechanical switch.
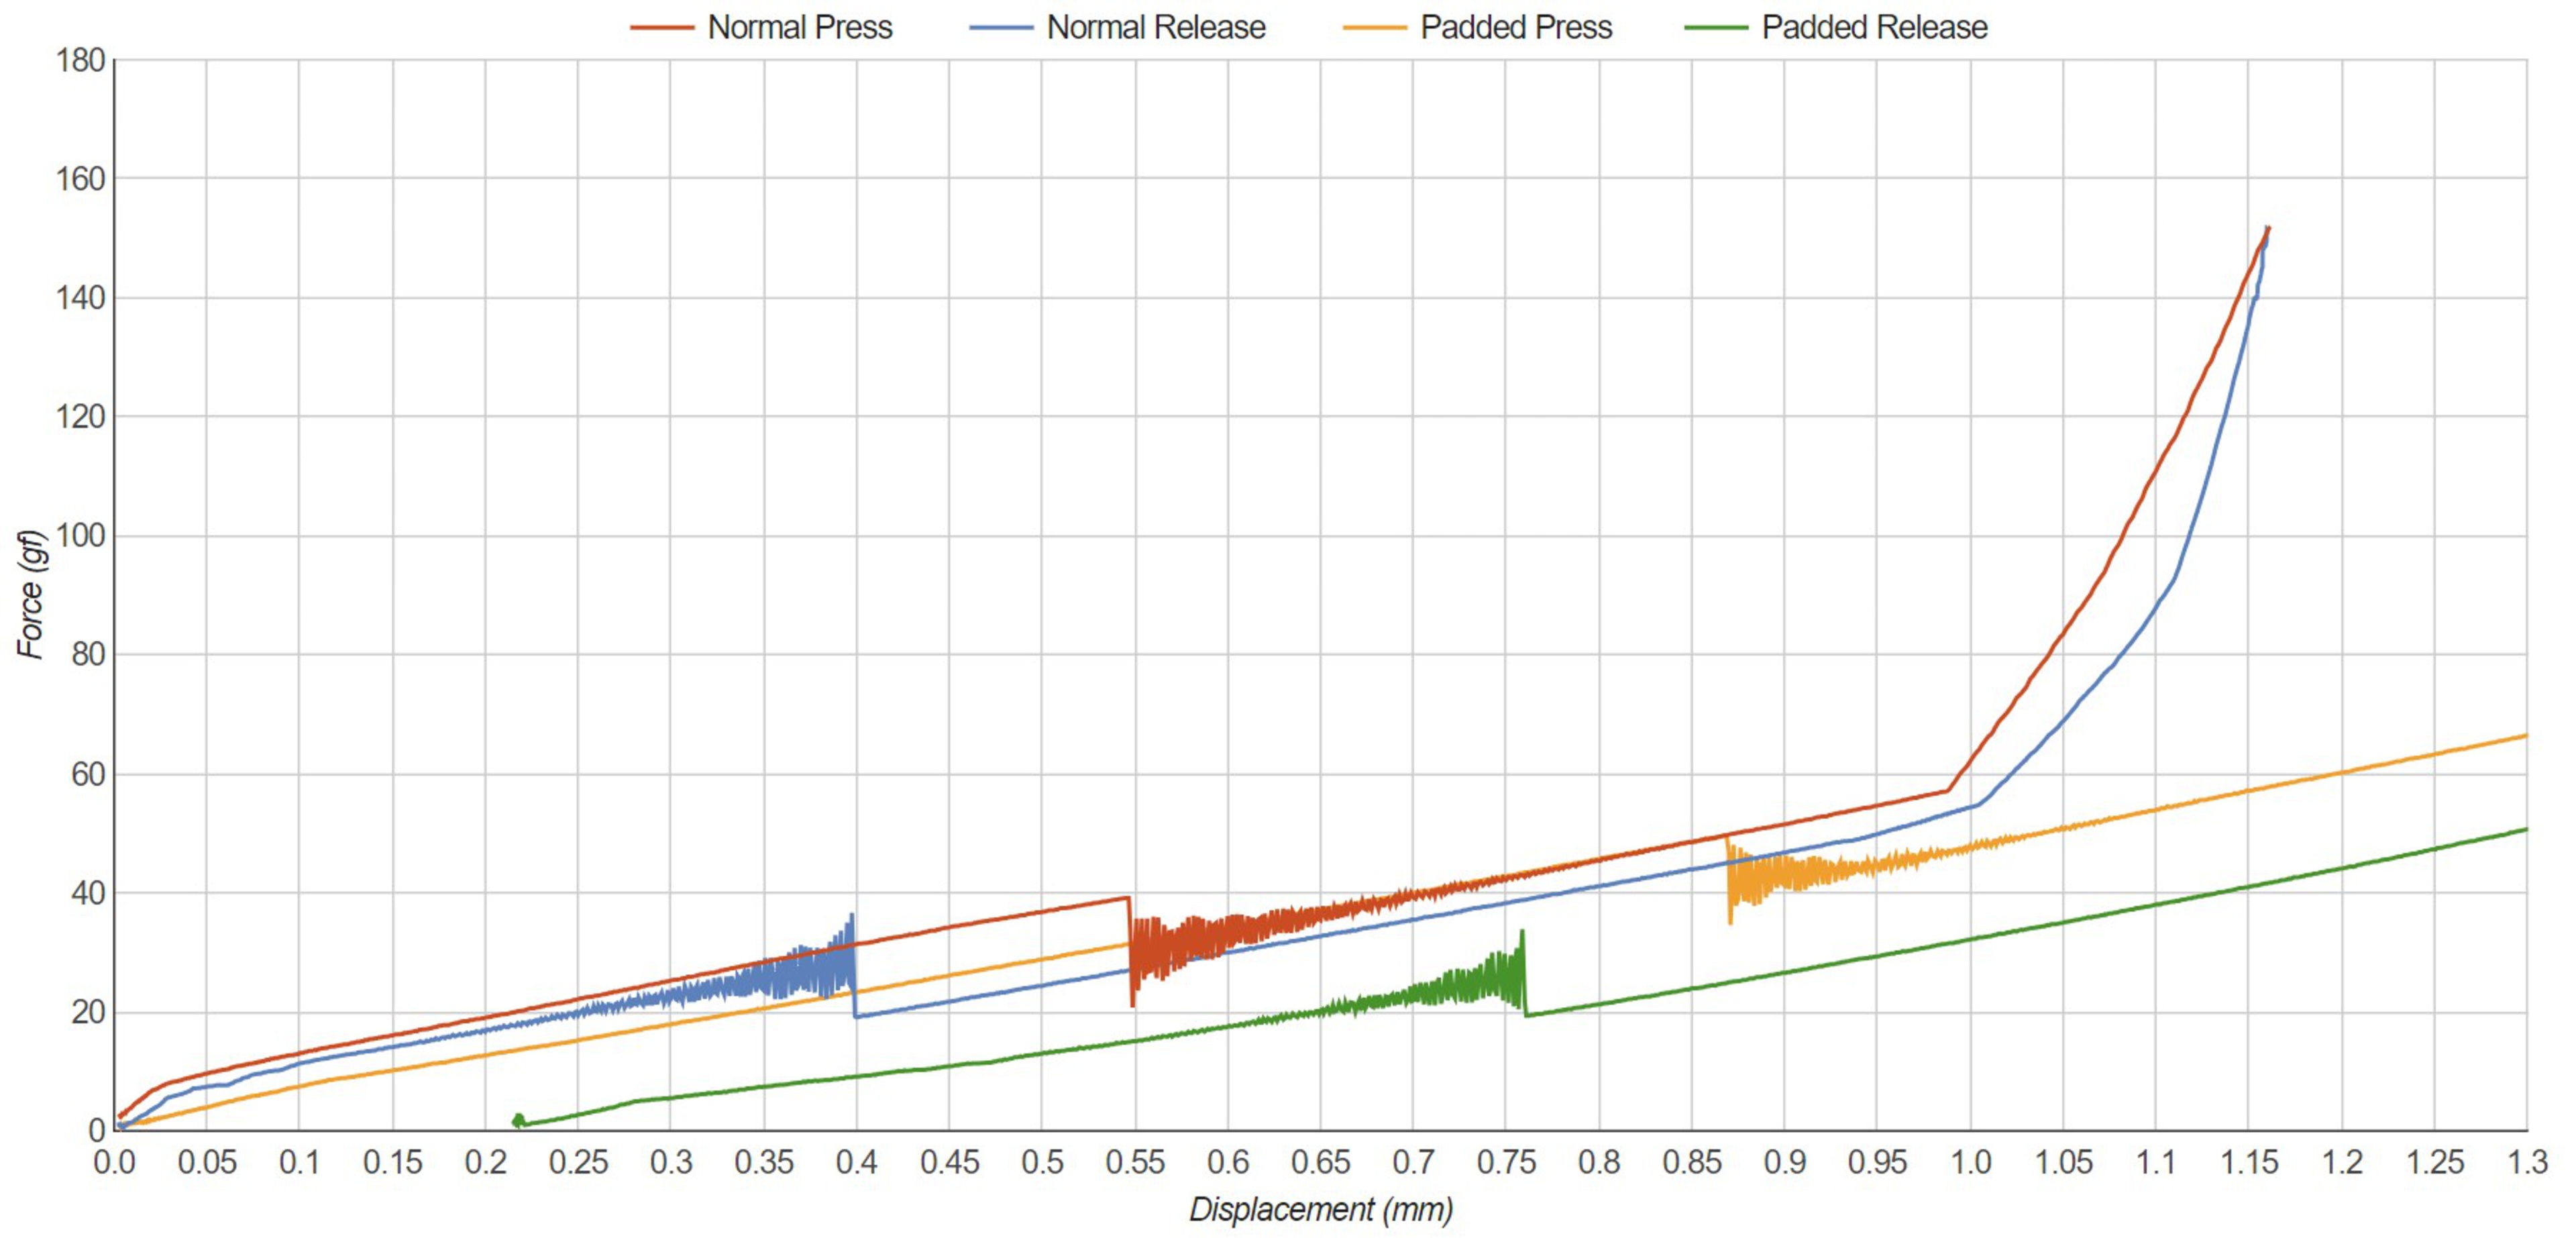
Below, we can compare the results to a normal click on the Chakram Core with the button cover to see its influence on the physical bouncing. With the button cover on (yellow and green curves), the displacement is increased; however, this is likely due to testing at a slightly different spot along the mouse. The more important takeaway from the graph is that there was still physical bouncing at the tactile and reset points. The same bouncing is visible when we look at the test directly on the Omron D2FC-F-K (50M) switch (red and blue curves). Since both samples seem to bounce a similar amount, we can conclude that the button cover does not play a large role in the amount of physical bouncing we see.
 Asus ROG Chakram Core with Omron D2FC-F-K (50M): tested directly on switch (Red, Blue) vs. normal actuation (Yellow, Green)
Influence of testing speed on bounce and actuation graphs
Since we can safely assume the bouncing we see isn't related to debounce and shouldn't be interpreted as such, our goal was to test the mice using a speed fast enough not to slow testing but slow enough to reduce the amount of bouncing present.
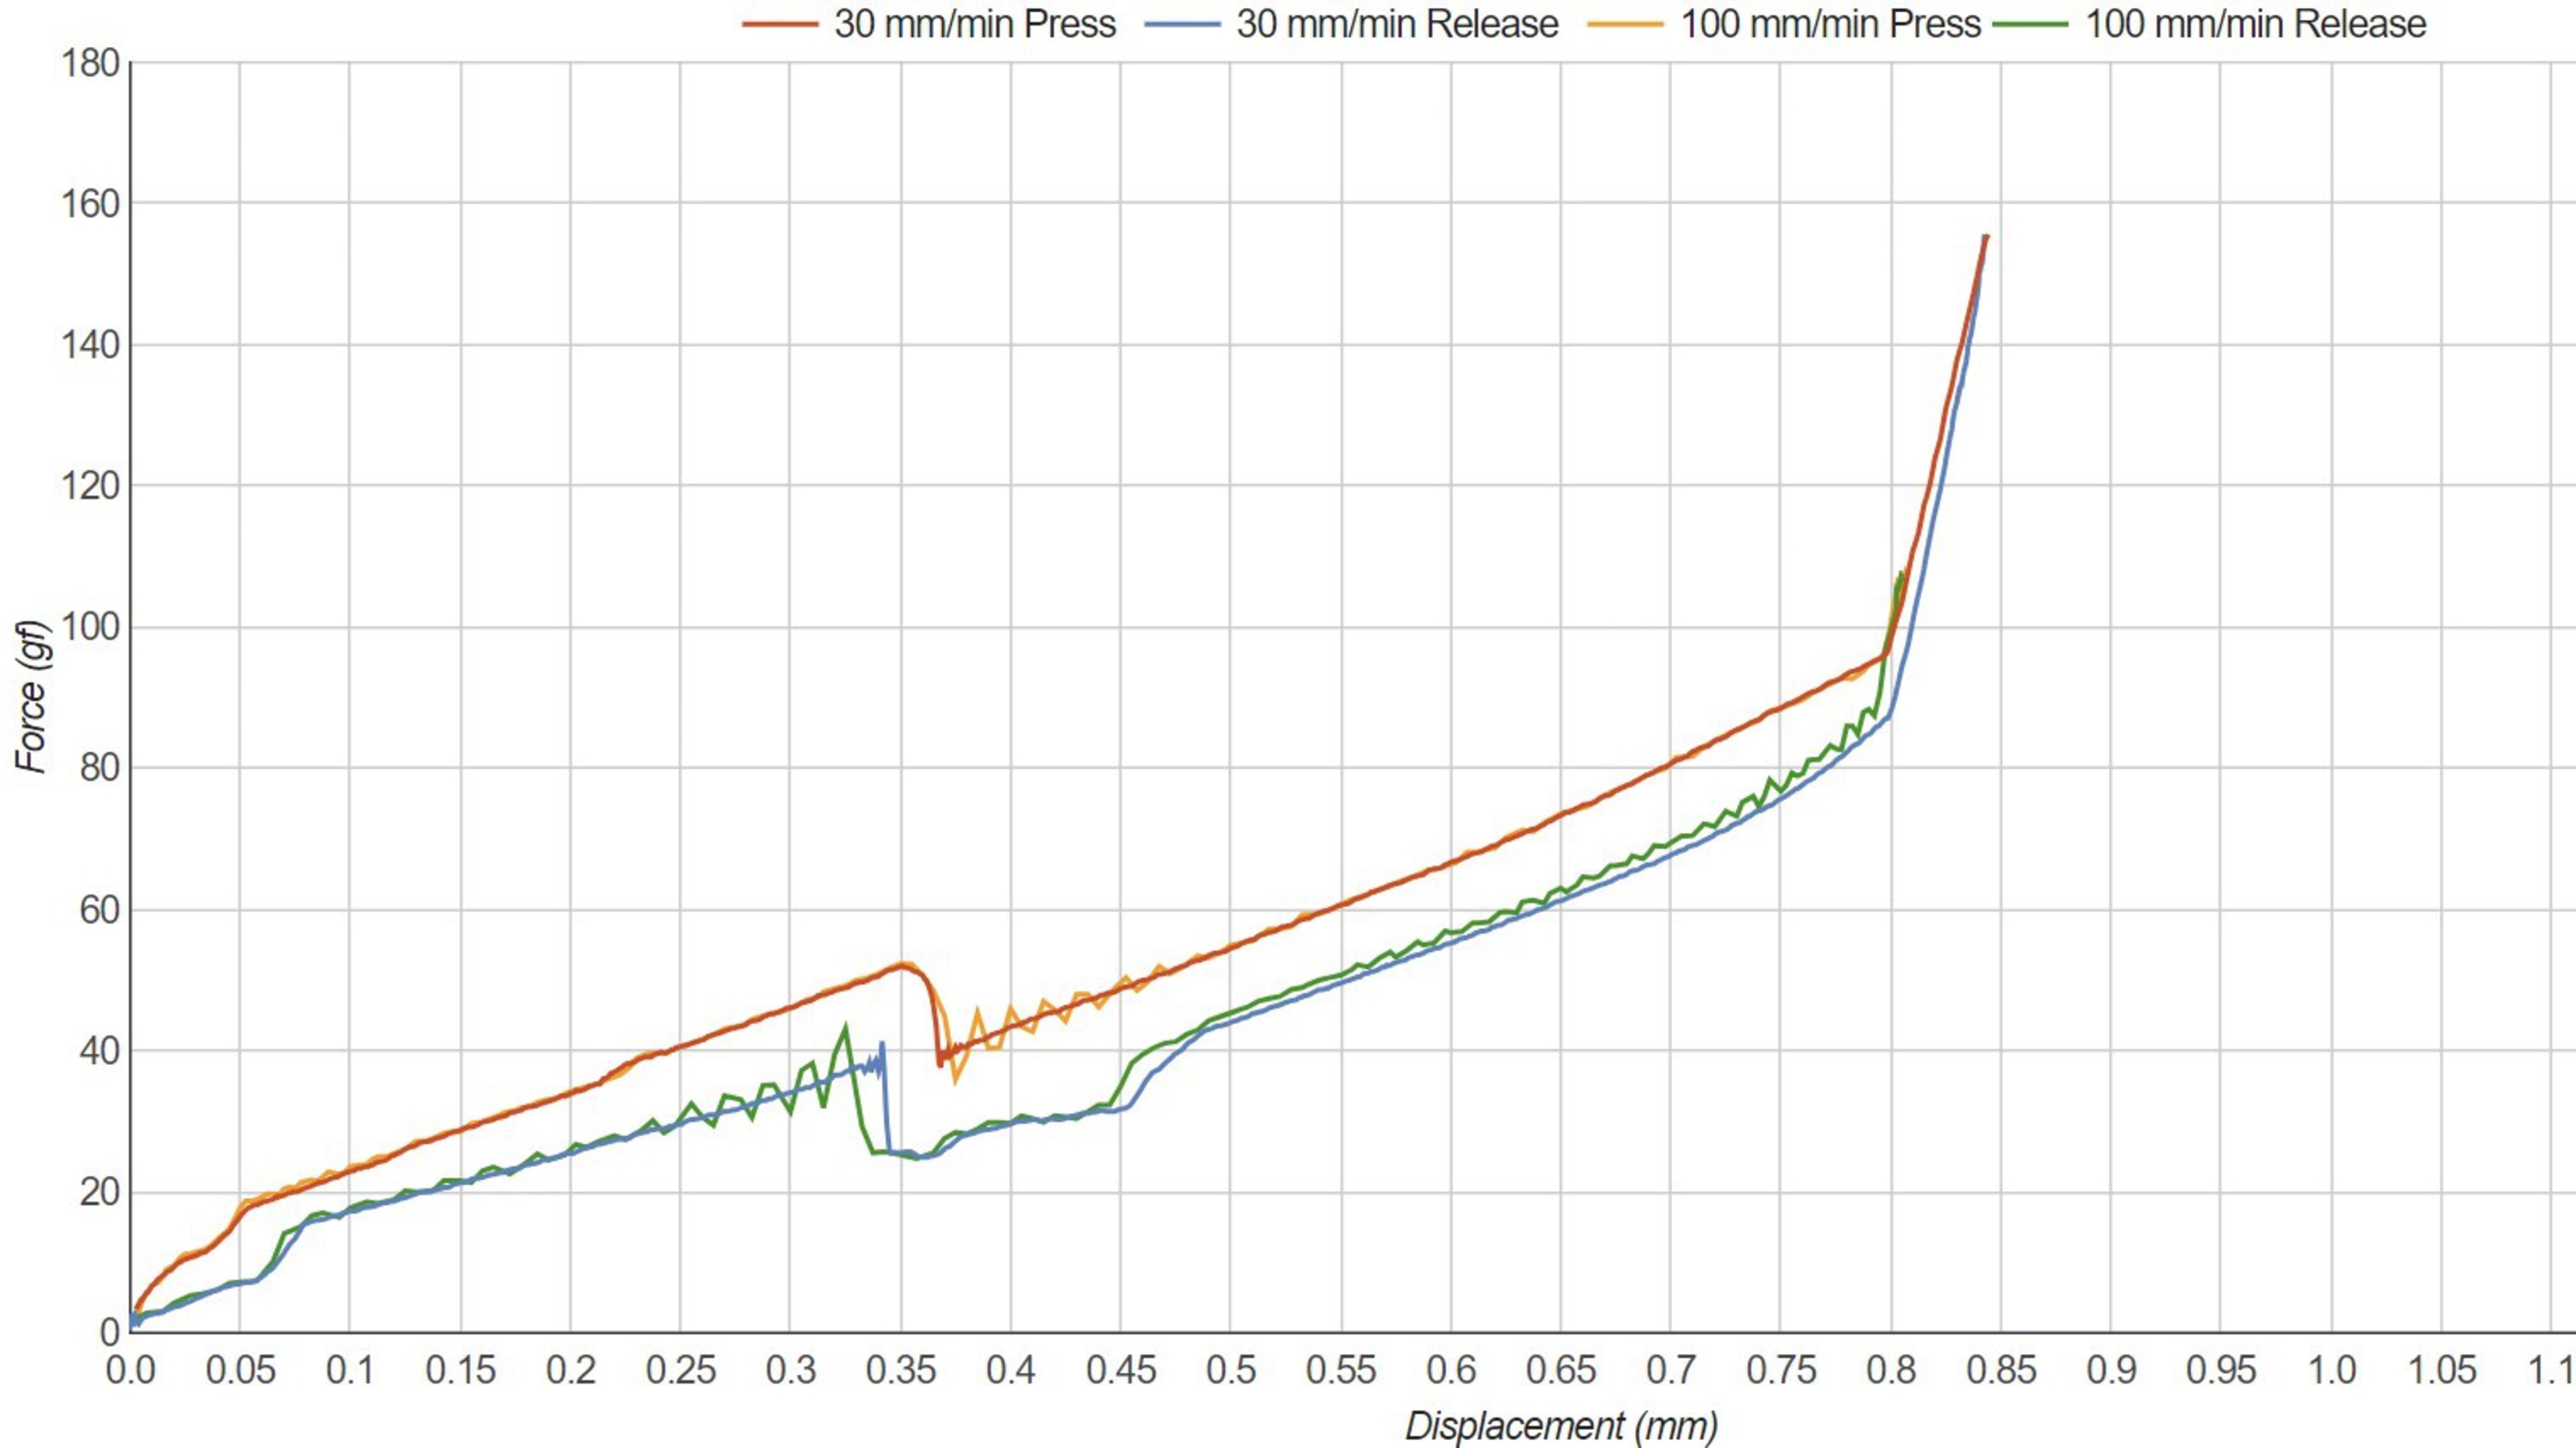
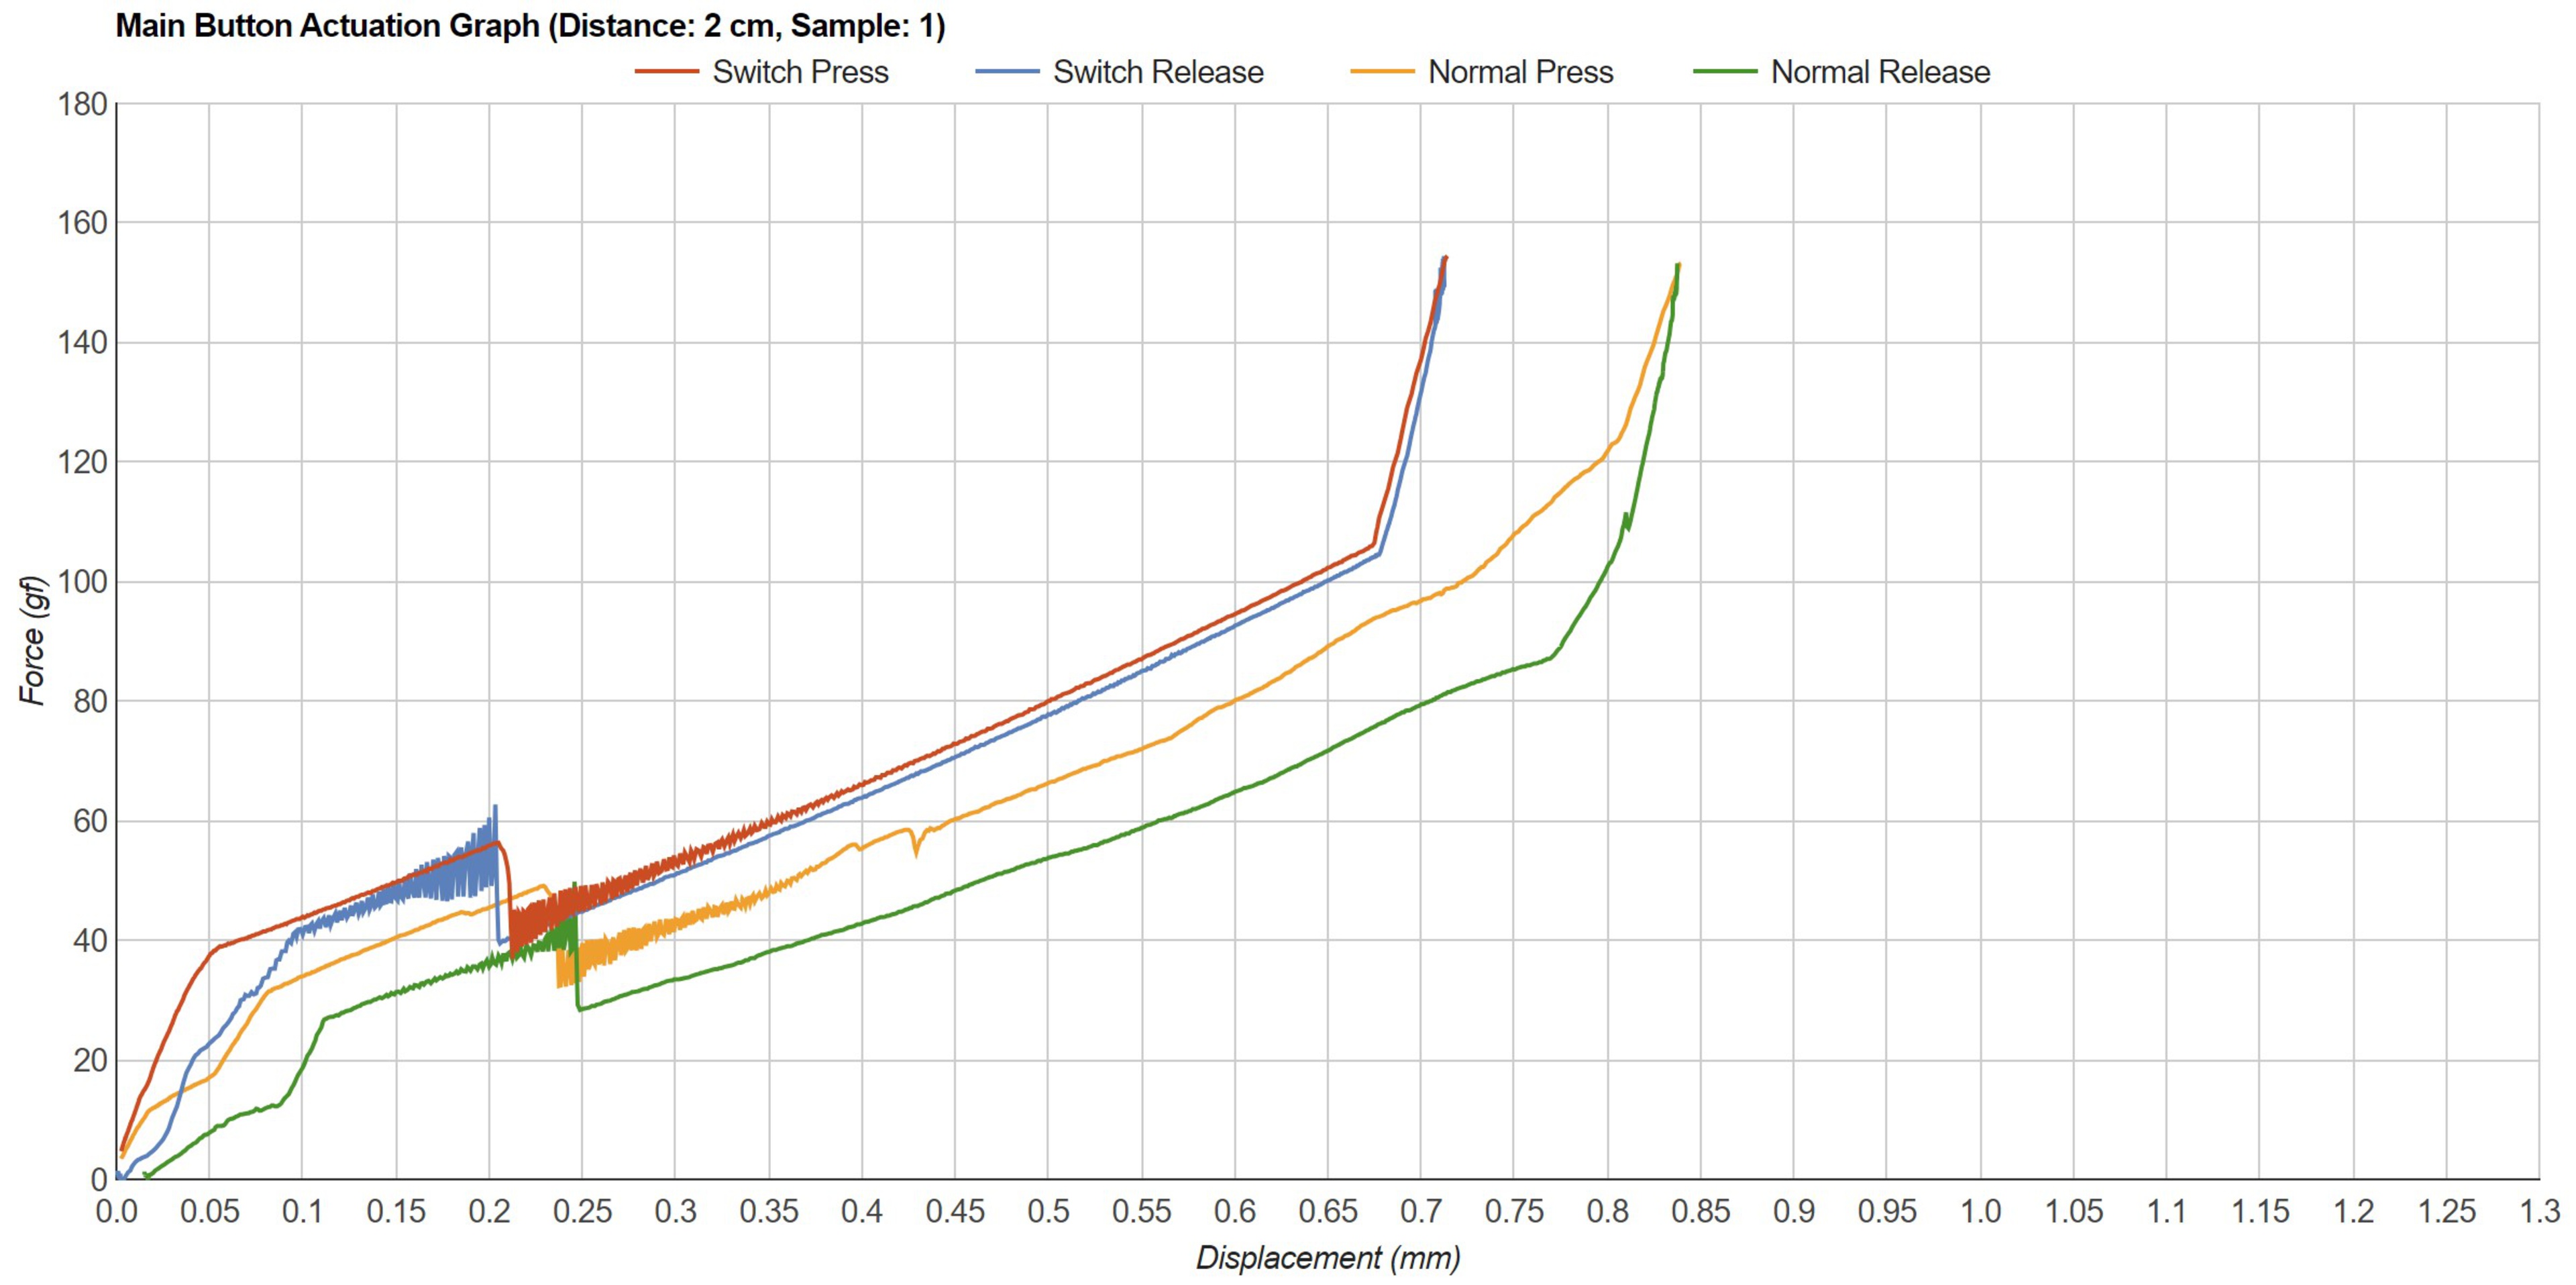
When we tested at very low speeds (around 5 mm/min), the "smooth" portions of the curves had many small bumps and were generally less smooth than the 30 mm/min sample. As mentioned above, the bouncing is less pronounced but still clearly visible. Regardless of what speed we chose, there was always some amount of bouncing in the actuation graphs. Additionally, since there are more lines of data, the slower tests would take longer to load the graphs when viewed online.
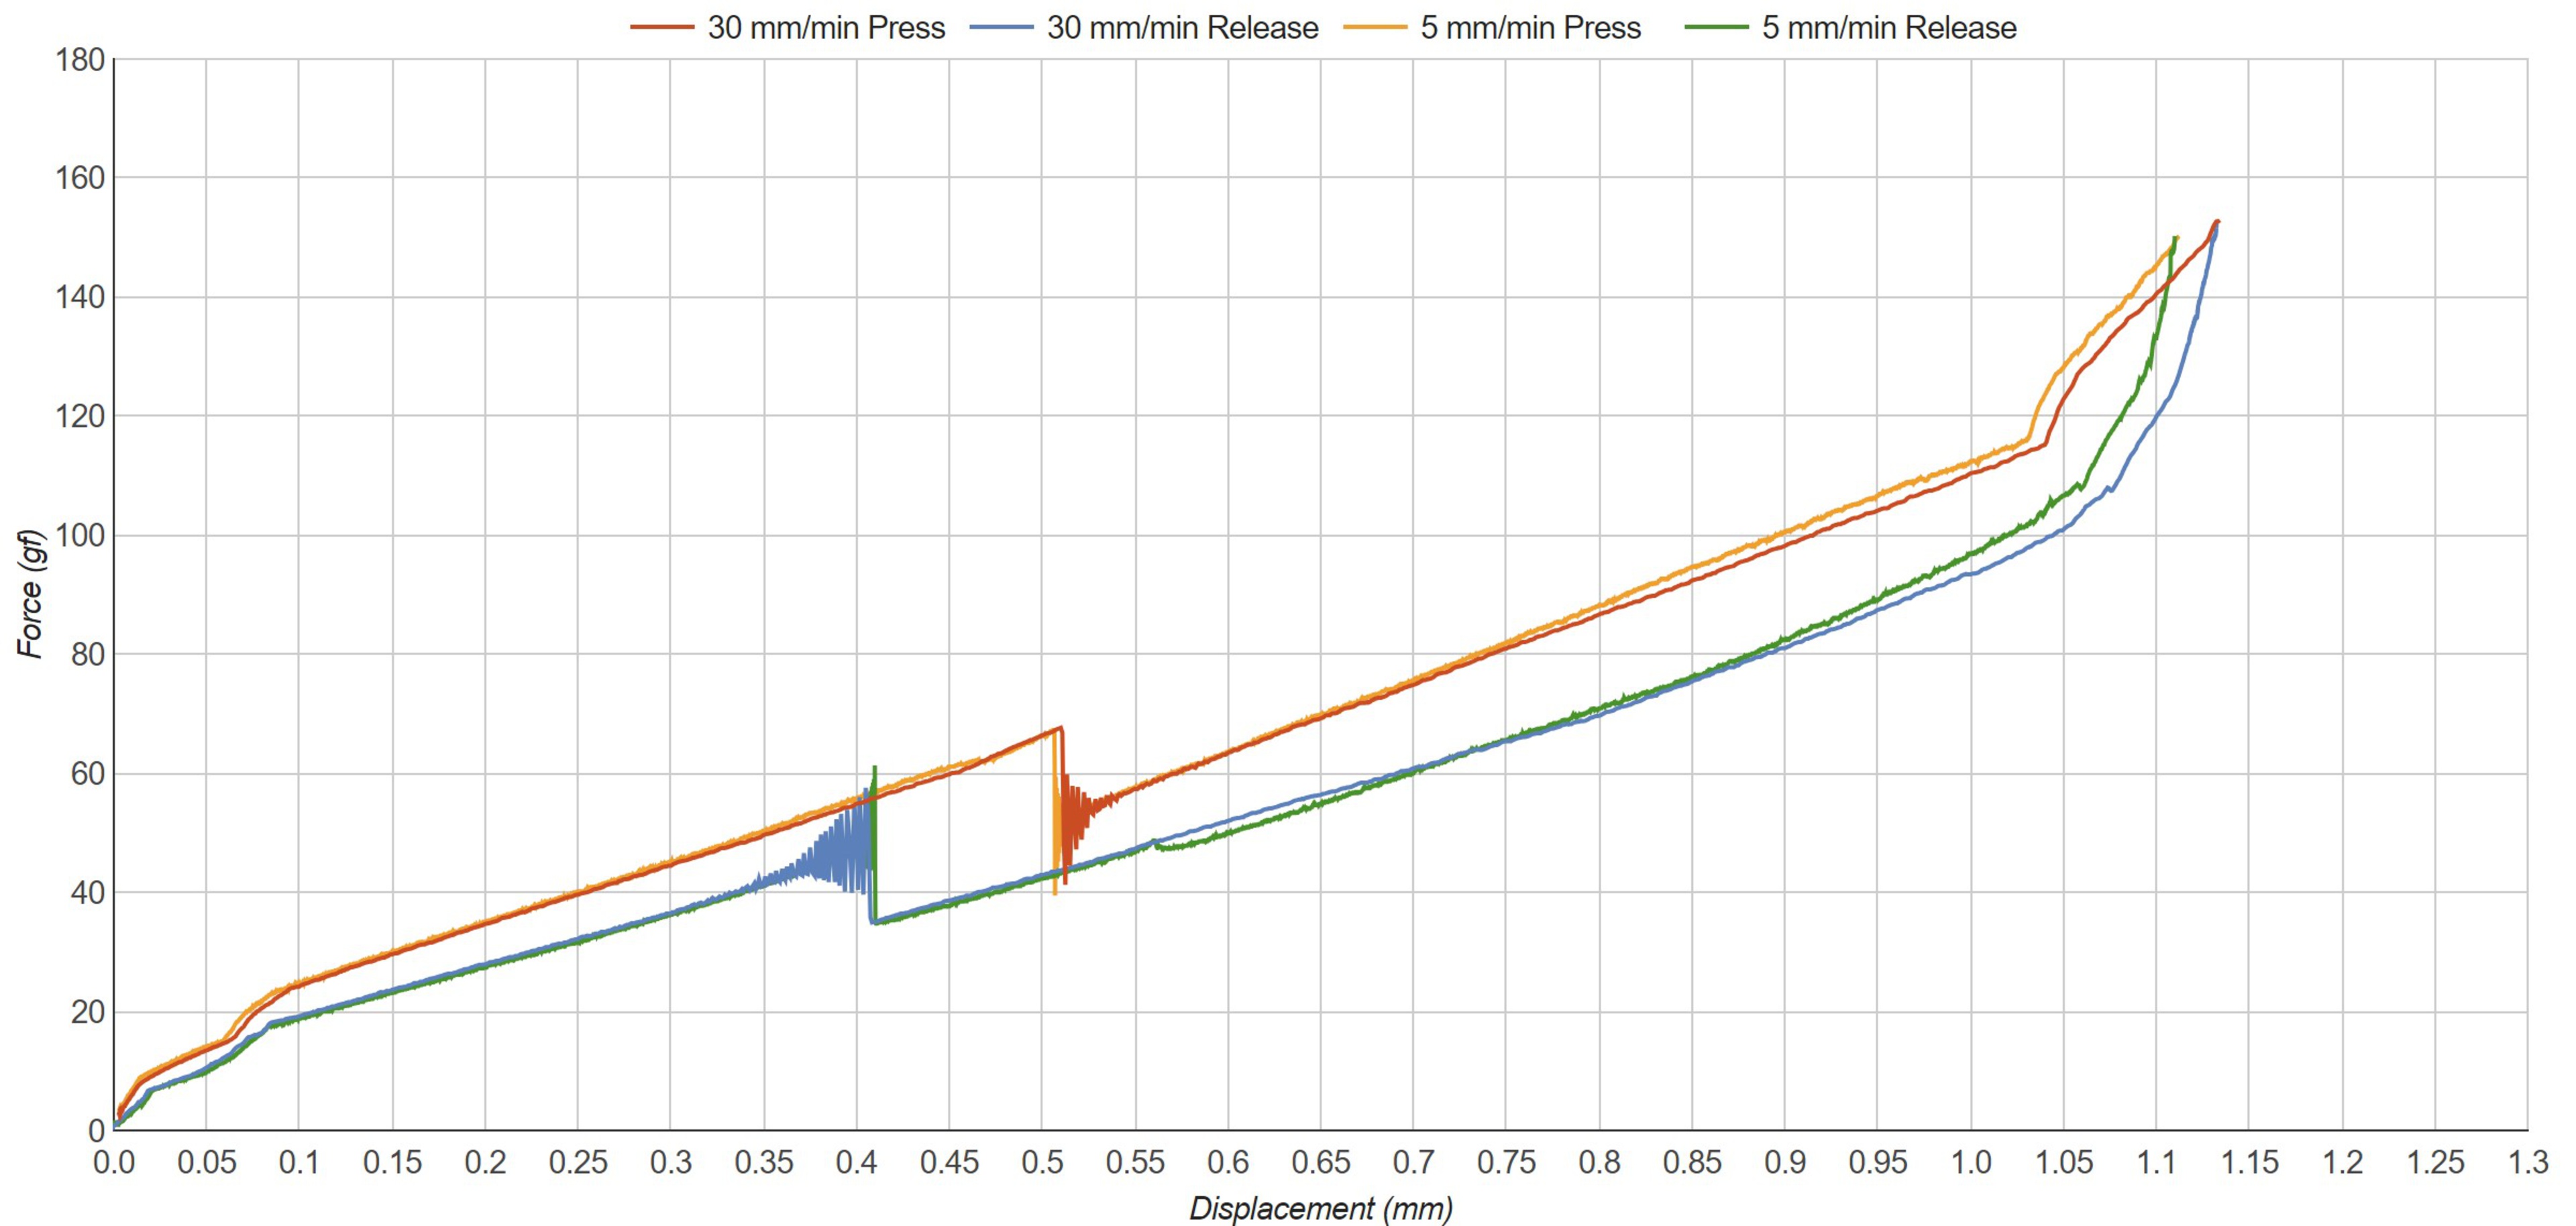 BenQ Zowie FK1-B at 30 mm/min vs. 5 mm/min (1 cm from front of button)
The bouncing was much more pronounced when we chose a faster speed, like 100 mm/min. For this reason, we chose 30 mm/min as our final testing speed, as it provides a good balance between low testing time, smooth curves, and limited bouncing.
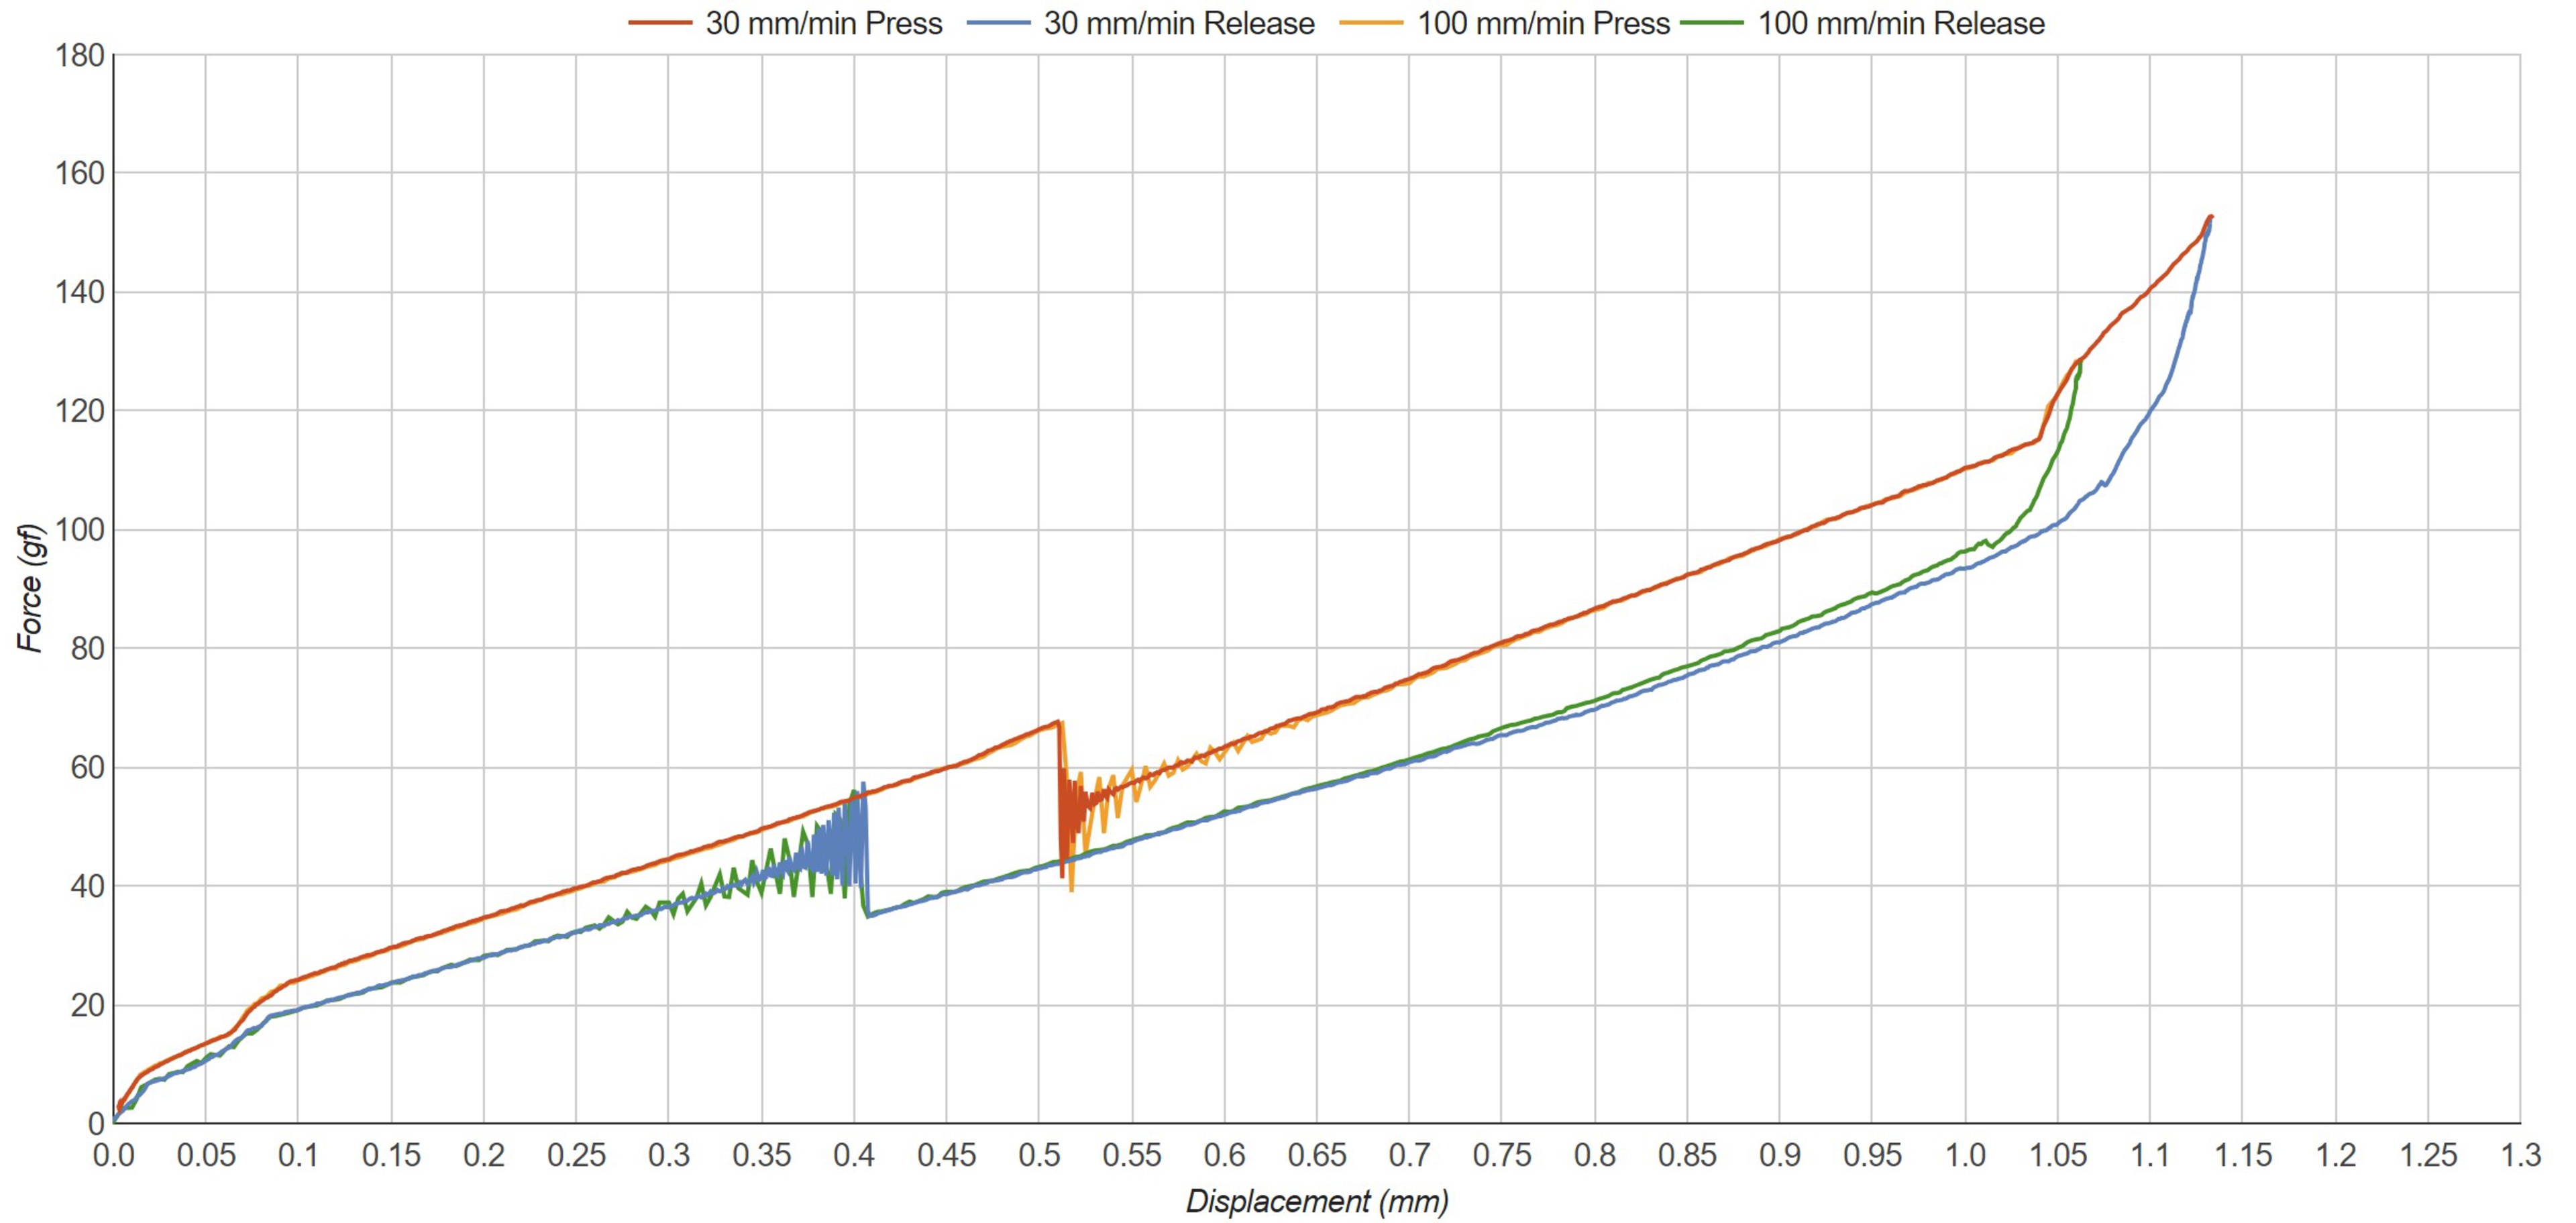 BenQ Zowie FK1-B at 30 mm/min vs. 100 mm/min (1 cm from front of button)
Test Variance And Limits
Switch vs. mouse construction
Making claims about how an individual switch performs can be hard to validate. Despite there being many different mouse switches with different tactile forces and characteristics, the construction of the mouse still plays a role in actuation. Since the construction of the mouse button itself will influence the results, it can be hard to determine whether the results are due to switch or mouse construction. For this reason, our test is best for evaluating a specific mouse with a specific switch, not one or the other.
Comparing tactile force variance
Although some people might be very sensitive to mouse tactile force, others might have a hard time differentiating between mice by tactile force alone. When we gave the HyperX Pulsefire Haste 2 to coworkers around the office, some could identify the 11 gf difference between the left and right mouse buttons, while others couldn't. For people with more sensitivity to actuation force, a difference of about 10 gf is around the limit of where it's noticeable.
Impact of test variance on tactile force
If we assume that the force change between points is linear like we did with the HyperX Pulsefire Haste 2 and Pulsefire Haste 2 Wireless in a previous section, we can say that the variation in force due to human error is likely about 1.5 gf/mm. We can position the force testing probe to within about plus-or-minus 1 mm with accuracy, so the variance due to human error is about 3 gf. In addition, our largest standard deviation when testing the Haste 2 mice was about 1 gf, which we can assume is representative of all our mice tested. Altogether, we get a test variance of about 4 gf, significantly below the threshold at which the difference may be perceptible.
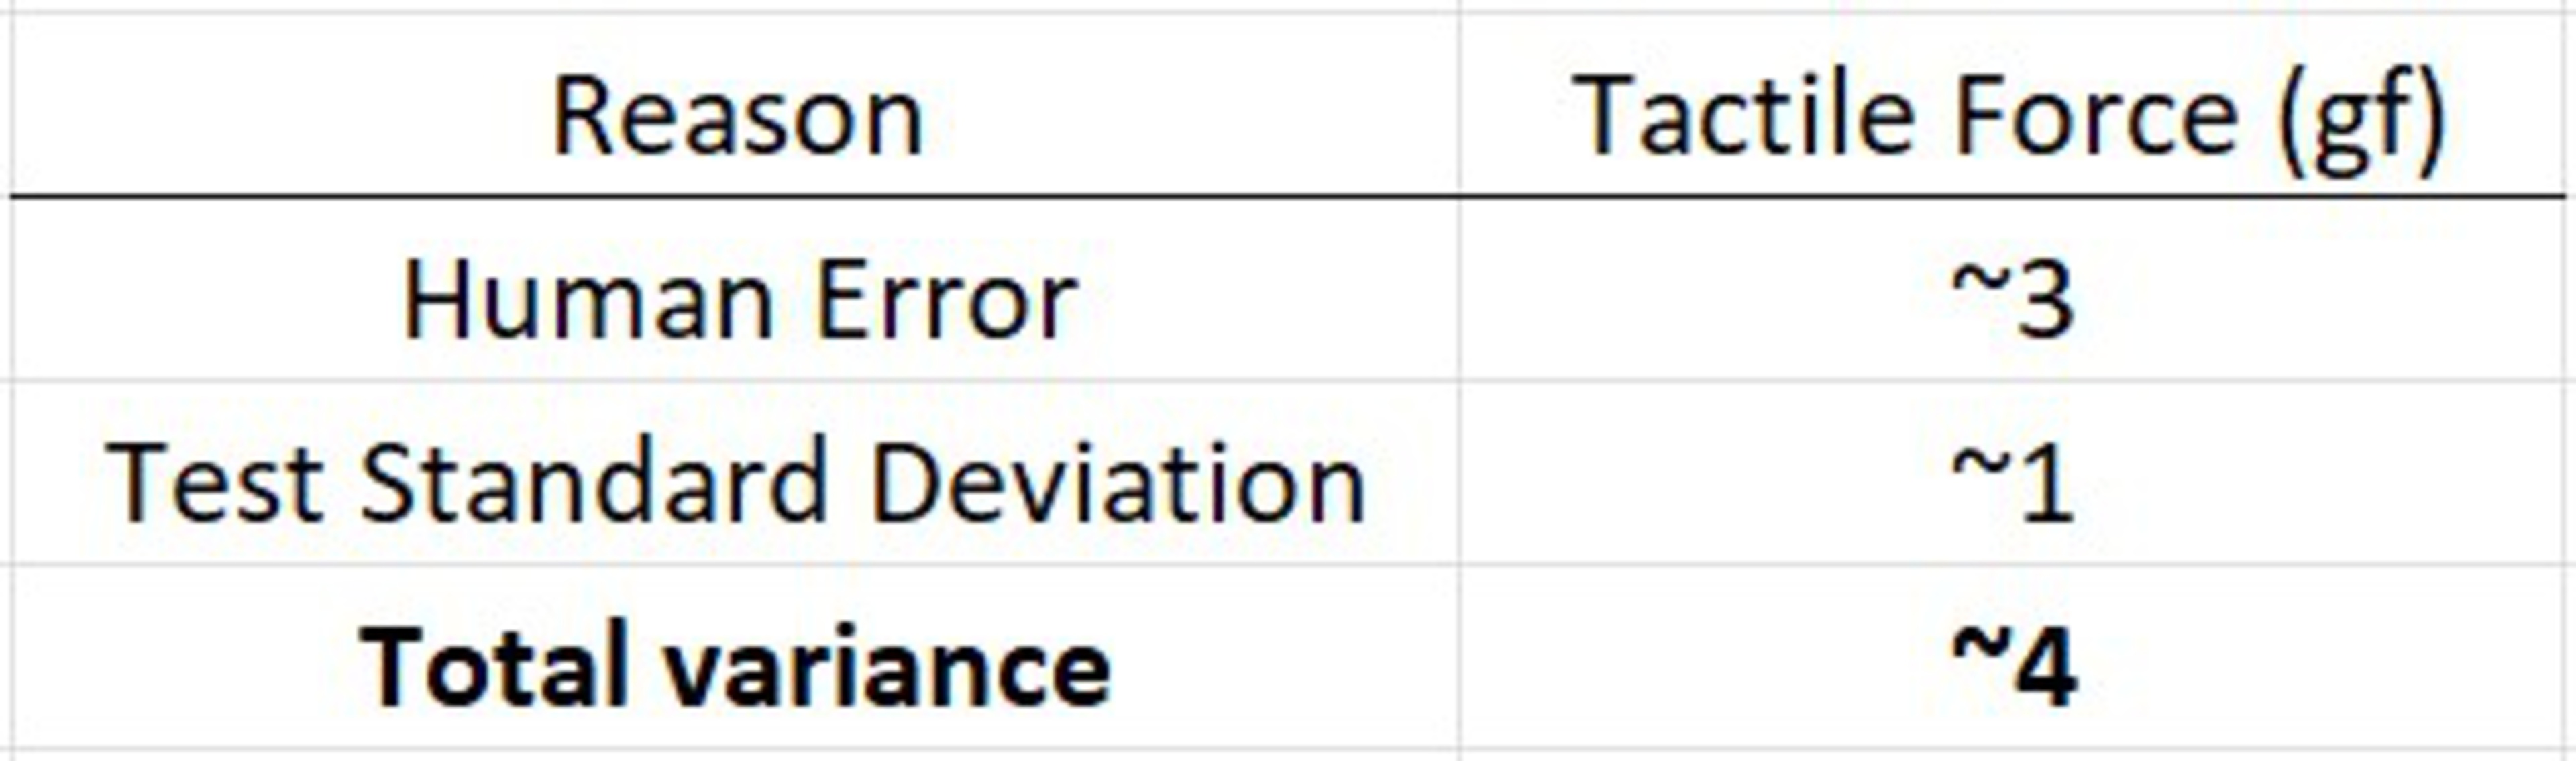 Tactile force variance from test
Bouncing
We don't currently know how much (if any) of the bouncing is caused by our testing probe and how much is due to switch bounce. However, we can conclude that the amount of physical bouncing shouldn't be interpreted as 'debounce'. We have no evidence that they're directly correlated. We also know that the physical bouncing isn't increased/decreased by the button cover.
Though we don't know the cause of the physical bouncing, it's possible that the spring plate could be vibrating after press/release enough to be registered by our testing machine. From the diagrams, it looks like many optical switches also use a spring plate, similar to mechanical switches. Since it's not responsible for the electrical signal in optical switches, it doesn't electrically bounce, which would explain why we only see physical bouncing with optical switches.
An important note on the bouncing is that no one in the office could detect (by hand) that there was any physical bouncing whatsoever. Even with a mouse like the Vaxee XE that exhibits significant bouncing, we couldn't feel the bouncing in hand. Although the mice have different feeling clicks, a more/less "bouncy" mouse was not distinguishable.
Conclusion
Looking back to the problem, our new test shows tactile force, total travel, and pre-travel for multiple points along the mouse. Furthermore, the tactile graph is precise enough to catch discrepancies like those found in the LAMZU Atlantis:
LAMZU Atlantis vs. Endgame Gear XM1r actuation graphOverall, this test provides an indication of how the main button of a mouse feels and performs.
Pros and cons:
+ Relates well with the Hand Size Recommendation box to provide targeted information
+ Precise enough to catch discrepancies
+ Only minor variance in tactile force results due to test variance (~4 gf)
- Potential variation in results due to manufacturing variance between individual switches of the same make and model
Sources
[1] Reddit, rist0ph, "Second Atlantis with substantial M1 pre-travel", 4 February 2023. [Online]. https://www.reddit.com/r/MouseReview/comments/10tk7zo/second_atlantis_with_substantial_m1_pretravel/
[2] Razer, "Razer Optical Mouse Switches", 2023. [Online]. https://www.razer.com/technology/razer-optical-mouse-switch