- Table of Contents
- Intro
- When It Matters
- Our Tests
- Additional Information
- How To Get The Best Results
- Conclusion
- Comments
Our Monitor Picture Quality Tests
HDR Color Volume
A monitor's HDR color volume defines the range of colors it displays at various luminance levels. Having a monitor with good color volume improves the picture quality in HDR, as it can show bright and dark colors as intended, while a monitor with limited color volume looks washed out.
We measure the color volume in two common HDR color spaces, DCI-P3 and Rec. 2020, using unnormalized targets. We include graphs so you can see how the monitor performs with various colors. Also, we measure it at the same time as the color gamut, which represents the range of colors a monitor displays.
You can learn more about our HDR color volume testing in TVs here.
Test results
When It Matters
Having a monitor with good color volume matters for anyone watching any type of HDR content, whether it's gaming or watching the latest movies. HDR content displays a wider range of colors at higher brightness levels than SDR content (see SDR vs HDR), and most sources support HDR, like PCs, gaming consoles, and Blu-rays. There are a few formats that HDR content is available in, like HDR10, HDR10+, and Dolby Vision, although most monitors are limited to the basic HDR10 format.
While most modern monitors at least support HDR10, that doesn't guarantee content looks any good, as the monitor still needs proper performance to take full advantage of HDR content. The color volume is one of a few factors that impact picture quality, alongside other factors like contrast and brightness, and it helps make colors appear vivid. On the other hand, HDR content on monitors with poor color volume looks washed out and dull without many details, so they don't take full advantage of HDR content.
Our Tests
We measure the HDR color volume using a Colorimetry Research CR-100 Colorimeter and Octave software on our testing PC. Using a 10% window size on the screen, Octave displays various colors and measures the color volume. It then generates graphs of the monitor's color volume compared to an ideal volume and calculates it as a percentage. We measure the DCI-P3 and Rec. 2020 color spaces, and although there are other color spaces, like the wider Rec. 2100, these two are the most common in HDR content. We measure it using our recommended HDR picture mode, but we don't perform any calibration in HDR.
1,000 cd/m² DCI-P3 Coverage ICtCp
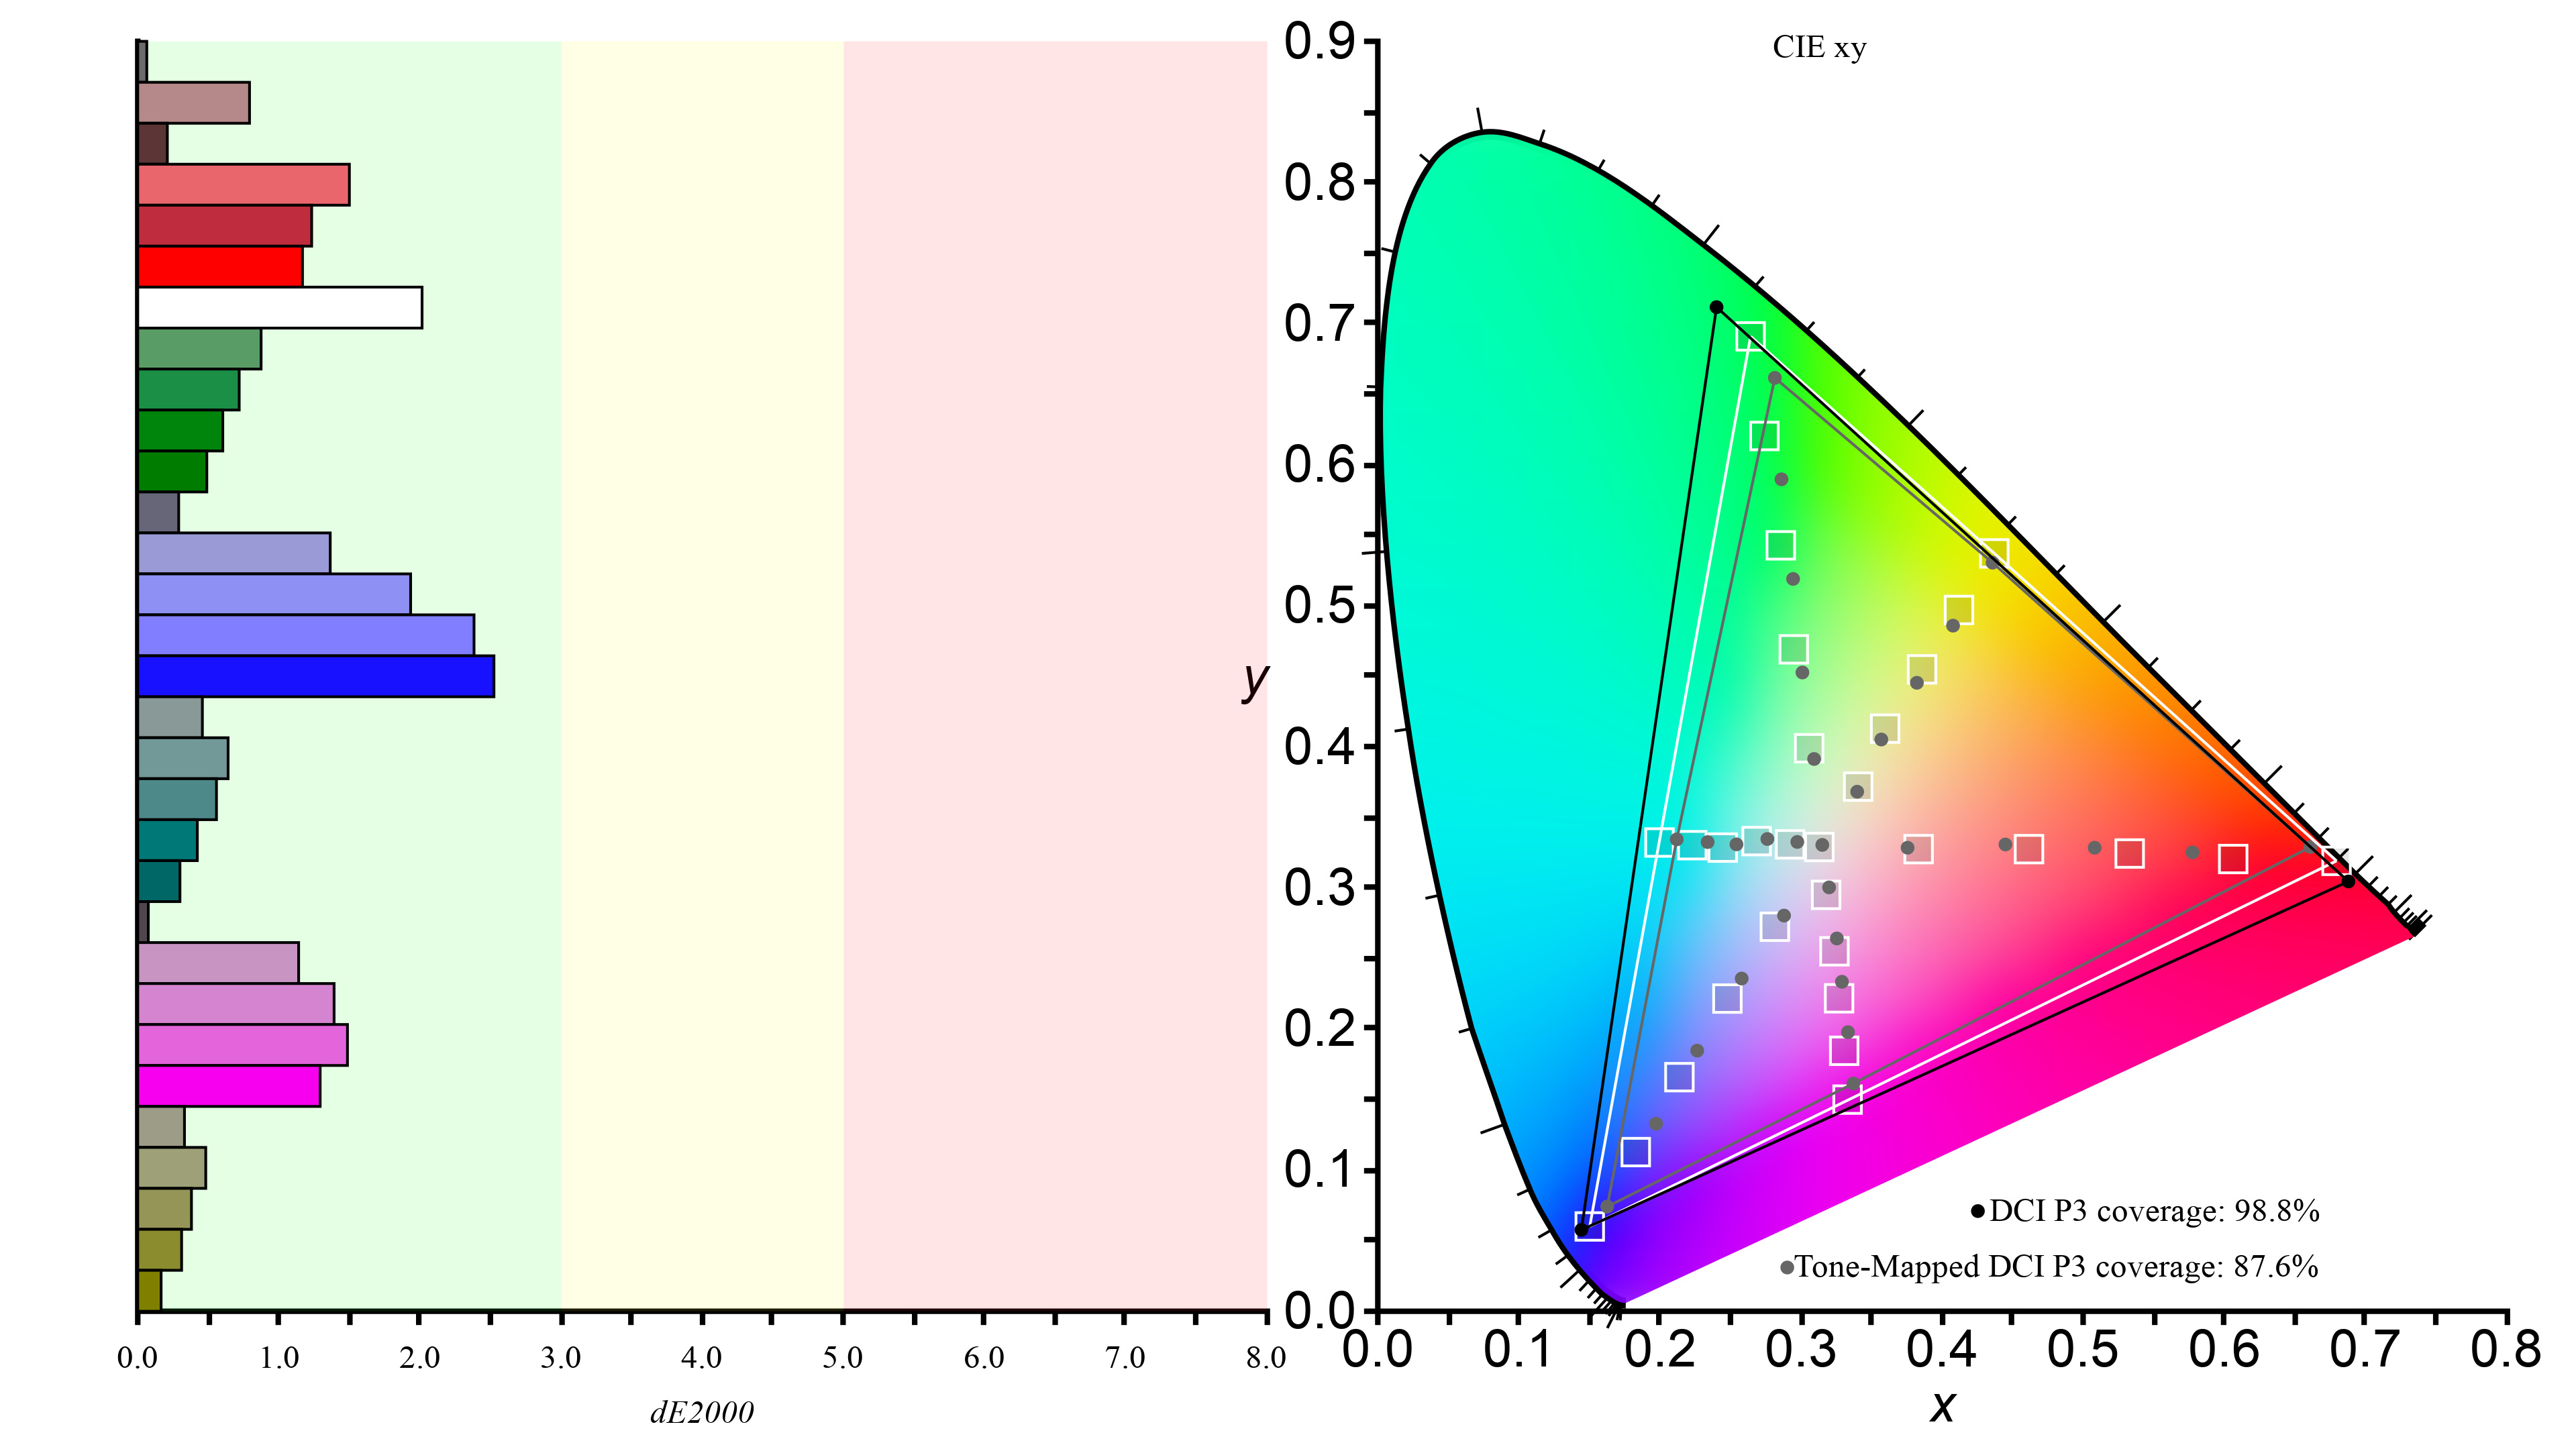
The color volume in DCI-P3 within the ICtCp color format measures how many colors the monitor can display at various luminance levels. DCI-P3 is a common color space that most HDR content uses, and limiting it to the ICtCp color format space means that any oversaturated or overbrightened colors aren't included in the test. The result is given as a percentage of colors that it displays versus an ideal display with a peak brightness of 1,000 cd/m², so a monitor with 90% color volume can display 90% of colors in DCI-P3 compared to an ideal display, and no monitor can exceed 100% color volume.
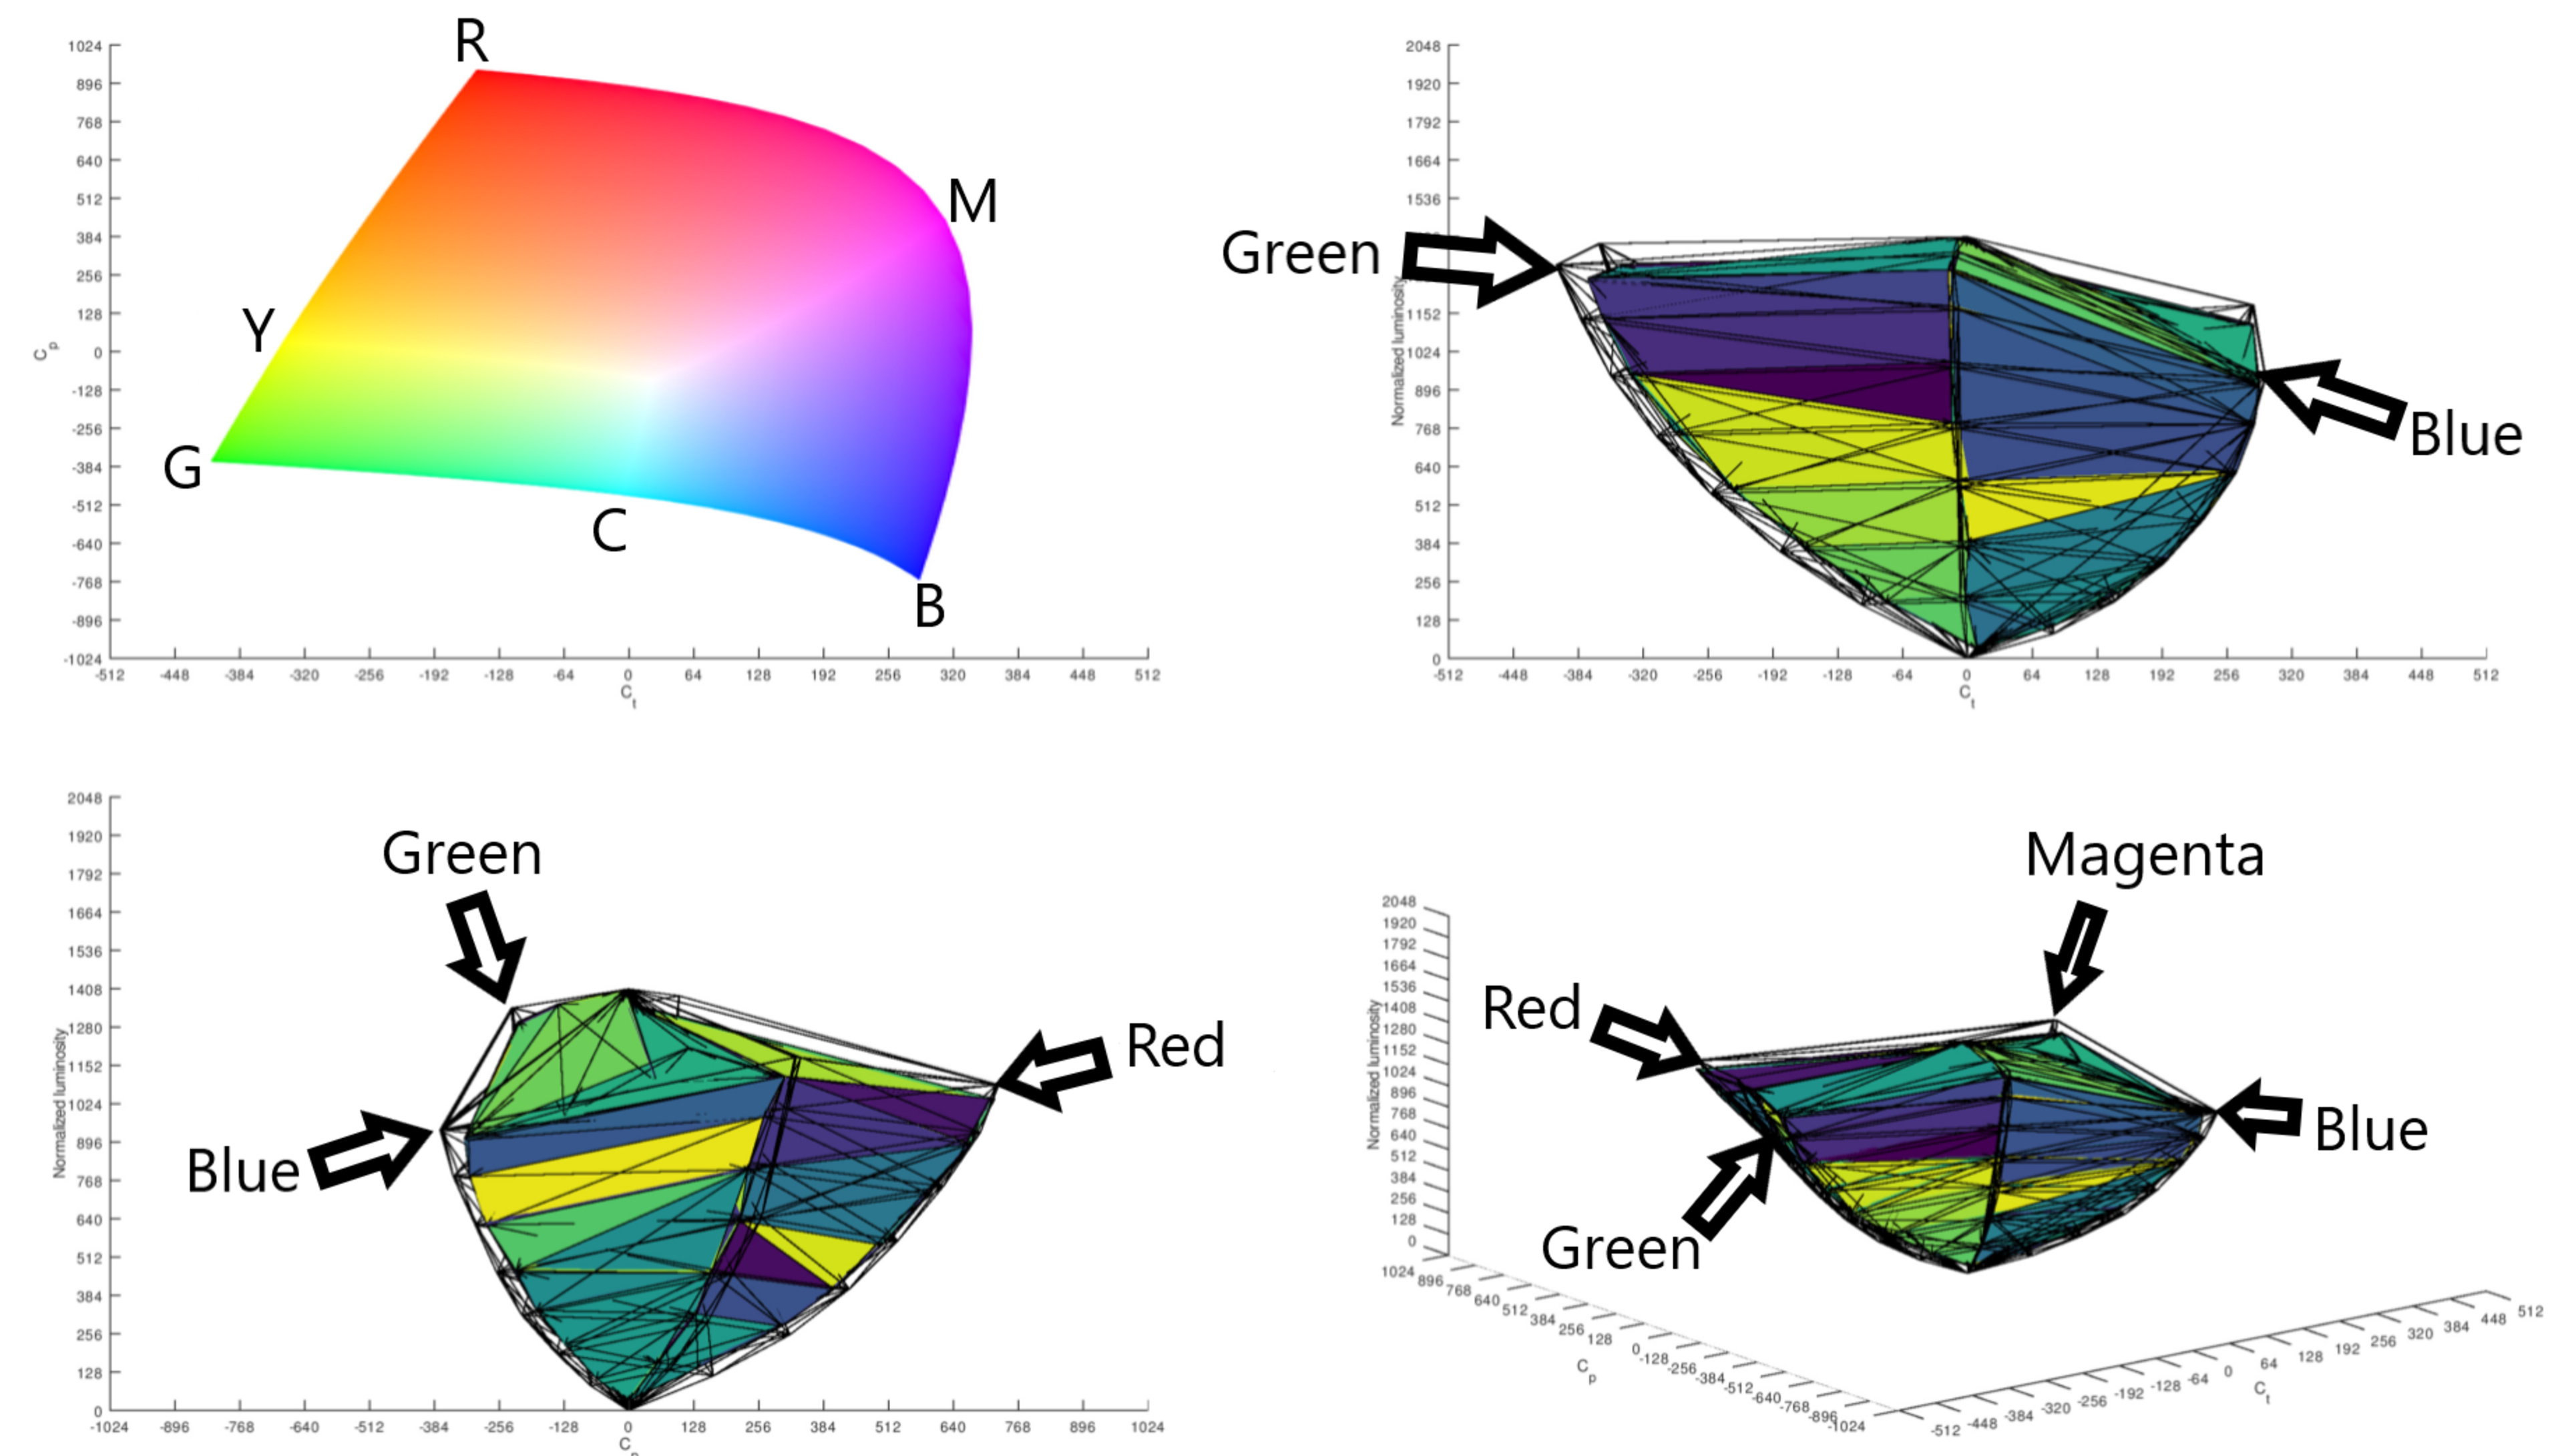
Knowing the color volume as a percentage doesn't tell the whole story of how a monitor performs, though, as it's also important to know which colors it displays at various luminance levels. That's where the color volume graphs, or bubbles, are useful. The bubble is a 3D representation of the measured color volume versus an ideal display, which you can see with the example on the right, and this is included in each review. The top left graph is a top view of the color gamut of the bubble, while the other three graphs are side views of the bubble with the colors identified. The y-axis represents the luminosity, so bright shades are towards the top and dark shades at the bottom, and the x-axis is the range of colors. You can also see that the black lines represent the ideal display, and the measured color volume is the filling inside the bubble in blue, yellow, and green. Ideally, the colored filling occupies the entire target bubble.
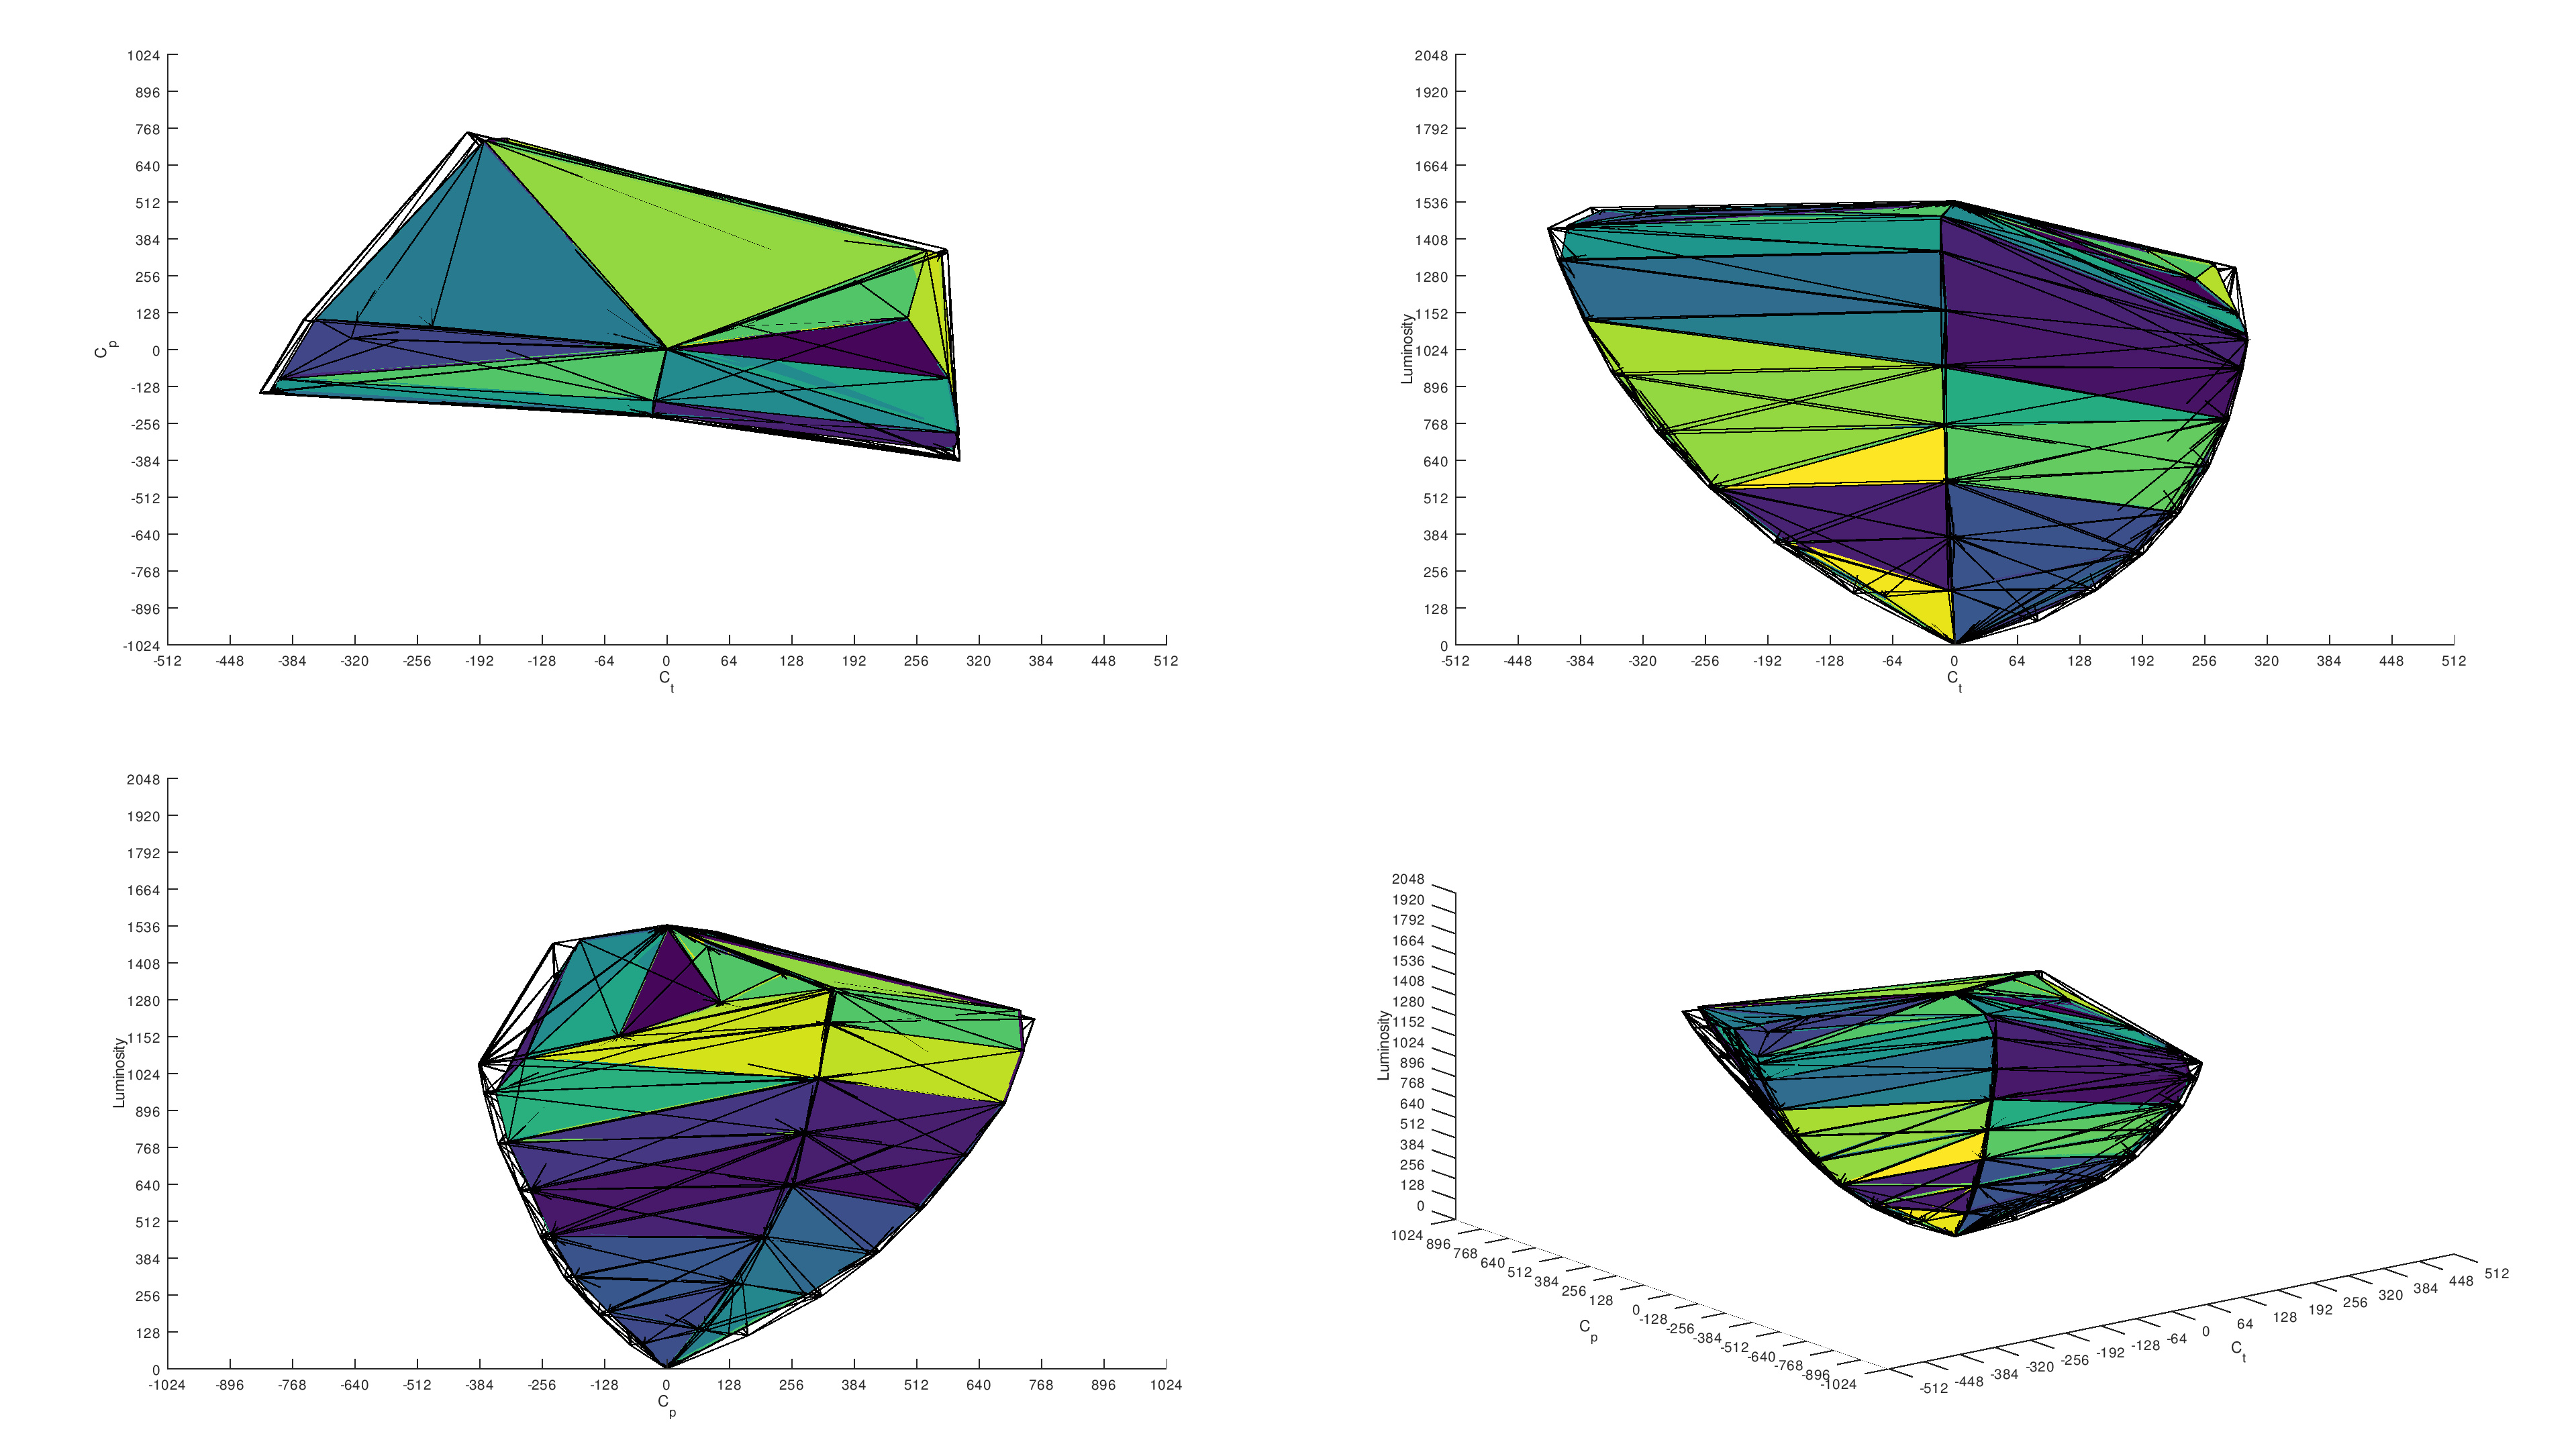
Below are examples of the color volume bubbles from two monitors. The one on the left has near-perfect coverage, and you can see that its color volume bubble fills out the target almost perfectly. This means it displays bright and dark colors very well. That isn't the case with the monitor on the right, as it struggles to display bright colors well and has more muted colors than the monitor on the left.

10,000 cd/m² Rec. 2020 Coverage ICtCp
We repeat the same testing with the Rec. 2020 color space, which is wider than DCI-P3, but less content is available in Rec. 2020 than in DCI-P3. Unlike the DCI-P3 color volume, the Rec. 2020 color volume measurement uses a 10,000 cd/m² target, so the color volume percentage is calculated versus an ideal color volume of a display that reaches a brightness of 10,000 cd/m². As most monitors can't get anywhere near 10,000 cd/m², their color volume in Rec. 2020 seems more limited compared to DCI-P3, but that doesn't mean they're bad, as it's uncommon for monitors to even have more than 50% color volume.
Like in DCI-P3, there are the same color volume bubbles to represent which colors the monitor displays at various luminance levels, and you can read them the same way. Using the same two monitors as in the previous example, you can see that neither monitor can't display bright colors well, which is expected with a 10,000 cd/m² target. That said, you can still see the difference between a good and bad monitor in terms of color volume, as the monitor on the left can display more colors at various luminance levels.


Additional Information
Different Ways Of Measuring Color Volume
The way we measure the color volume is just one of several ways to test it. We only started using the unnormalized targets of 1,000 cd/m² in DCI-P3 and 10,000 cd/m² in Rec. 2020 as of Test Bench 2.0, as we used normalized targets before. With this method, the target luminance is the max brightness of the display, so essentially, the color volume is a percentage of an ideal display that gets as bright as the monitor we're testing. While this is still a good way to measure color volume, using unnormalized targets makes it easier to compare the color volume of different monitors, as they all use the same target luminance. We also measure the color volume in TVs with unnormalized targets.
Color Gamut Vs Color Volume
As mentioned earlier, we test the color volume and color gamut at the same time, and while they're similar, they represent different things. The color volume is the colors a monitor displays at various luminance levels, and the color gamut is the range of colors it displays. Essentially, the color gamut is the colors it displays at a certain luminance level, so it's like a slice of the color volume bubble. We measure the color gamut with a 75% luminance, meaning the gamut is 75% up the y-axis in the color volume graph.
Overall, a good color gamut and color volume help improve the picture quality in HDR, as that means it can display a wide range of colors and make them look vivid.
How To Get The Best Results
A monitor's color volume is inherent to its performance, and there aren't many ways to improve it. Some monitors offer different picture modes that make colors look more vivid and brighter, but it does so at the cost of overall image accuracy, so there's a trade-off for using these modes. Instead, the best way to have a monitor with good color volume is to get one with good color volume.
That said, different factors impact the color volume and even the overall HDR experience, and certain types of monitors generally have better color volume than others. A monitor with high contrast and high brightness can improve the color volume as it helps contribute to bright and dark colors.
Benefits Of Different Panel Types
OLED monitors tend to have the best color volume because they can display dark colors without any issues. QD-OLED monitors, a type of OLED, go a step further by displaying colors as bright as pure white, which is ultimately the goal of any type of display. On the other hand, W-OLED monitors, which are different from QD-OLEDs, can't display bright colors as well, but they still offer the same benefits for dark colors.
There's more variation in performance on LED-backlit monitors, as even the LCD panel type can affect the color volume. However, those with Mini LED backlighting, like the Acer Nitro XV275K P3biipruzx and the Samsung Odyssey Neo G8 S32BG75, offer the best performance as they display darker and brighter colors than LCD monitors with edge-lit LED backlighting. Besides that, monitors with VA panels have a higher contrast and can display dark colors better than IPS or TN panels, which have a low contrast. You can read more about those differences here.
Overall, OLEDs offer the best performance in terms of color volume, but if you can't afford an OLED, a monitor with Mini LED backlighting is the next best option.
Learn about OLED vs LED displays here.
Conclusion
A monitor's HDR color volume defines the range of colors it displays at various luminance levels, which is different from the HDR color gamut because that represents the range of colors at a certain luminance level. Having good color volume helps provide a satisfying HDR experience as it means the monitor can display bright and dark colors well, and some factors contribute to having good color volume, like contrast and brightness. Because of this, certain panel types offer better color volume, particularly QD-OLEDs, as they make colors vivid. We measure the HDR color volume in the DCI-P3 and Rec. 2020 color spaces using unnormalized targets, making it easier to compare the color volume between different monitors, and the volume is calculated as a percentage versus an ideal display.