Our TV Picture Quality Tests
Gray Uniformity
- 80.0% 50% Std. Dev.
- 80.0% 50% DSE
- 20.0% 5% Std. Dev.
- 20.0% 5% DSE
Gray uniformity defines the way a TV can display a single uniform color on the screen. Having a TV with good uniformity is important for watching content with large areas of the same color, like sports, or if you're going to use it as a PC monitor. You may notice uniformity issues when the edges are darker or if the center of the screen looks dirty, known as the dirty screen effect.
We test the TV's uniformity by displaying two different shades of gray. The first shade is meant to represent any color because if there are uniformity issues there, you'll likely notice it with other colors, too. The second shade of gray is close to black; this is meant to show any issues with near-dark scenes, like in movies. We calculate the uniformity using standard deviation.
Test results
When It Matters
Uniformity issues aren't noticeable with most movies and TV shows, but they can be more obvious in other types of content with uniform colors. You can notice it with some shows, news broadcasts, and especially sports. This is because sports broadcasts tend to have large areas of bright colors, such as a hockey rink, basketball court, or football field. These issues are most noticeable with hockey because most of the screen will be white, so you'll see which areas are darker. However, the problems aren't just limited to sports as it can be very distracting if it's really bad with any type of content.
If you're going to use the TV as a PC monitor, it's really important to have good uniformity. This is because you'll often have web pages or documents of the same color open, so you want the entire page to look the same color.
Above, you can see the uniformity on two TVs from the same brand. The one on the right is much worse because there are patchy areas of dark colors, and there's dirty screen effect in the center. The one on the left isn't perfect either as the corners are darker, but it's a lot more uniform than the one on the right.
Our Tests
The test for gray uniformity is fairly straightforward. We display two types of shades of gray on the TV using our recommended settings and take an image with a Nikon D750 camera with an F-stop of 4.0, 1/4 second shutter speed, and ISO of 200. We calculate a standard deviation from the resulting photo.
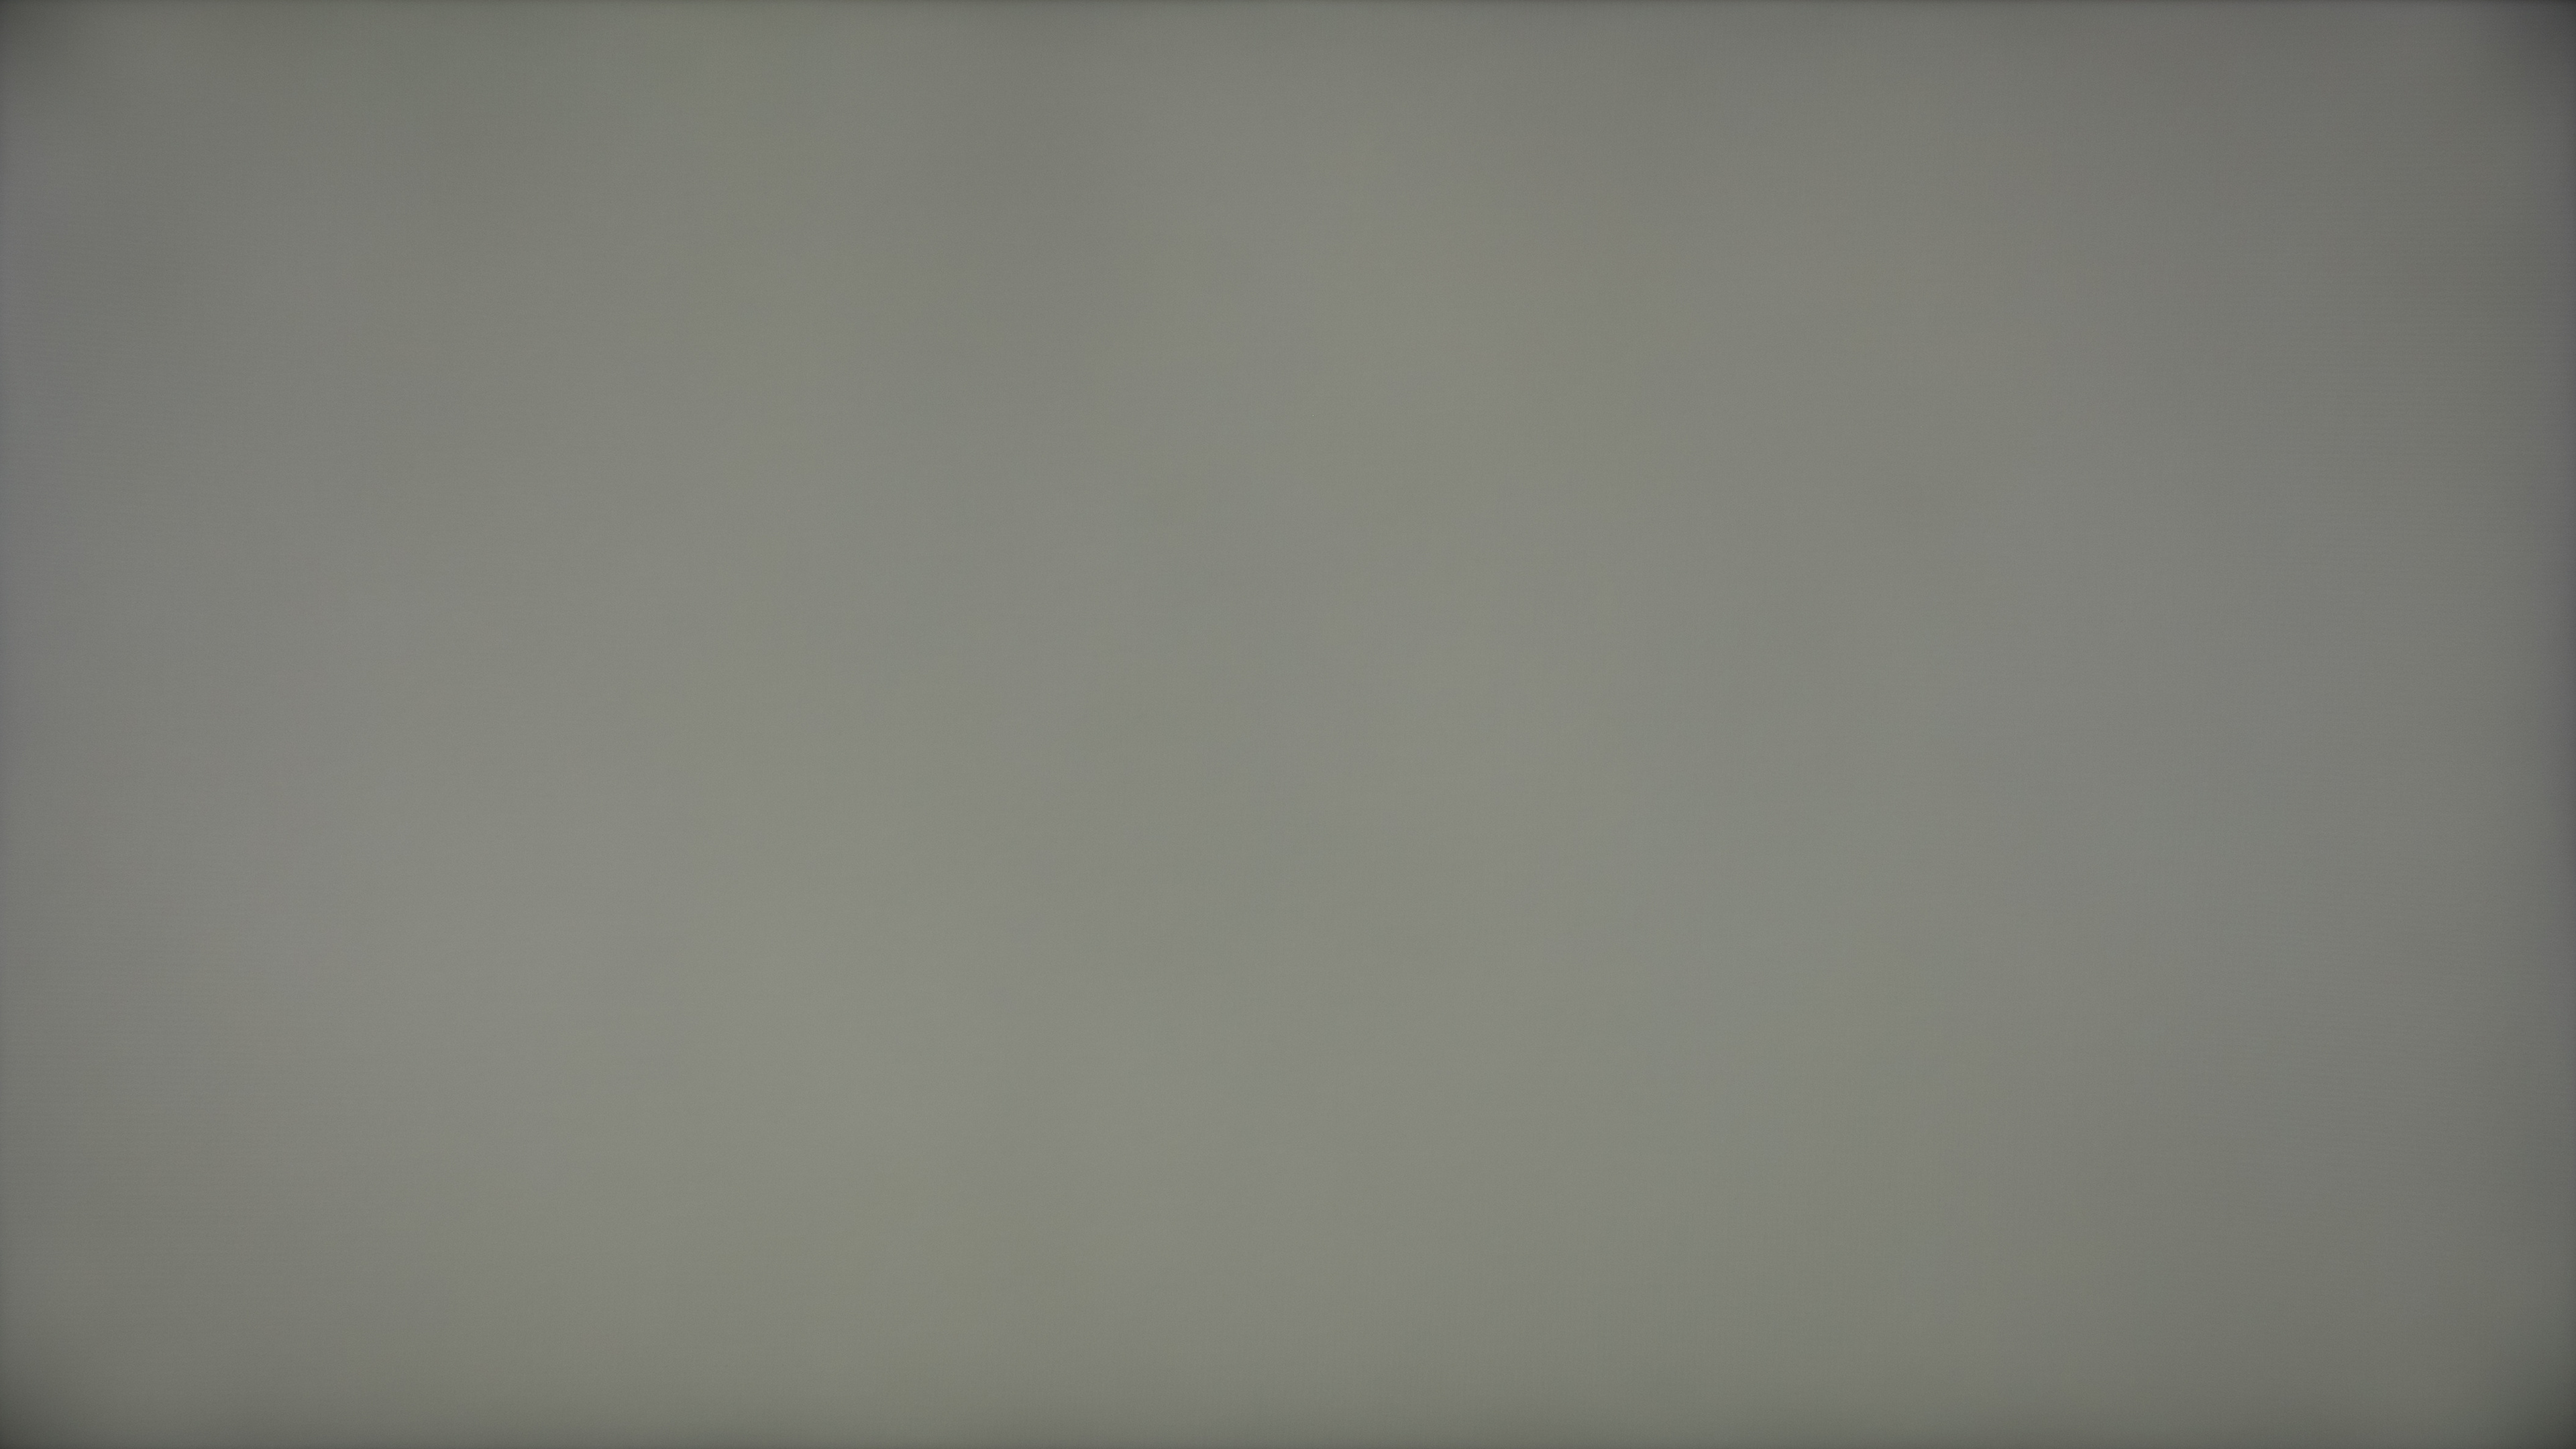
50% Gray Picture
We display the image on the right on the TV and take a photo of it using the settings mentioned above. Of our gray uniformity tests, we consider this the most useful for most people trying to get a sense of what kind of uniformity they can expect from a TV. You can visually see the imperfections this way.
50% gray means it's halfway between pure white (100%) and pure black (0%). Although this is just one color, it should represent other colors well.
50% Standard Deviation
Our 50% standard deviation test measures the evenness of color reproduction across the screen and tells us the average squared difference of the color values of pixels when a full-screen, 50% gray image is displayed. A lower standard deviation is better because it means the TV doesn't deviate much from the original color.
This allows us to score the overall uniformity of the entire screen objectively. It helps compare TVs in absolute terms, but it doesn't tell you much about what you would expect to see on a TV. Because of this, the photo is more helpful.
For this test, we take the photo of the screen from the picture test and process it with a low pass filter (Gaussian blur) to remove noise and artifacts (like moiré) created by the camera. We then calculate the standard deviation of the color values of the pixels using the following formula:

50% Dirty Screen Effect (DSE)
Our 50% dirty screen effect test is similar to the regular standard deviation measurement, but it tests for the deviation at the center of the screen. It's known as the dirty screen effect and is most noticeable during sports or panning shots.
While the full-screen standard deviation test gives us an idea of the uniformity in absolute terms, it doesn’t fully represent the issues people will notice with poor gray uniformity. Compare these two images. On the left is a TV with a higher standard deviation but less DSE. On the right is a TV with a lower standard deviation but higher DSE. You can see the second has more dark patches around the middle, where they are likely to be problematic, and the one on the left has darker edges, which is known as vignetting.
To take this into account, we once again use the photo from our 'Picture' test, only this time we pass it through a high pass filter so that low frequencies are removed from the image. The result is something like the image below and to the left (result multiplied by 50 for purposes of illustration). It isolates all the variations that cause the dirty screen effect but does so for the entire screen.
To test just the middle of the screen, we multiply the values of that picture with those of the image in the below-middle, resulting in the below image to the right.
Finally, we calculate the root of the average of the squared values of the final image. The equation is similar to the standard deviation calculation above but uses ‘0’ instead of the mean.

5% Gray Picture
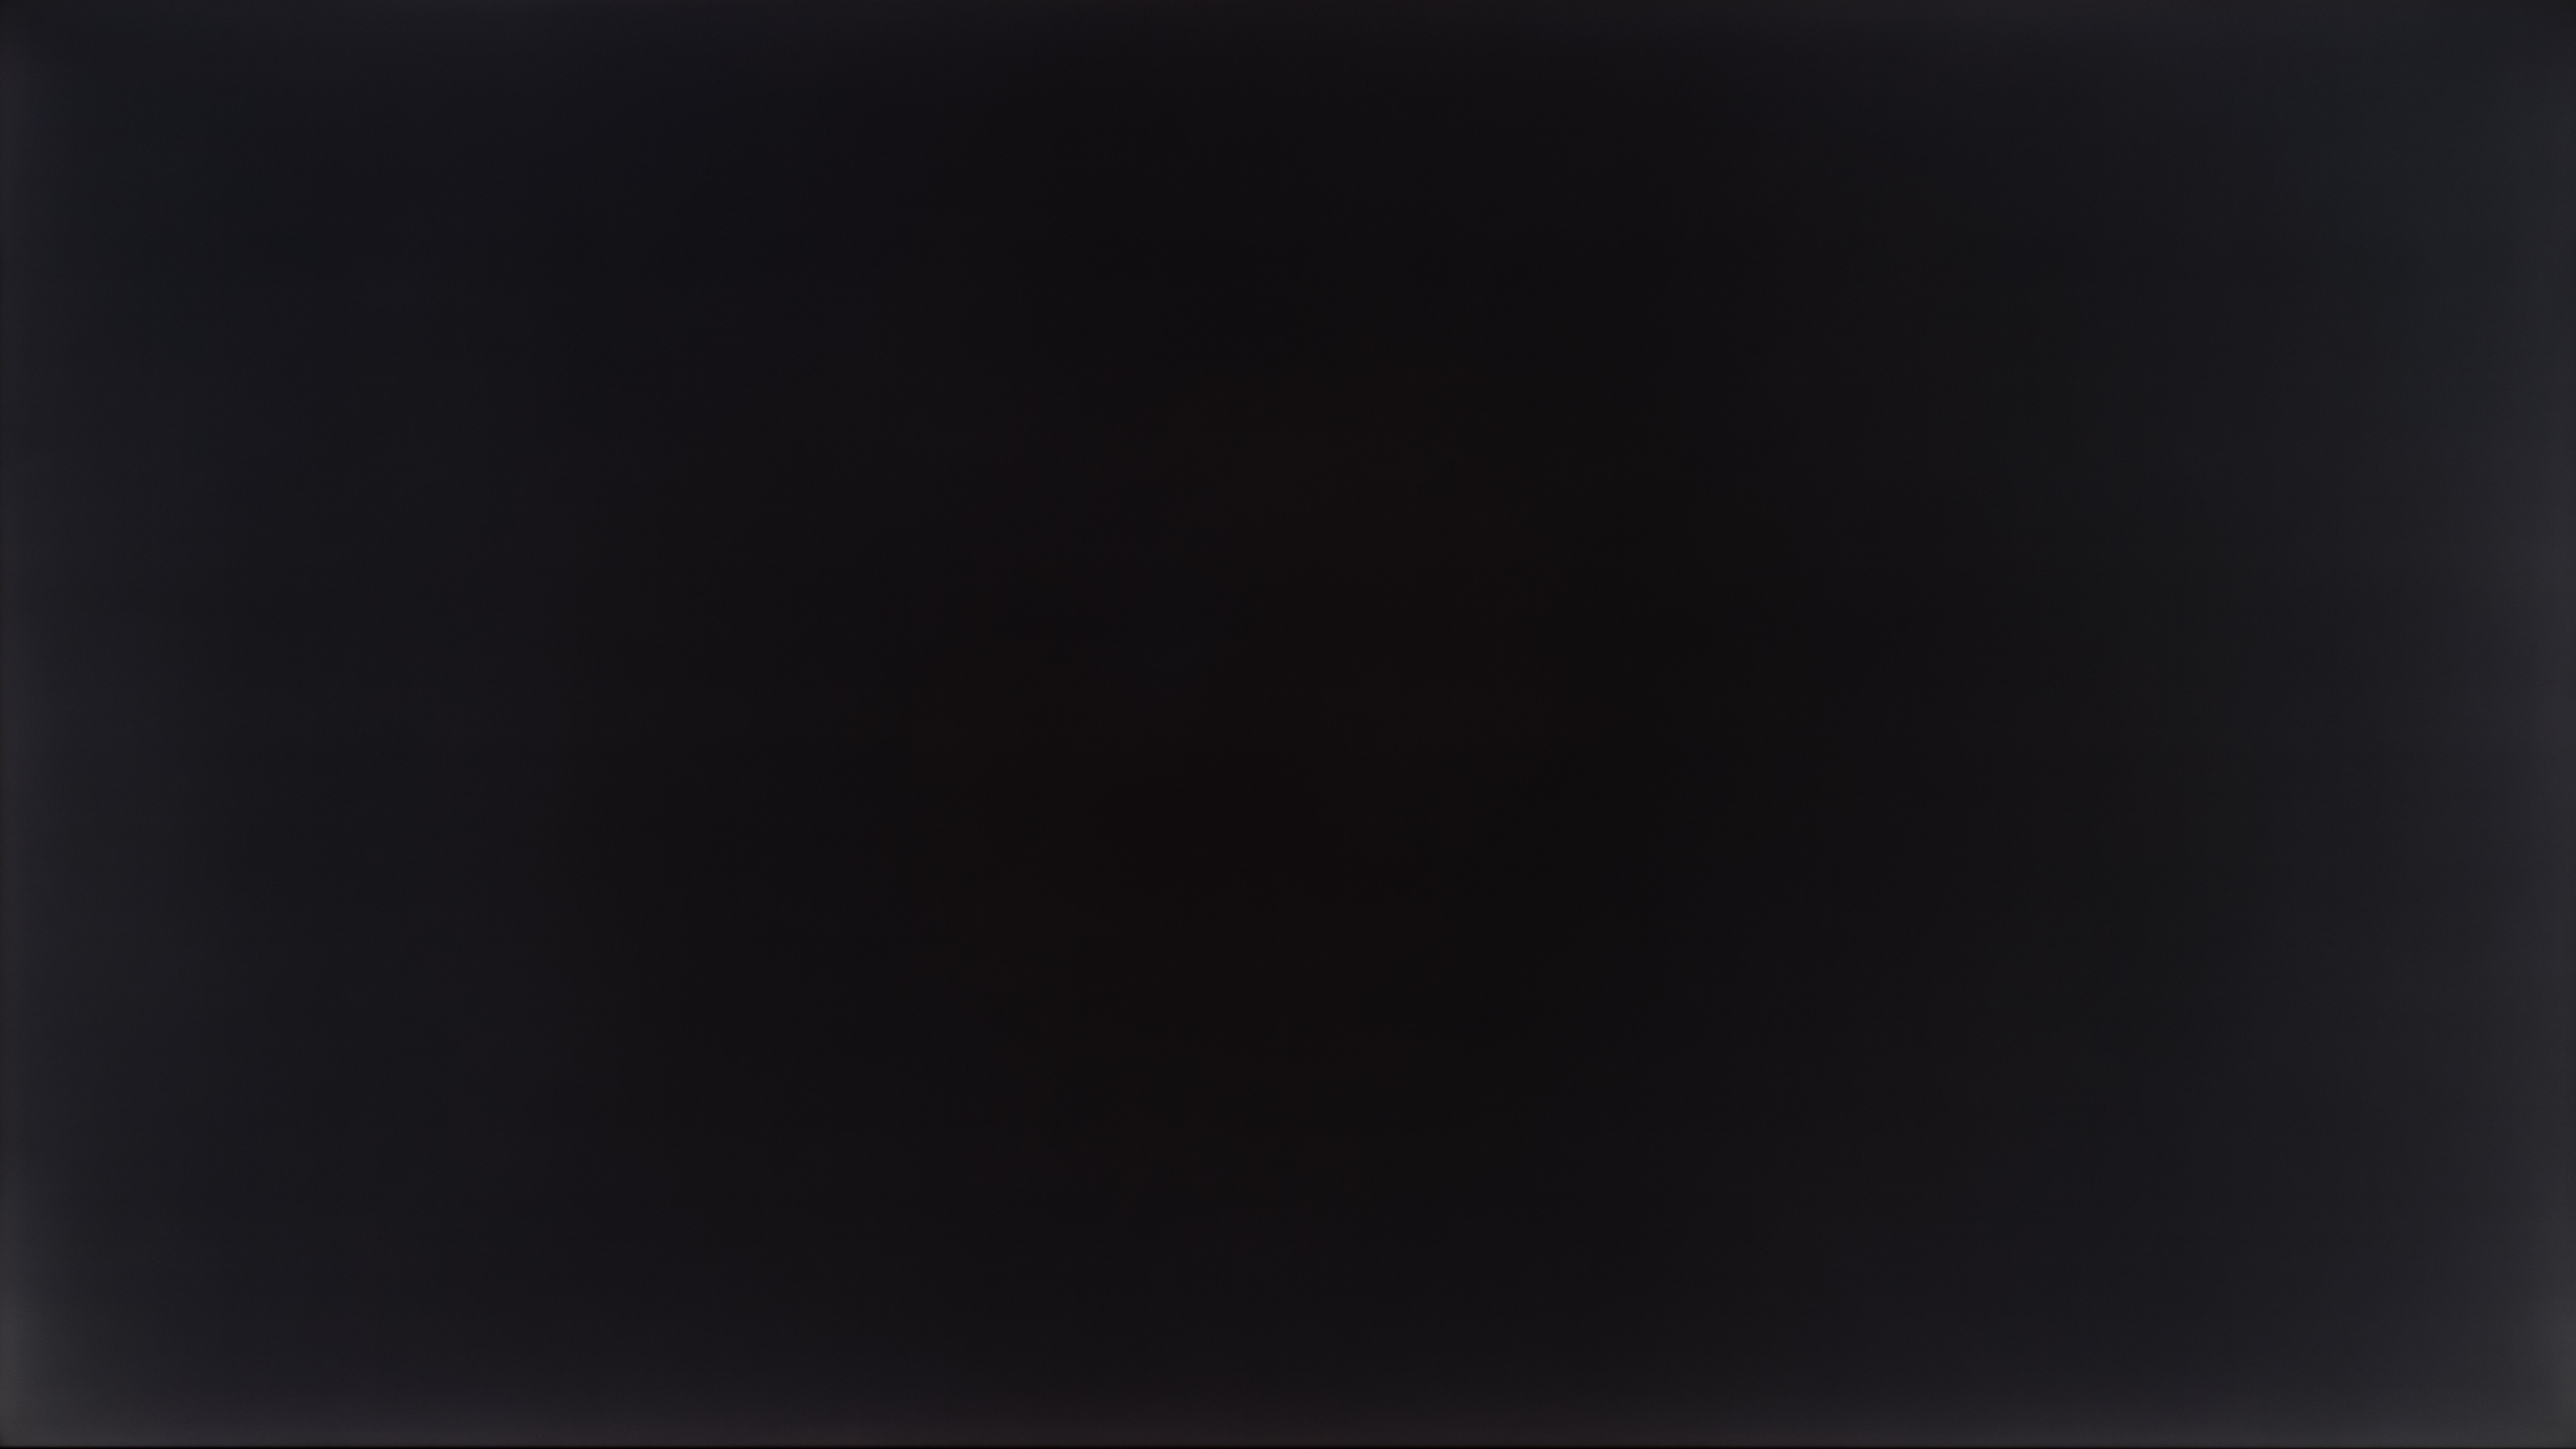
Similar to the 50% gray uniformity picture test, the 5% gray is to show you the quality of the uniformity as you would see it on a TV, but with a darker image. This test is more helpful to visualize the uniformity of TVs using emissive technologies like OLED TVs.
We take a photo with the same camera settings from the 50% gray image, but this time a 5% gray image is displayed on the screen.
5% Standard Deviation
Our 5% standard deviation test use the same procedure as the 50% standard deviation test, but we run it on our 5% gray picture instead. For more information on the procedure, refer to the 50% standard deviation test. Most TVs will have good uniformity with 5% gray, so looking at 50% gray is more helpful.
Once again, a lower standard deviation means less difference is present, and the picture is better. You can see below the difference between two TVs with good and bad 5% uniformity. The one on the left has backlight bleed, making the edges look brighter.
5% Dirty Screen Effect (DSE)
Our 5% dirty screen effect test uses the same formula and procedure as the 50% dirty screen effect test, but we run it on our 5% gray picture instead. For more information on the procedure, refer to the 50% dirty screen effect test.
The 5% dirty screen effect is based on a darker image, so this test is more important for any content that has dark scenes.
Additional Information
Causes of gray uniformity issues
With LED-backlit LCD TVs, gray uniformity issues are caused by a couple of factors. LCD panels are pretty sensitive to pressure, so extra pressure caused by misalignment of the TV's components or by mishandling of the panel during manufacturing or shipping could lead to defects appearing. Also, too much pressure can affect the backlight and how much light it diffuses, which causes some areas to be darker. Size may also have an effect because it's harder to keep a larger screen uniform, but since we only test one size of each TV, we can't draw any conclusions about this.
With OLED TVs, the gray uniformity issues are more related to imperfections in the panel itself, independent of pressure-related problems.
variance between models
Gray uniformity is unique to each individual panel. This means that no two TVs, even of the same model, will have matching uniformity. Generally, though, higher-end TVs should have better gray uniformity, as the manufacturers will have stricter standards for the panels used. Higher-end LED-backlit TVs tend to use either Mini LED or direct LED backlighting, generally better for uniformity than edge-lit TVs.
gray uniformity on OLEDs vs LEDs
LED and OLED TVs use different technologies to display an image. While LED TVs are really LCD TVs backlit by LED backlights, OLEDs don't have any backlighting and instead turn each pixel on and off. As such, they perform differently when it comes to uniformity. For the most part, OLEDs tend to have better uniformity, and there are rarely any issues. LED TVs can suffer more from uniformity issues, especially if their backlight is edge-lit and not direct LED. However, we can't confidently say one TV will have better uniformity than another just because of the backlight or panel type.
Early OLEDs had issues when displaying 5% gray images. There would often be faint horizontal and vertical lines that you could notice in near-dark scenes. It's rare to see that issue on modern OLEDs, but it's still possible. Below you can see the LG B8 from 2018, which has very noticeable lines, and the LG B1 from 2021, which doesn't.
Why is there a difference between TVs and monitors?
We test gray uniformity on monitors the same way as on TVs. While you can't compare the final scores, you can still compare the standard deviations and the pictures. Generally speaking, there isn't a big difference in the total standard deviation with the 50% gray image on LED-backlit TVs and monitors, as they can each suffer from backlight bleed along the edges. The big difference here between monitors and TVs is the amount of dirty screen effect in the center. Monitors rarely have that issue, and only four monitors have worse DSE than the best TV we've tested.
This is expected from monitors because you need to have a uniform screen when browsing the web with large areas of solid colors. Monitors are also smaller, so it's easier for the backlight to provide a uniform screen.
Black uniformity
Although it may seem like gray and black uniformity are the same, they test for different things. The gray uniformity test is meant to see how well the TV displays a single uniform color, but black uniformity is to see if there's blooming around bright objects. You may see some issues that are the same in both, like vignetting, but the tests aren't exactly related.
Learn about black uniformity
Getting The Best Results
Unfortunately, gray uniformity is entirely down to the panel you get. There isn't much you can do to improve gray uniformity as it's down to panel lottery. You can try massaging the screen with a soft cloth to relieve the pressure, but this is a delicate technique, so it may be best to not do it if you're unsure of yourself.
Related Settings & Other Notes
- There are no settings to adjust.
Conclusion
Gray uniformity refers to how well a TV display a single, solid color across the screen. It matters for content containing a large area of a single color, like with sports, where bad gray uniformity affects the appearance of playing surfaces. For each TV, we take two photos of different shades of gray, calculate the standard deviation of the color values of the pixels, and then calculate the amount of dirty screen effect that's present in each picture.
Unfortunately, there aren't many steps that you can take to improve gray uniformity – it’s entirely down to the panel you get. You can try massaging the screen, but that's hard to do. If you find yourself with uniformity that you can't live with, you should exchange your TV for a different unit, or even a different model.


