Mount to Coast C1  Running Shoe Review

Reviewed Jun 17, 2026 at 10:29am
Tested using Methodology v0.12 
Mount to Coast C1

Track

7.5
Half/Full Marathon Racing 
6.6
5K/10K Racing 
8.0
Long Run 
8.3
Daily Training 
7.0
Energy Return 
7.2
Responsiveness 
8.4
Cushioning 
8.2
Stability 

Track

 0

We're updating our testing methodology to fix how we measure midsole firmness, and we'll publish our full review of this shoe soon. All scores below should be considered tentative.

Our Verdict

7.5
Half/Full Marathon Racing 
6.6
5K/10K Racing 
8.0
Long Run 
8.3
Daily Training 
7.0
Energy Return 
7.2
Responsiveness 
8.4
Cushioning 
8.2
Stability 
9.6
True To Size 
  • 7.5
    Half/Full Marathon Racing
  • 6.6
    5K/10K Racing
  • 8.0
    Long Run
  • 8.3
    Daily Training

  • Performance Usages

  • 7.0
    Energy Return
  • 7.2
    Responsiveness
  • 8.4
    Cushioning
  • 8.2
    Stability
  • 9.6
    True To Size
  • Changelog

    1.  Updated Jun 17, 2026: We've converted this review to Test Bench 0.12, which fixes how we measure firmness, a component of the Stability and 5K/10K Racing usages. There may be inconsistencies between the text and the scores for these usages, but the scores should still be considered valid. We've also brought back the Energy Return score and added two new usages: Daily Training and Long Run. To read more about the changes, see the changelog.
    2.  Updated Jun 17, 2026: Review published.
    3.  Updated Jun 16, 2026: Early access published.
    4.  Updated May 12, 2026: Our testers have started testing this product.
    How We Test Running Shoes
    How We Test Running Shoes

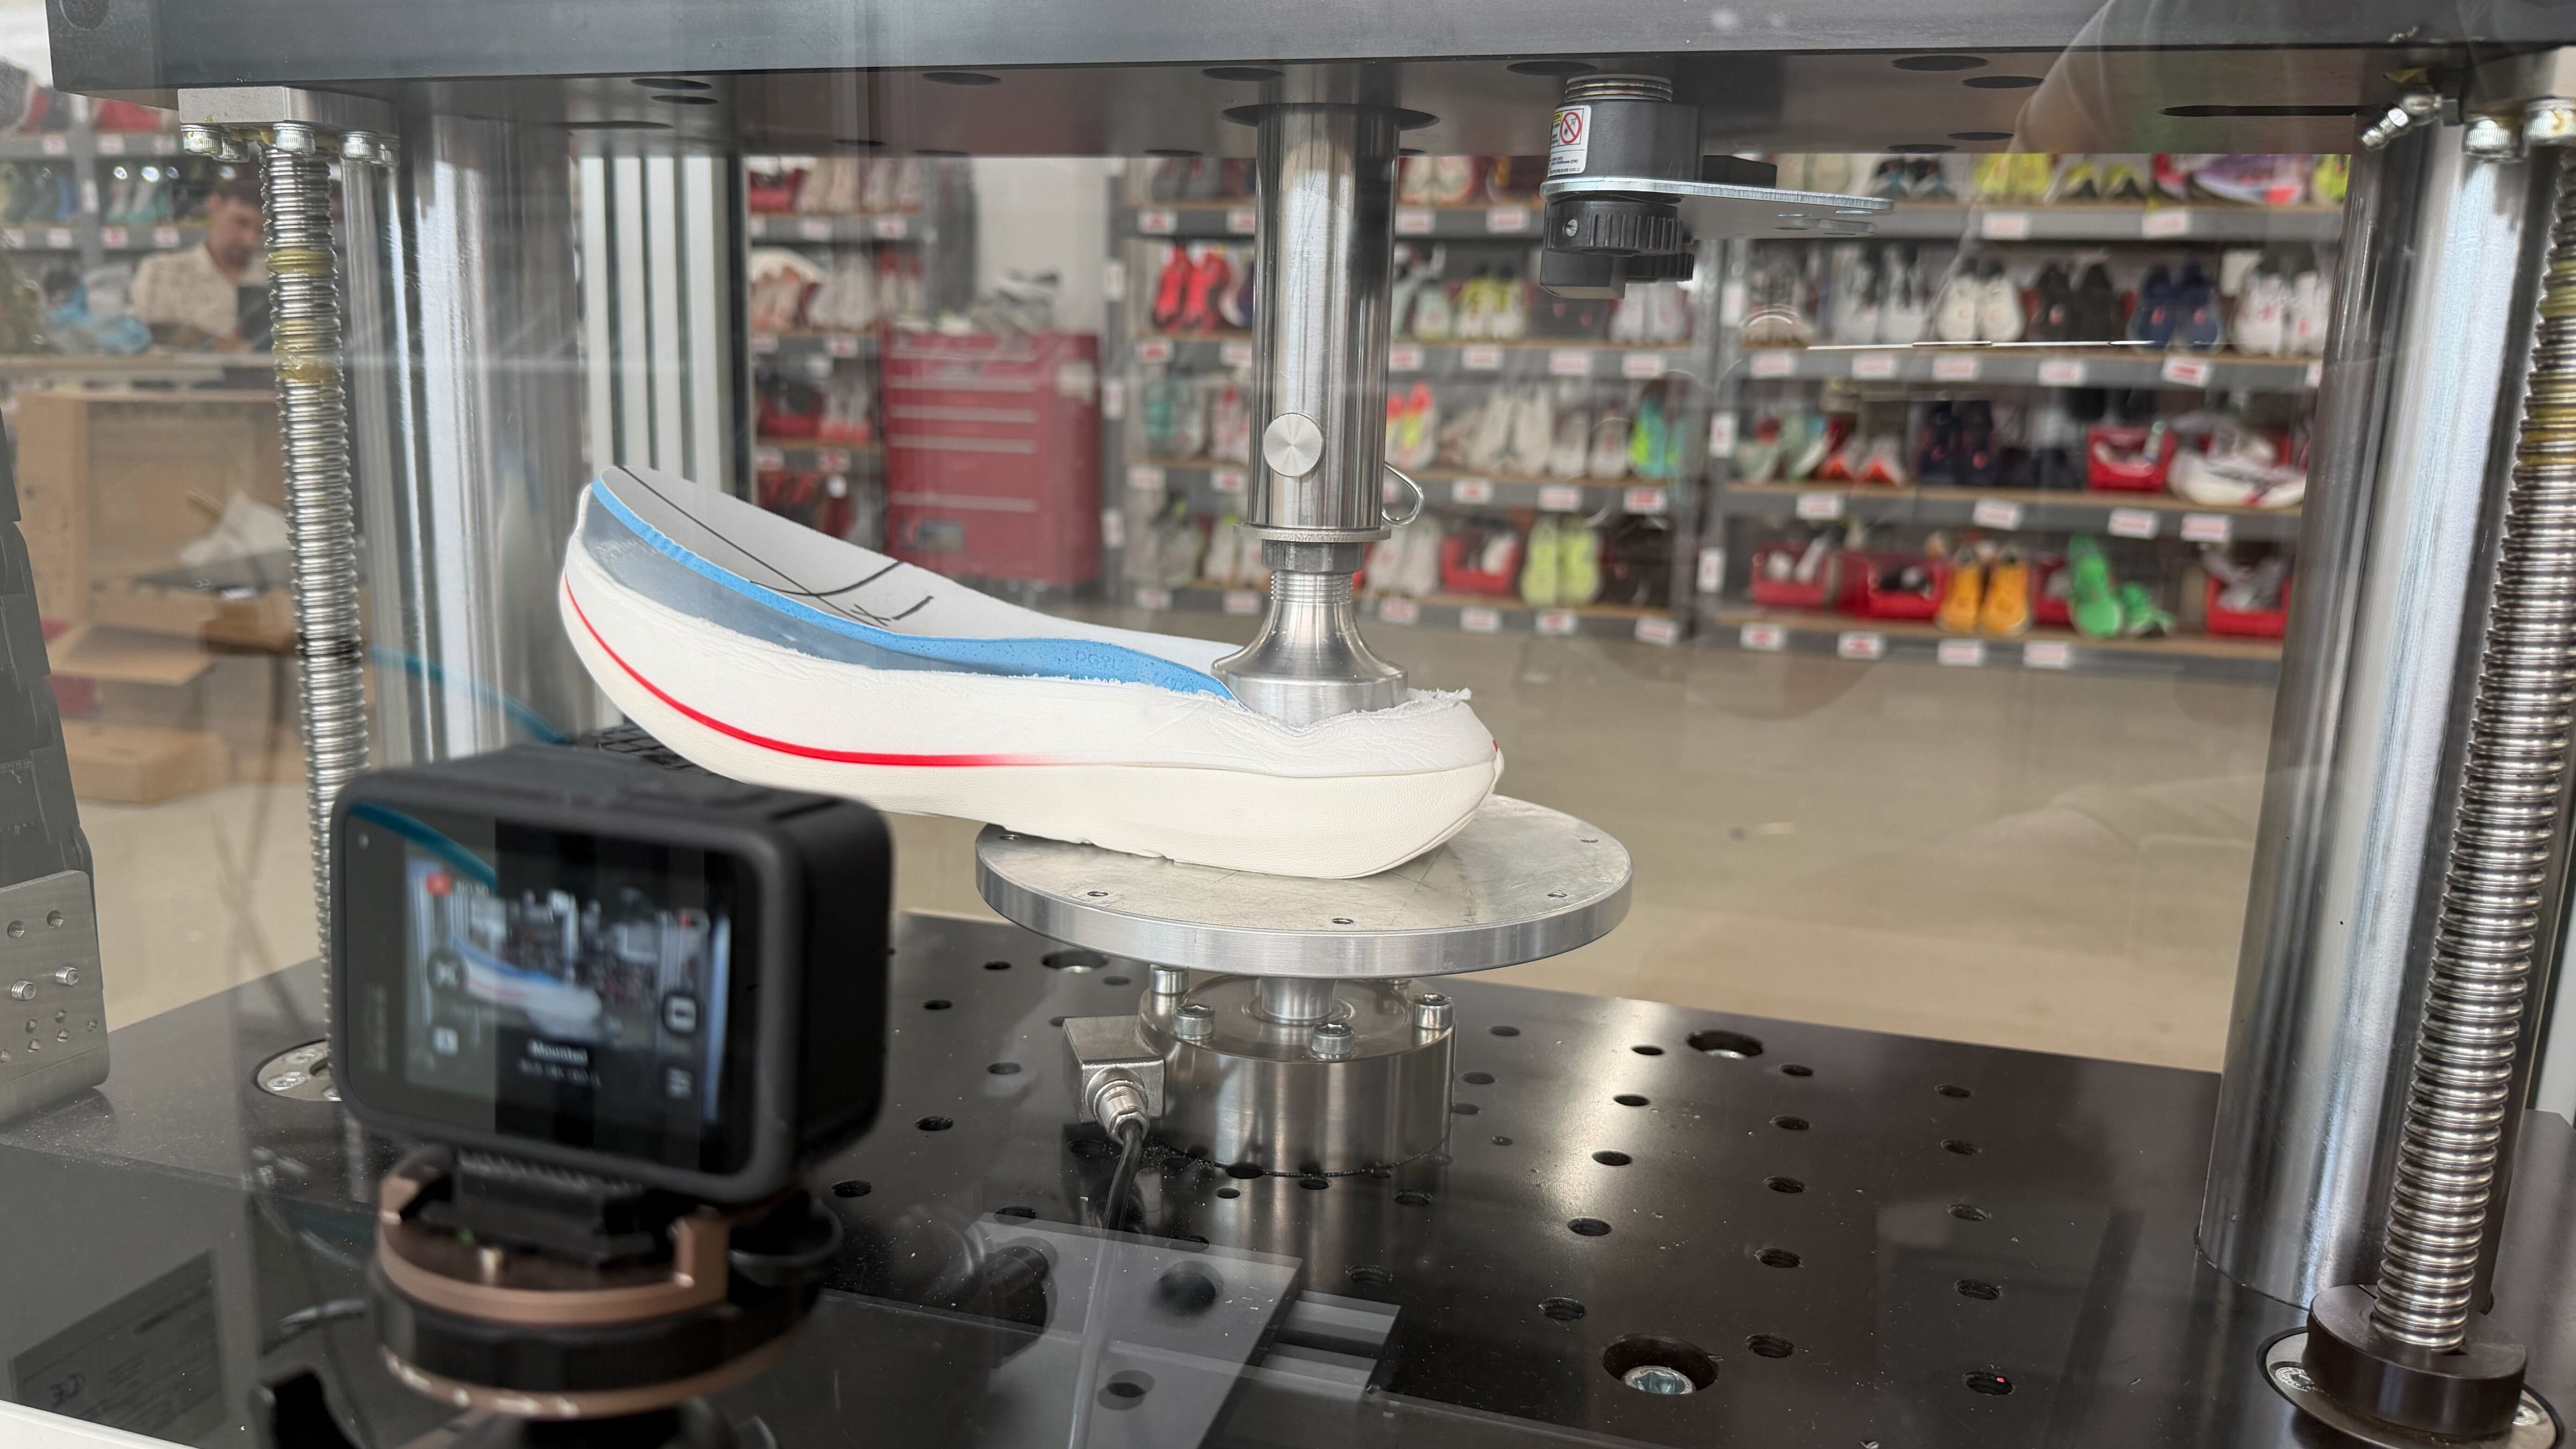
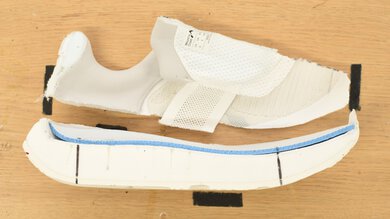
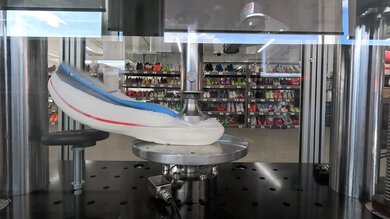
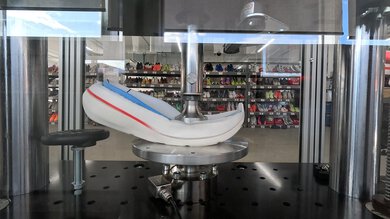
    We buy and test running shoes with a very data-oriented approach. While we're just getting started, our methodology already has dozens of tests to help you make the right purchasing decision for your needs. Not only do we use high-end equipment to gather objective data, but we also order multiple sizes of the same shoes so team members can log in miles. This real-world testing is conducted at various paces and conditions, across different types of workouts, to cover all the bases. This allows us to verify our results and ensure they align with what you might feel with a specific pair.
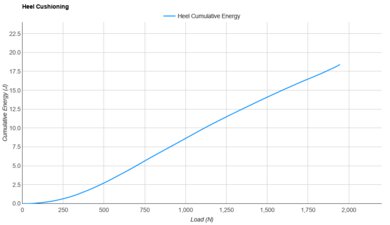
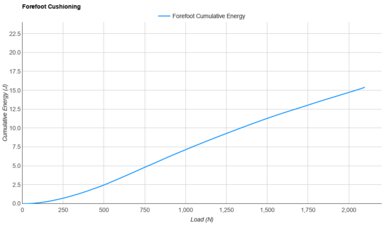
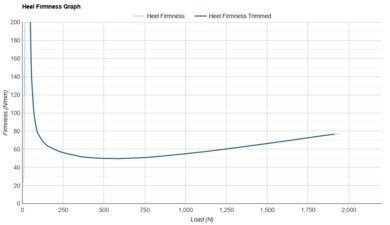
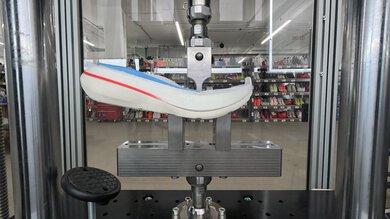
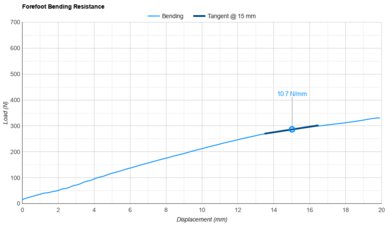
    Test Results

    perceptual testing image
    Sort:
    RATINGS
    Category:
    All
    Design
    5.7
    Weight
    Weight
    268.2 g (9.46 oz)
    Stack Heights
    Heel Stack Height
    41.8 mm
    Forefoot Stack Height
    33.9 mm
    Heel-To-Toe Drop
    7.9 mm
    Advertised Heel-To-Toe Drop
    6.0 mm
    External Shape
    Outsole Heel Width
    96 mm (3.8")
    Outsole Arch Width
    82 mm (3.2")
    Outsole Forefoot Width
    121 mm (4.8")
    Heel Width-To-Stack Ratio
    2.30
    Forefoot Width-To-Stack Ratio
    3.56
    Internal Shape
    Internal Length
    281 mm (11.1")
    Internal Heel Width
    70 mm (2.8")
    Internal Forefoot Width
    98 mm (3.9")
    Wide Sizing Available
    No
    9.0
    Forefoot Fit: Width
    Ball-Of-Foot TTS Deviation
    4.4 mm (0.171")
    Toe TTS Deviation
    -0.3 mm (-0.012")
    8.0
    Forefoot Fit: Height
    Toe TTS Deviation
    -2.4 mm (-0.096")
    9.9
    Arch Fit: Width
    Arch Width TTS Deviation
    1.8 mm (0.070")
    10
    Length Fit
    8.4
    Heel Rocker Geometry
    Heel Spring
    30 mm (1.2")
    Heel Apex Position
    19.0%
    Heel Rocker Angle
    28.2°
    7.2
    Forefoot Rocker Geometry
    Toe Spring
    49 mm (1.9")
    Toe Apex Position
    62.7%
    Forefoot Rocker Angle
    24.0°
    Other Features
    Tongue Gusset Type
    Semi-gusseted
    Plate
    None
    Performance
    6.6
    Heel Compression Energy Return
    Heel Energy Return
    74.7%
    7.2
    Forefoot Compression Energy Return
    Forefoot Energy Return
    76.7%
    8.0
    Heel Cushioning
    Energy Absorbed At 550N
    3.27 J
    Energy Absorbed At 1100N
    9.82 J
    Energy Absorbed At 1900N
    17.91 J
    8.8
    Forefoot Cushioning
    Energy Absorbed At 800N
    5.27 J
    Energy Absorbed At 1300N
    9.70 J
    Energy Absorbed At 2050N
    15.05 J
    8.3
    Heel Firmness
    Firmness At 550N
    49.7 N/mm
    Firmness At 1100N
    57.0 N/mm
    Firmness At 1900N
    76.3 N/mm
    7.3
    Forefoot Firmness
    Firmness At 800N
    56.1 N/mm
    Firmness At 1300N
    69.9 N/mm
    Firmness At 2050N
    94 N/mm
    8.3
    Forefoot Long Run Cushioning
    Energy Absorbed At 10km
    9.21 J
    Energy Absorbed At 20km
    9.07 J
    Energy Absorbed At 30km
    8.99 J
    Energy Absorbed At 40km
    8.94 J
    7.8
    Rocker Stiffness
    Force To Flatten The Rocker
    111 N
    7.2
    Forefoot Bending Energy Return
    Forefoot Bending Energy Return
    65.9%
    7.0
    Forefoot Bending Stiffness
    Forefoot Bending Stiffness
    10.7 N/mm
    Forefoot Bending Force
    286 N