This test replaces our Imaging test (Test Bench 0.9-1.8), with the exception of Group Delay, which now has its own test box.
Stereo mismatch is a crucial component of the headphones-listening experience that helps us assess the performance of drivers in relation to each other. When a pair of headphones' drivers are well-matched, this results in a more even stereo image with fewer gaps. You can place an enemy's footsteps on the right side of your screen when you're gaming, or hear where each of the band's instruments is on stage. Conversely, if headphones' drivers are mismatched, it can be harder to accurately distinguish where sounds are in space. Audio cues may be skewed to one side, and you may even feel 'listening fatigue' after listening for some time.
All in all, stereo mismatch is an important determinant in the localization of spatial cues such as instruments, sound effects, or voices inherent to your audio content. It also controls the transparency and stereo balance of objects in your mixes. Unlike soundstage, which determines the space and environment of sound as it's 'created' by the headphones, stereo matching affects the 'reproduction' of audio cues.
Our Stereo Mismatch test evaluates Weighted Phase Mismatch, Weighted Amplitude Mismatch, and Weighted Frequency Mismatch.
Test results
When It Matters
Stereo mismatch is mostly important for studio work and gamers since the accurate placement and localization of objects (voice, instruments, or video game effects like footsteps) in the stereo field is crucial. Some aspects are hard for the average listener to notice, meaning well-matched drivers may not be as critical for everyone. Headphones with very poor stereo mismatch would be rather unpleasant to listen to, even for usages other than gaming and professional audio applications. For example, over-ears with a poor stereo balance (with a left-heavy image, for example) can have a noticeably negative effect on your listening experience, even if you're listening to a podcast.
Stereo mismatch can also be a measure of quality control and tolerance margins between drivers. For example, it's harder to manufacture headphones with planar magnetic transducers than more common dynamic driver headphones. This complex driver design can make it harder to match the L/R drivers, and as a result, there may be slight errors in phase response or small shifts in the stereo image. Another factor is how the diaphragms are positioned concerning your auditory canal. Some manufacturers place their diaphragms so that they're more forward-facing to replicate a speaker-like listening experience rather than playing directly into your auditory canal.
We don't test mono headsets for stereo mismatch. Mono headsets, by design, can't produce stereo sound.
How It Works
The slight differences in time and amplitude/intensity between the two channels of stereo audio are responsible for creating the stereo image (also known as ITDs and IIDs). If an individual's voice is intended to be perceived as coming from a specific location to the left side, the left channel's signal should arrive a specific amount sooner and louder compared to the right channel's signal. This way, the brain will localize the speech to be coming from the left side.
Headphones with well-matched drivers don't tamper with these inter-channel time and amplitude differences inherent to the audio content since they affect the tightness of bass and the transparency of treble reproduction (Group Delay). Instead, headphones reproduce these differences faithfully (driver-matching), resulting in an accurate placement and localization of objects in the stereo image.
Our Tests
As part of Headphones Test Bench 2.0, we've introduced Stereo Mismatch as a test and Performance Usage that encompasses some of the tests previously grouped under 'Imaging.' Our performance usages can give you immediate insight into headphones' acoustic properties, and driver matching is a key part of this.
Weighted Phase Mismatch
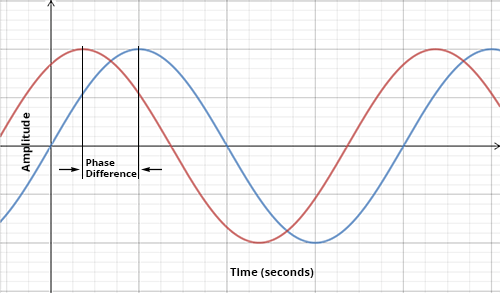
This test measures the amount of difference between the left and right driver's phase response. If you're not familiar with phase, we'll need to go back to the basics of sound. One way of representing sound is by using sinusoidal waves. The height of a wave tells us its amplitude (or loudness), while the length of the wave indicates time. Since sound waves have a repetitive form, we want to focus on a wave's cycle or wavelength.
Phase is the location of a point within a repetitive sound's wave cycle, which we can express in angles, starting from 0° until 360°. For example, if we're looking at max amplitude, we want to look at phase at 90°, as this is the highest point within the sound wave's cycle. However, this on its own doesn't tell us much. Phase is most useful when we can compare the differences in phase between more than one signal.

Stereo headphones use a left and right driver to produce coherent sound as our brains process both signals simultaneously. Assuming you're using a consistent tone, each time the left driver's sound wave reaches its peak amplitude at 90°, the right driver's sound wave should also reach its peak amplitude at 90°. When both waves are matched in phase, their amplitude increases. In headphones, a well-matched phase response indicates a stable stereo image. However, a bad mismatch in phase response can point to inaccuracies in the stereo image reproduction at certain frequencies. At worst, it can push objects to the sides and leave a hole in the middle of the stereo image.

Our graphs reflect when you'll hear phase mismatch in different frequencies. When the response crosses above the audibility threshold, the mismatch may be audible. For our phase mismatch calculation, we calculate the standard error of one channel phase response against the other, but we've implemented a weighting filter based on the research done on the audibility threshold of phase mismatch on headphones at different frequencies to make our results more perceptually relevant. Since the research was limited to the 63Hz-8kHz range, we extrapolated the results for the sub-bass and high-treble regions. Below is our current audibility threshold for headphone phase mismatch in degrees.

That said, the amount of deviation from 0° and the frequency range of the peak can impact whether or not you hear the mismatch. For example, the Audeze MM-100 have a peak at just under 17kHz, or in the high-treble range. However, this can be very hard to hear, especially with real-life content. This is because the higher the frequency, the harder it is to sync each wave cycle as the degree between them becomes smaller and smaller. It's also harder for us to detect these mismatches with our ears, and we lose sensitivity to this range as we age.

This isn't a design test, but since it's essentially a driver-matching test, it could also be considered a marker for manufacturing tolerance and quality control.
Weighted Amplitude Mismatch
Weighted amplitude mismatch assesses a model's left and right driver's balance with amplitude or volume. When headphone drivers are matched in amplitude, they can reproduce objects in the intended location within your mix. Conversely, high amplitude mismatch can create unwanted shifts in the stereo image and potentially lose or exaggerate details. For example, if a pair of in-ears have 3dB of amplitude mismatch favoring the left channel, the stereo image's center (and the objects within your mix) will shift to the left.
This isn't a design test, but since it's essentially a driver-matching test, it could also be considered a marker for manufacturing tolerance and quality control.
Our sound graphs are level-matched at 90dB SPL and 100dB SPL so that test results are consistent and comparable across reviews. However, these graphs don't show the actual measured amplitude mismatch between the headphones' L/R drivers. Instead, we report this measurement in 'Weighted Amplitude Mismatch.'
Weighted Frequency Mismatch
This test assesses the amount of difference or standard deviation between the frequency response produced separately by a unit's left and right drivers. This mismatch results in an uneven stereo image where some frequencies are skewed to the left or right instead of being centered. Frequency response mismatch is similar to amplitude response mismatch, as in they look for the same kind of error, but frequency mismatch does it per frequency, as opposed to amplitude mismatch, which does it per channel.

This isn't a design test. Since this is essentially a driver matching test, however, it could be considered a marker for manufacturing tolerance and quality control. For example, the TRUTHEAR HEXA feature exceptional frequency matching between the left and right drivers, which contributes to an even and symmetrical stereo image.
What Isn't Included
- Head tracking
- Surround capabilities (whether virtual or true surround can accurately place objects in the image)
If you feel something is missing that should be included, please let us know in the comments or send us an email at feedback@rtings.com.
Conclusion
Whether you're trying to place an enemy's footsteps in gameplay or distinguish the location of instruments in your mixes, drivers that are well-matched in phase, frequency, and amplitude will make all the difference. These three elements reflect different elements of the stereo image as it's recreated by your headphones' left and right drivers. While some driver mismatch can be hard to hear with real-life content, its presence can also point to larger issues in the headphones, like tolerance margins and quality control.


