The quest for one ideal frequency response curve for headphones has been the subject of many heated debates among enthusiasts. However, there is a consensus among research circles: a preference-based approach appears to be the path forward in finding that perfect curve. Some may think that with the large amount of research data from Harman and others, frequency response is a solved problem. However, as other measurement methods and standards enter the headphone testing ecosystem, we must revise these preference curves as they can't be directly translated.
What comes to mind when you think of preference-based target curves for headphones? Maybe you're thinking about how a target curve is created or whose preference it represents. These questions are a great place to start. To answer them, we'll need to go back to the fundamentals: double-blind listening tests!
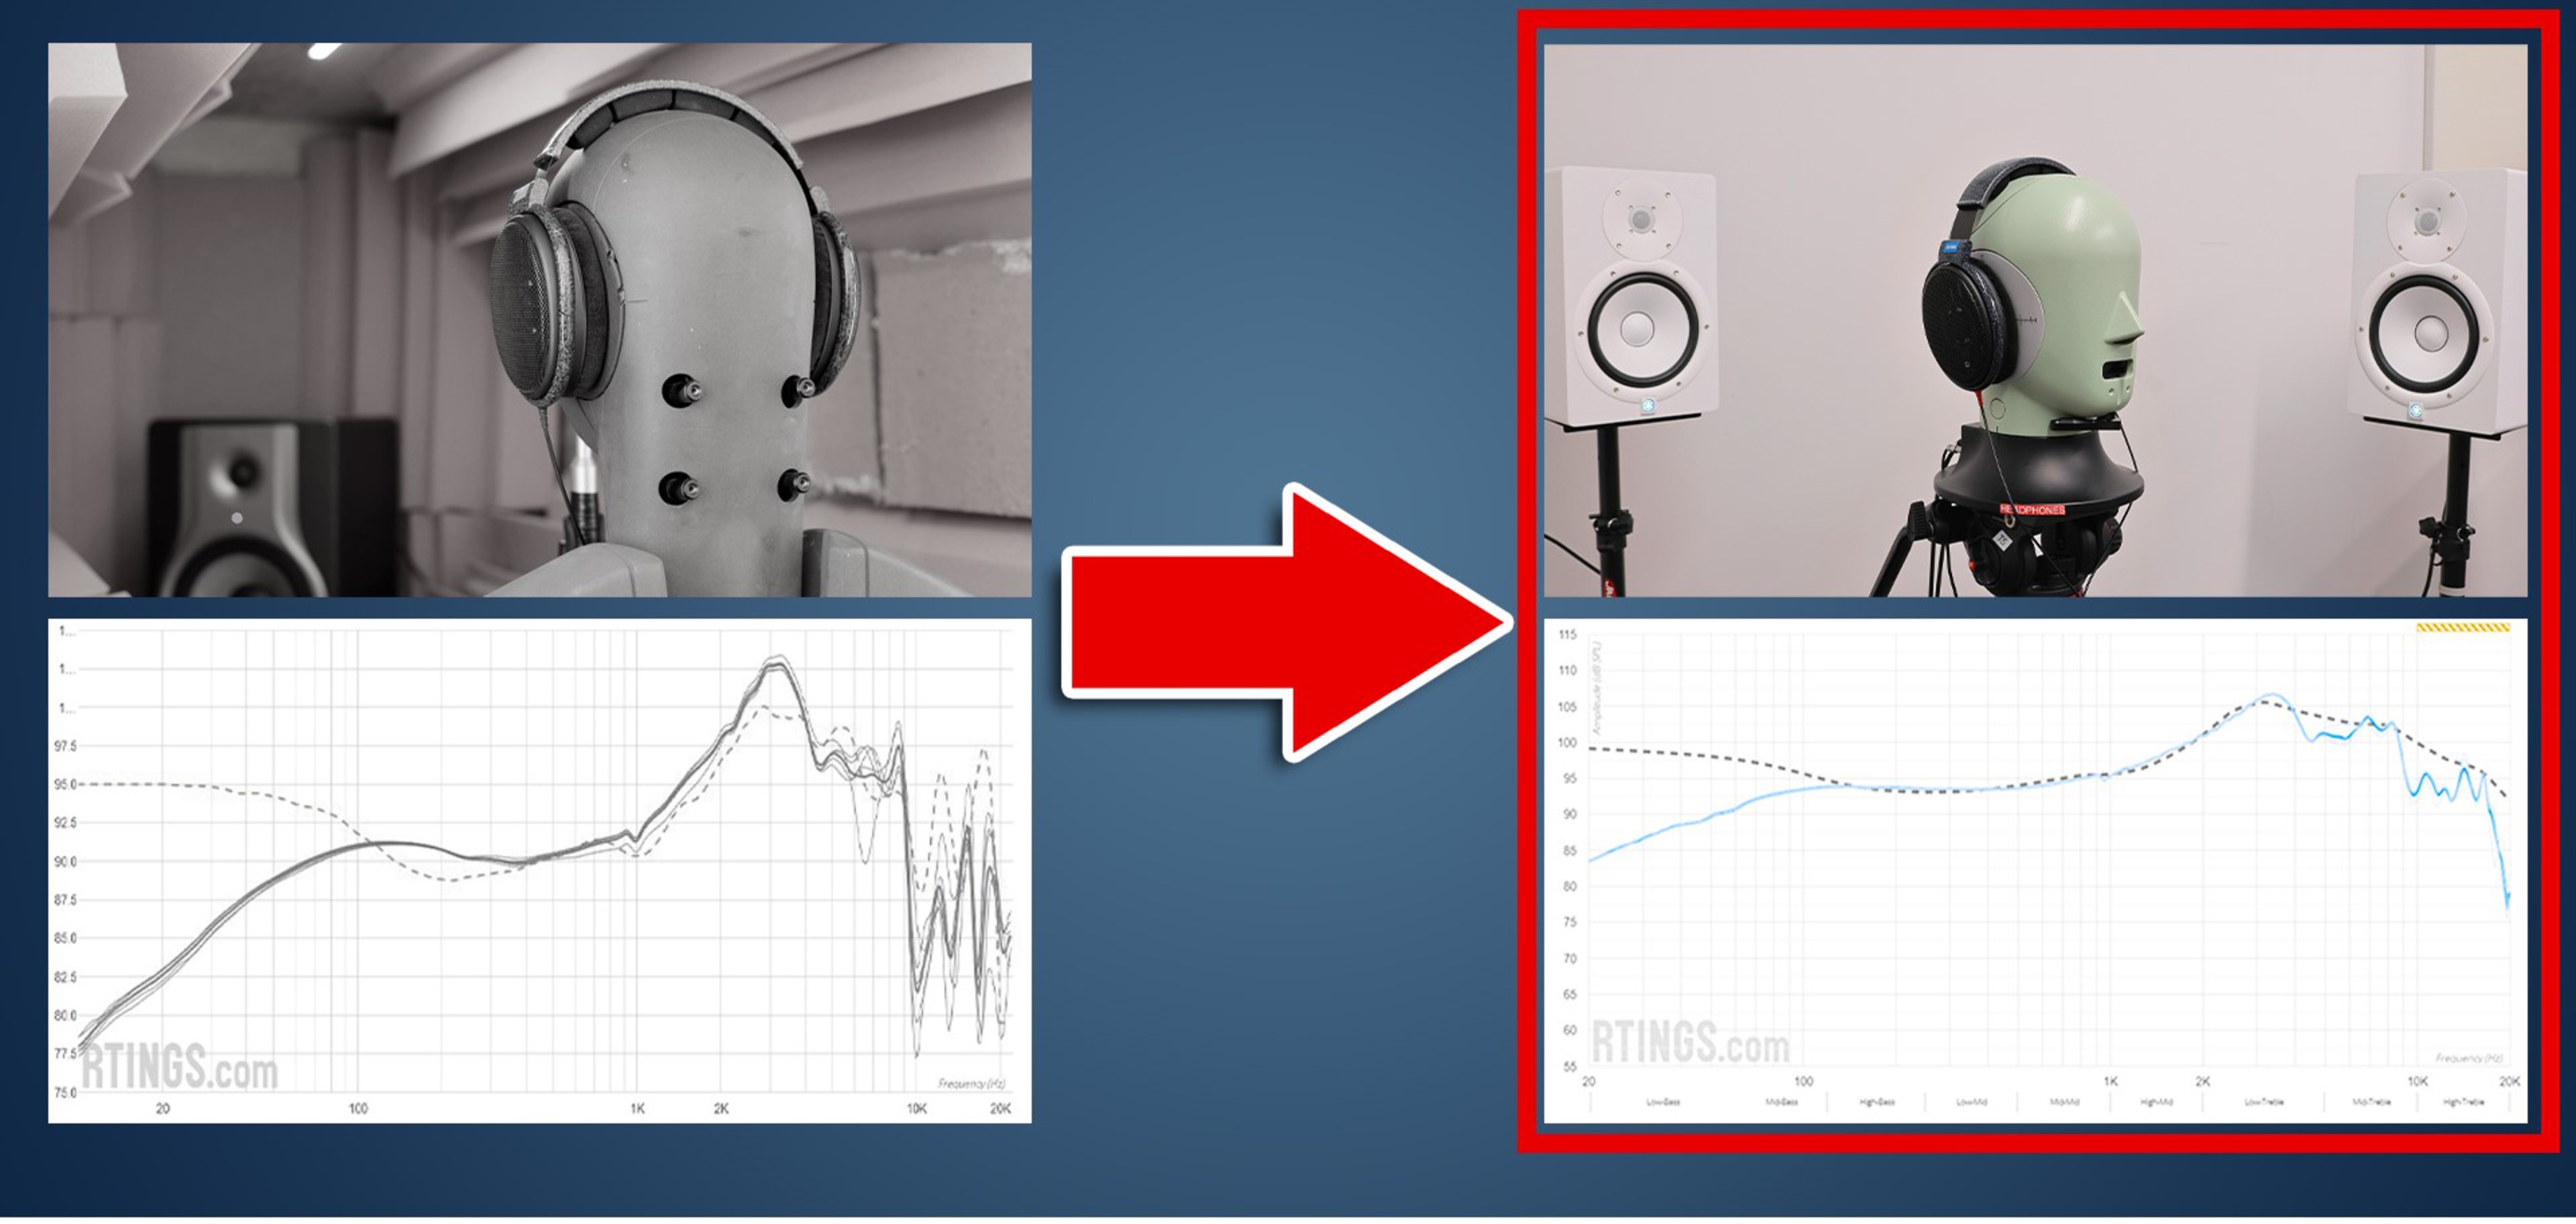
The results may surprise you as much as they surprised us: thirty-five participants, five curves, two song clips, and no clear preferred curve.
What's the main takeaway from these results? We're here to tell you that it's okay to trust that you like what you like and that you're not wrong. It doesn't mean that frequency response is an unimportant metric—it's the single most important parameter to define the perceived sound quality. It really matters since, based on these measurements, we can provide educated guidance in selecting the right headphones for you. In doing so, we aim to highlight the importance of personal preferences while recognizing the need to accurately assess objective performance.
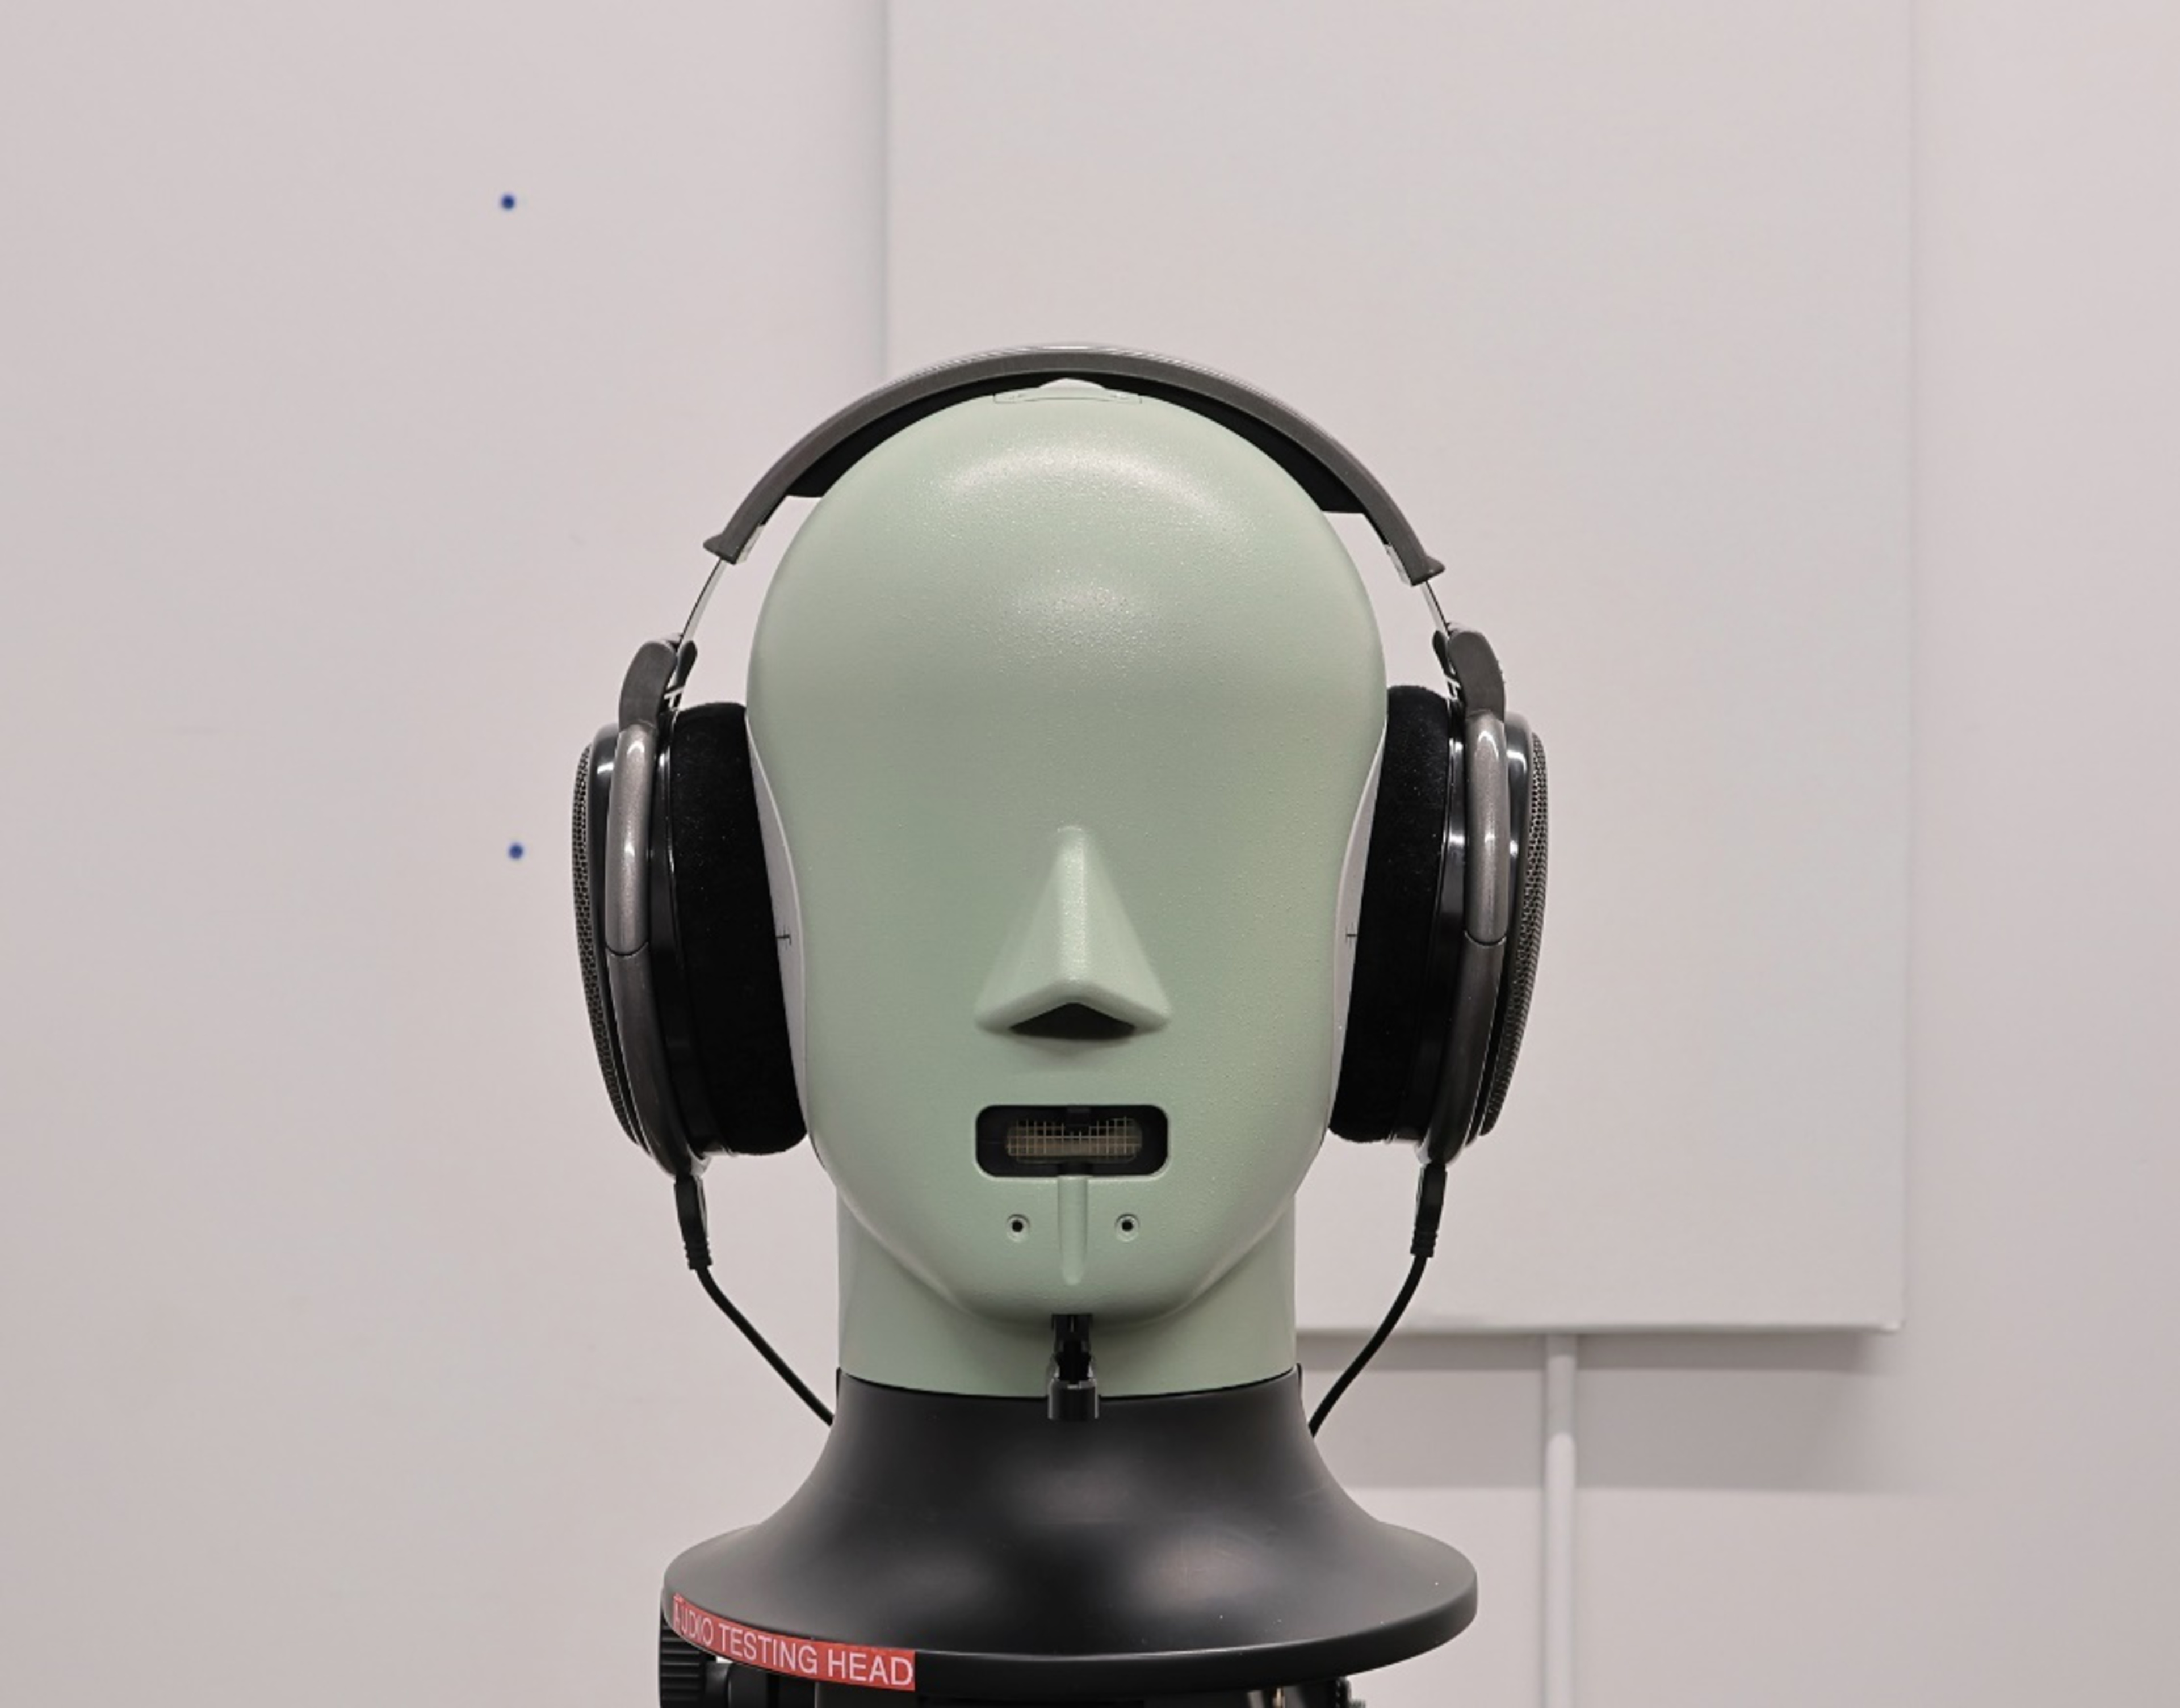
Now, why go through all the work of building a new target frequency response curve? The reason is our new friend, the B&K Type 5128-B.
A New Standard
Although we recognize that subjectivity will always play a great role in finding the right headphones for you, our commitment here at RTINGS.com is driven by our willingness to provide you with the most accurate objective metrics to help you with your buying decisions. Regarding headphone measurements, this also means staying current with the latest standards, letting us expand the scope of our evaluation.
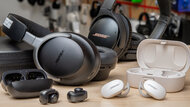
The Brüel & Kjær (B&K) Type 5128-B Head and Torso Simulator (referred to as the 5128 in the rest of this article) offers a new take on the headphone measurement standards that have been in practice for more than 40 years. We welcome this change because legacy ear couplers like the ones on our HMS II.3 test rig conform to the older but still widely accepted IEC 60318-4 ear simulator standard; this standard is only specified for measurements between 100Hz and 10kHz rather than the full 20Hz to 20kHz audible spectrum. While you can use such devices to take full band measurements, it can't be guaranteed to give the same result as the next unit under the same conditions since there are no indications of tolerance.
So here comes the B&K Type 4620 ear simulator:
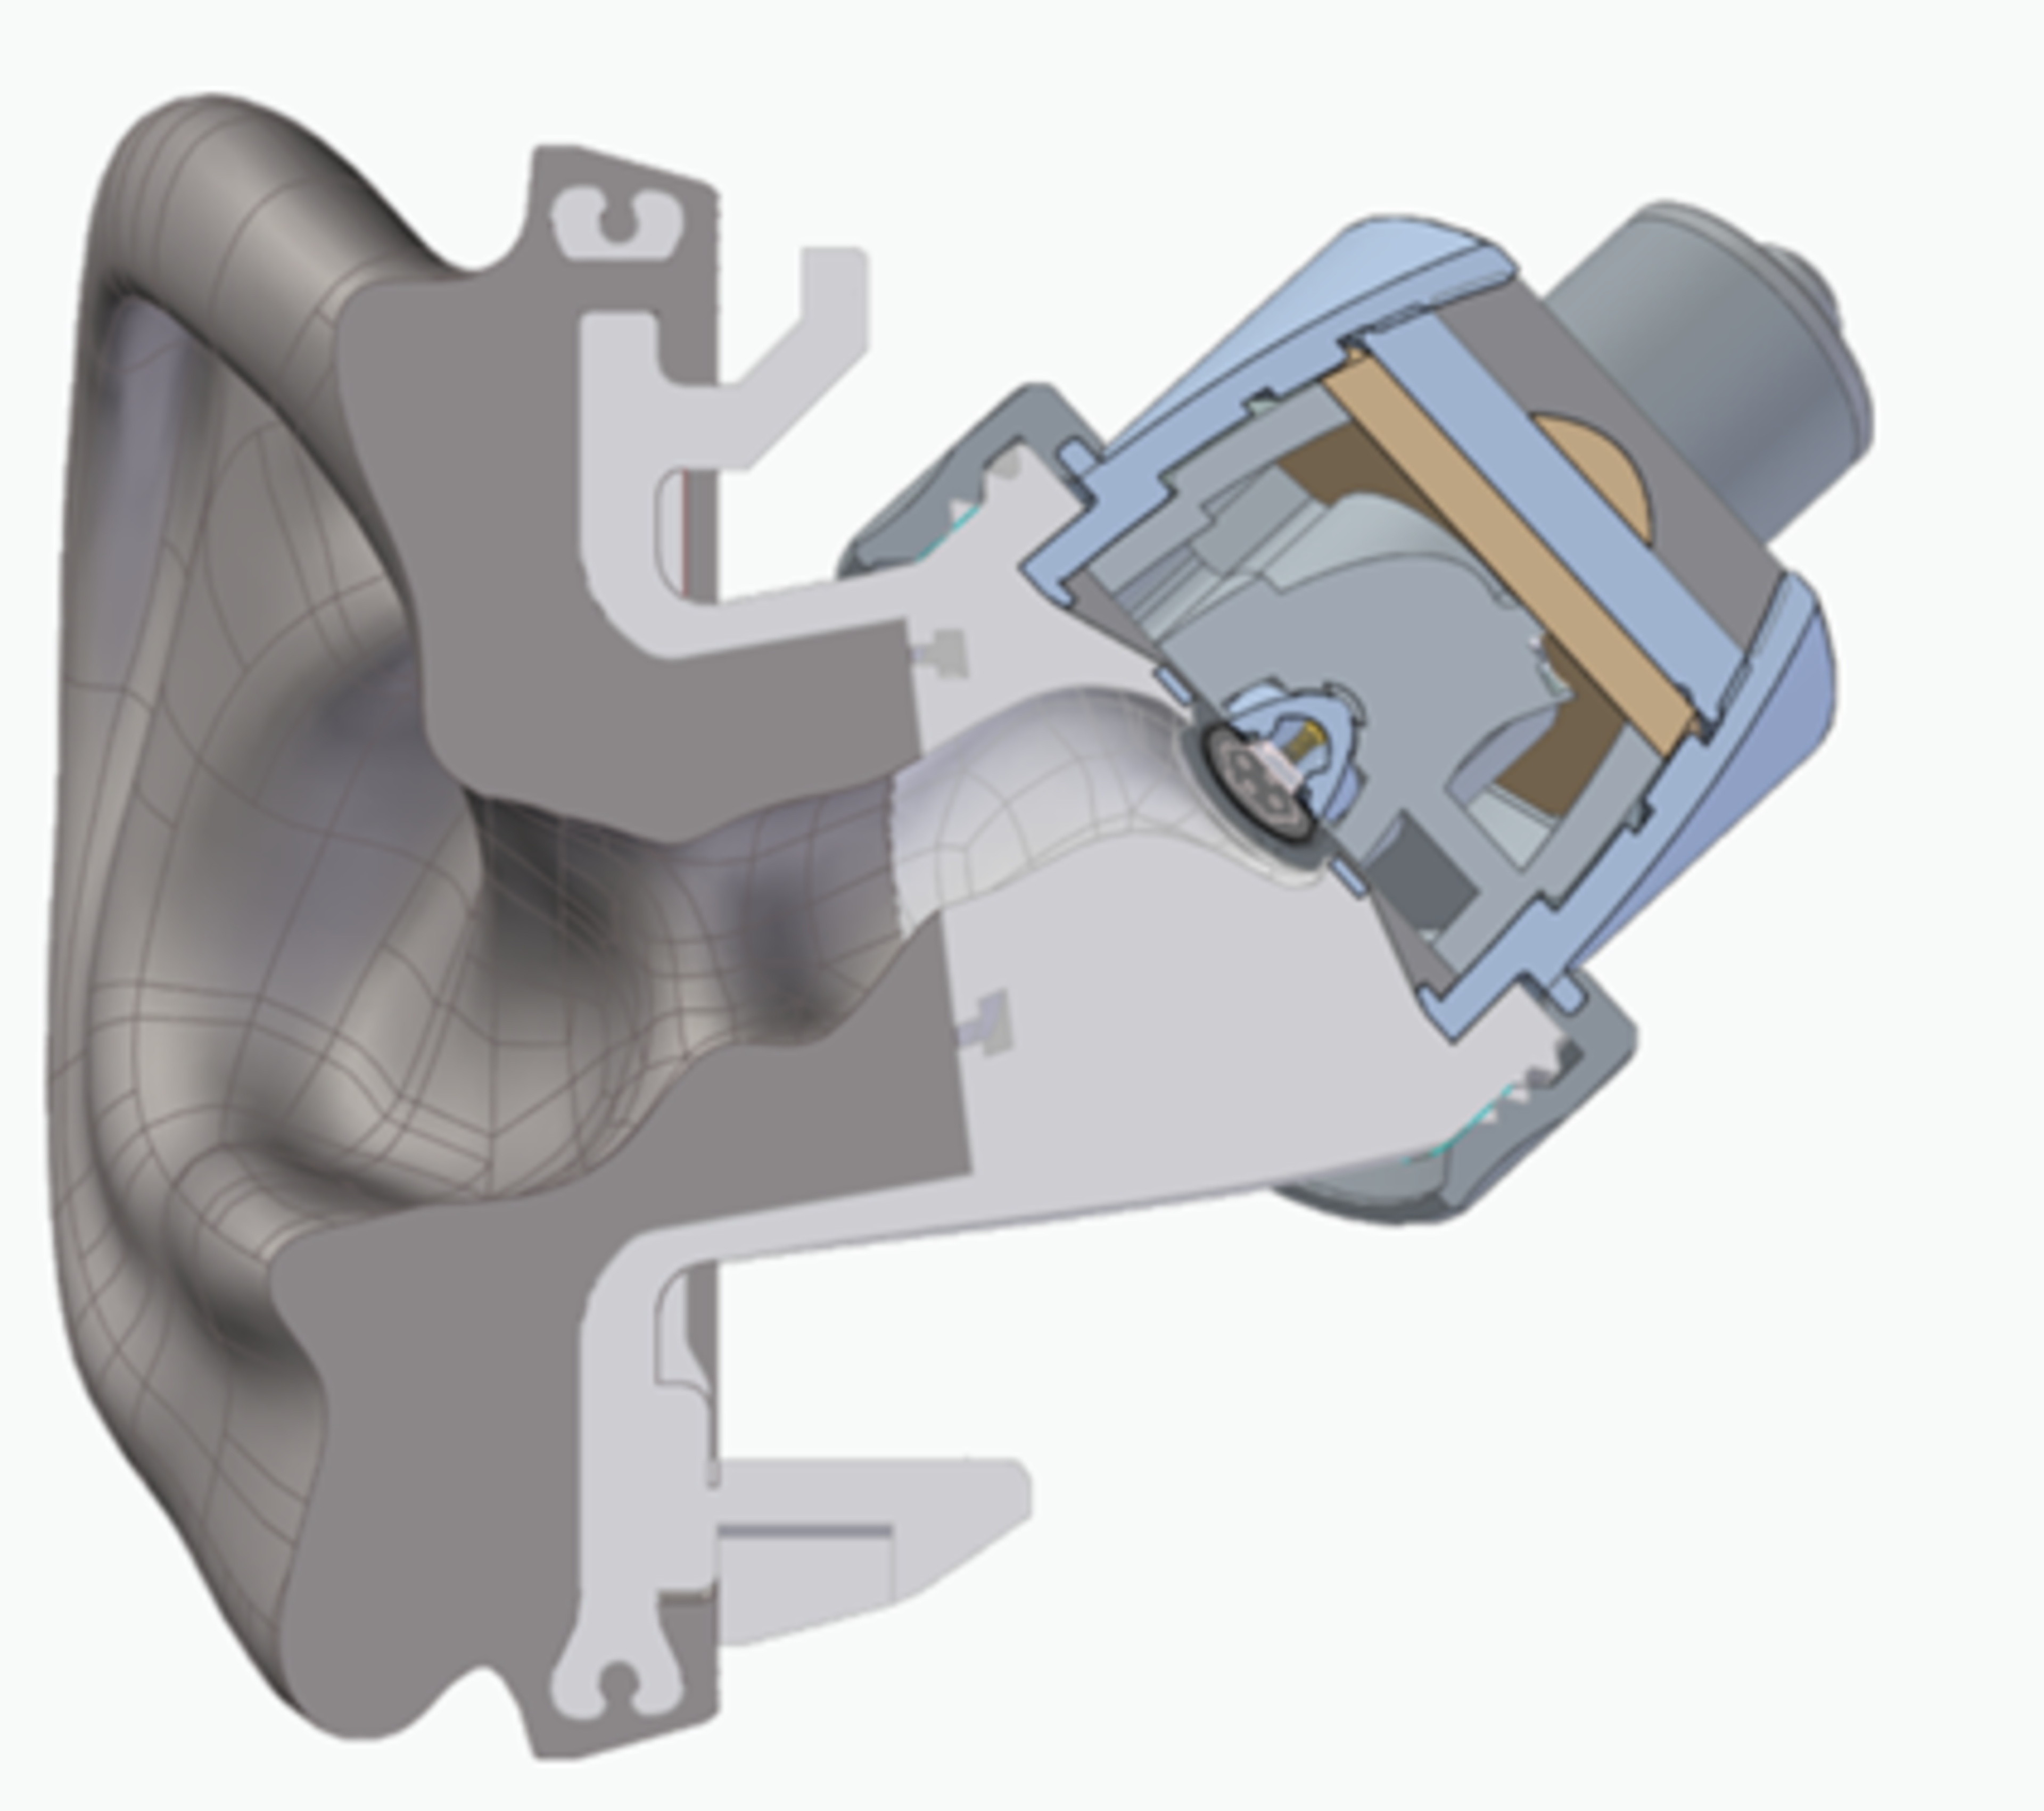
A lot of research has gone into the conception of this artificial ear.
- It's specified to measure the full audible range of human hearing.
- The coupler geometry is representative of an average human ear canal.
- It's designed to present the acoustic impedance of an average human ear.
So, are all the headphone measurements we've made so far wrong? No! It doesn't render the huge corpus of measurements from us and others obsolete. Headphone measurements always had a certain level of uncertainty. Not only does the morphology of each individual vary considerably, but there is also unavoidable variability in the process itself, regardless of the testing equipment. We aim to minimize these limitations, but some will remain.
This new test fixture will take measurements that look slightly different from our previous results, but you can interpret what you see in a familiar way. The change will be mostly noticeable in the high frequencies, where our HMS II.3 fixture has quite an uneven response. We did notice some change in the bass responses, too, but there are no repeatable, consistent differences.
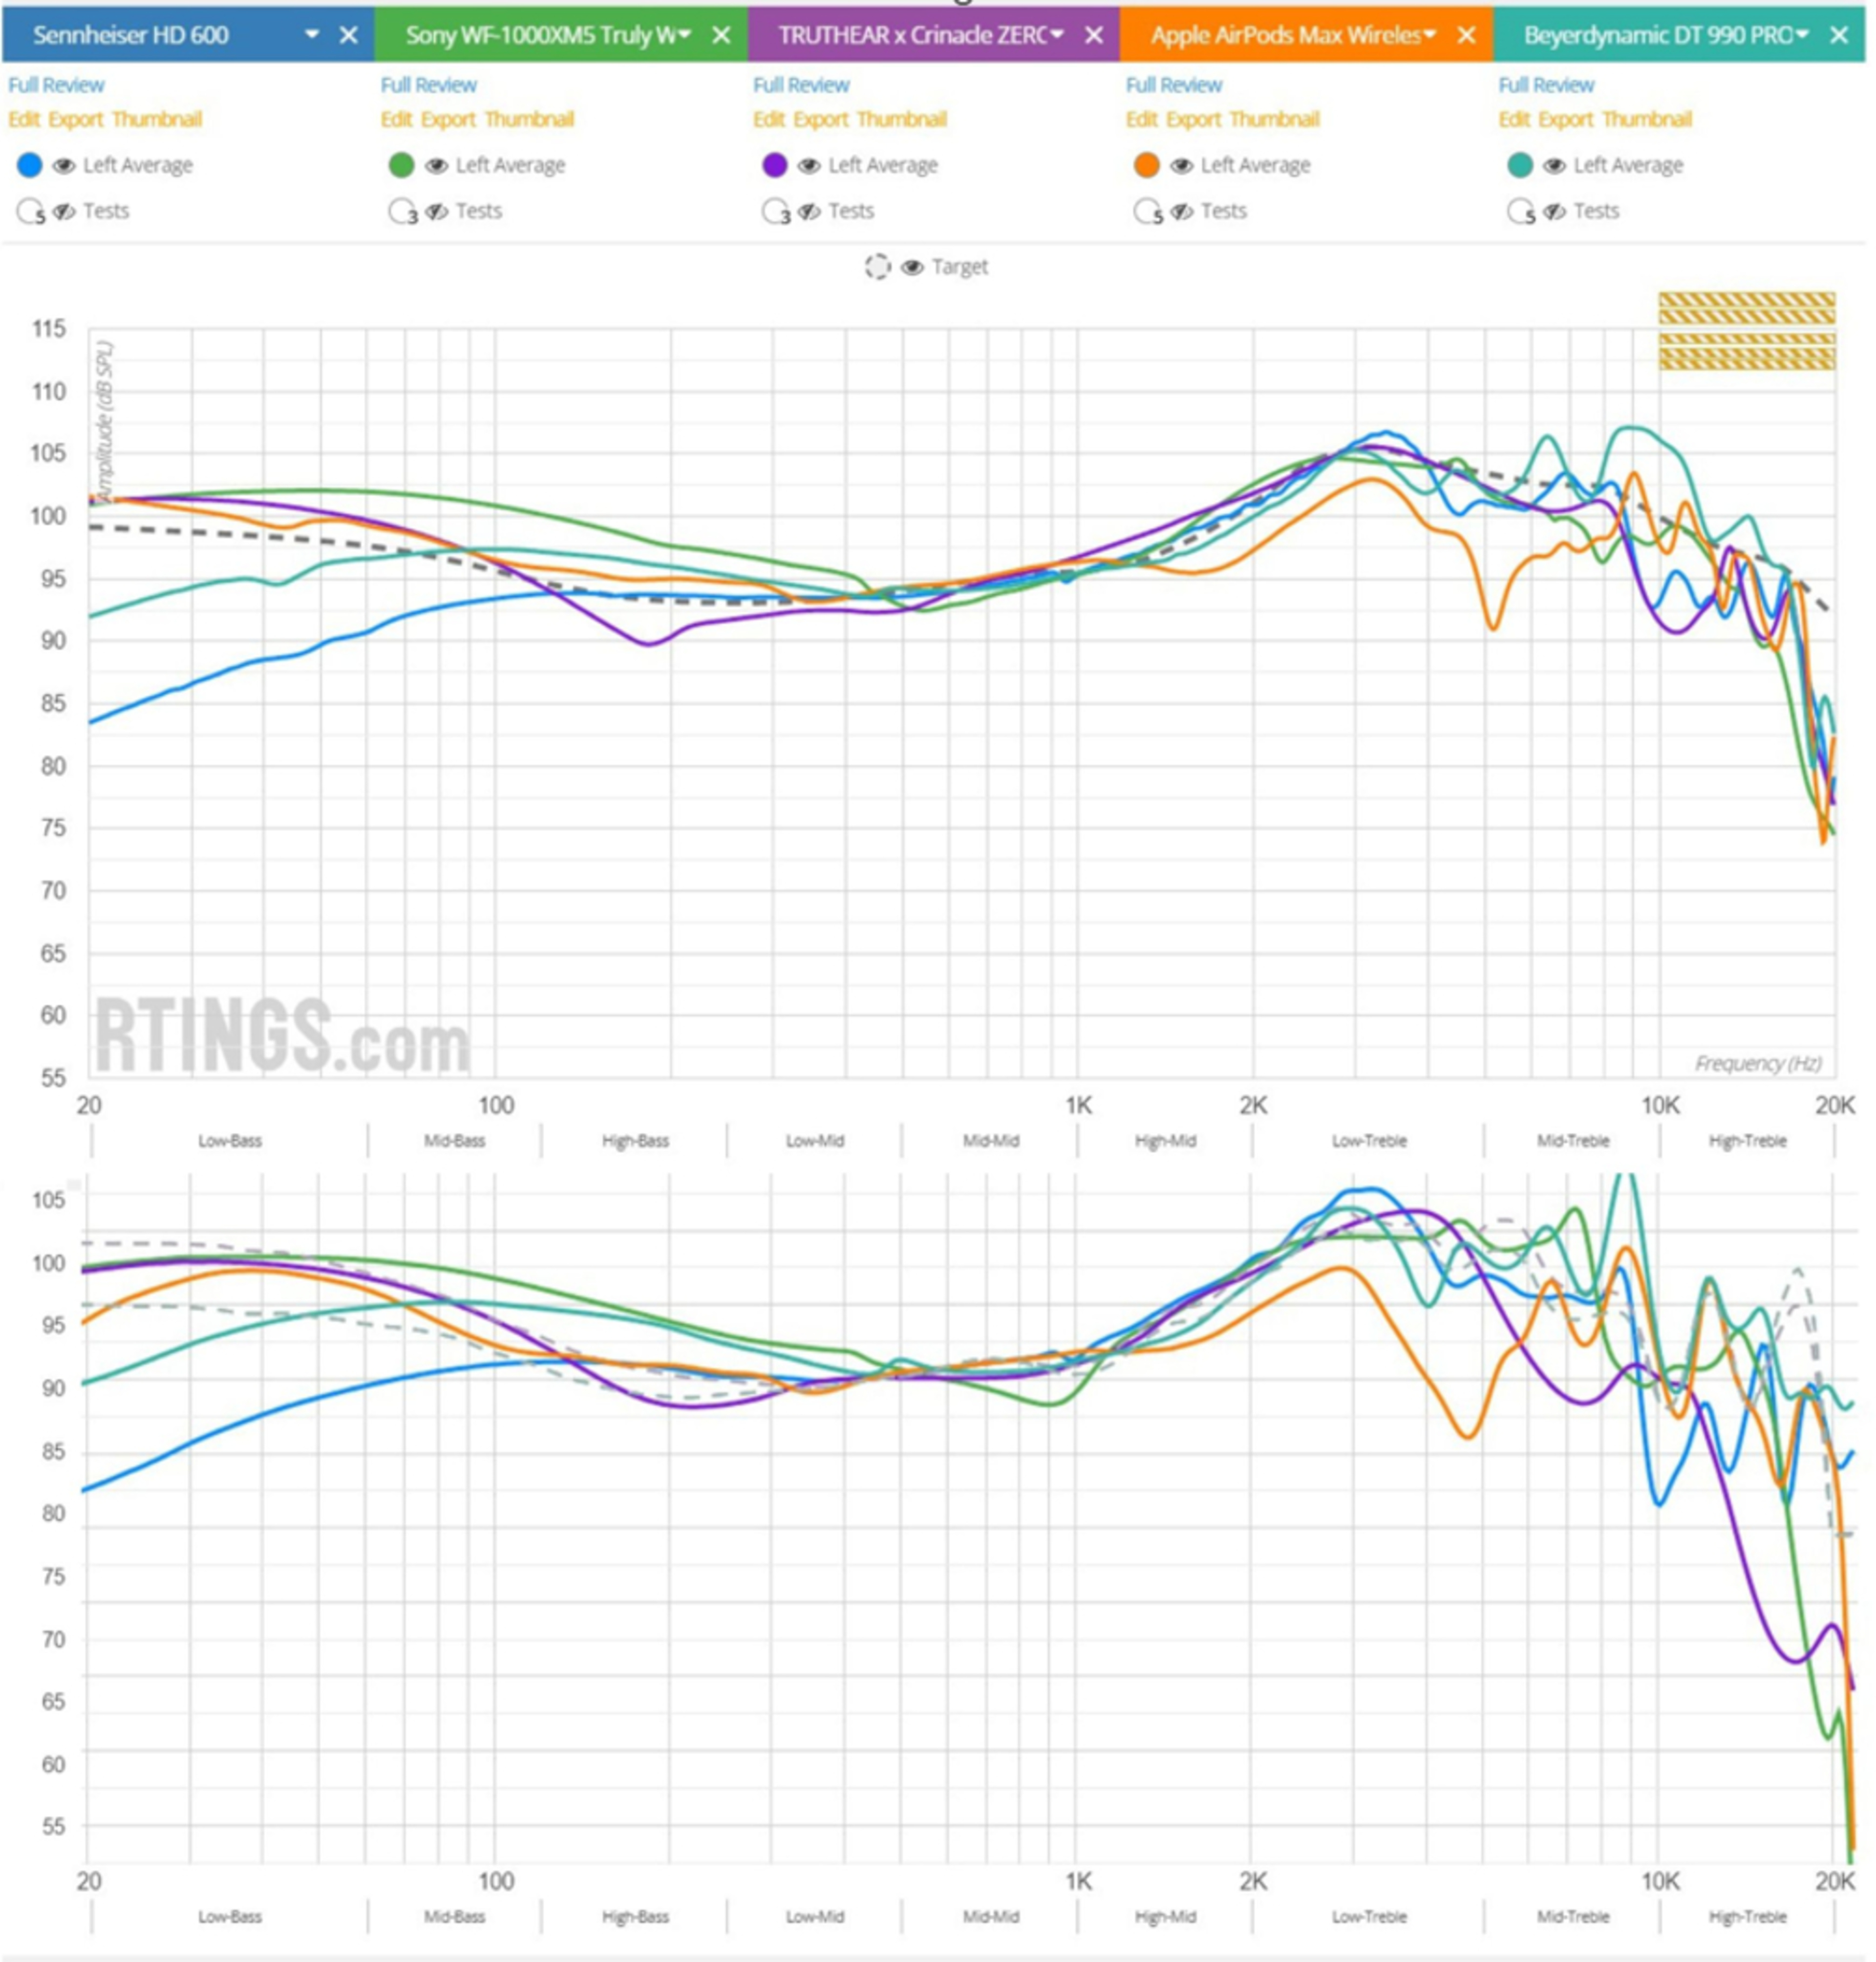
The figure below compares the frequency response measured with the 5128-B (top graph) and the frequency response measured with the HMS II.3 (bottom graph) for a few headphones. There aren't night and day differences between the two sets of results, but don't expect to see the same frequency response graphs you're used to.
New Test Fixture, New Challenges
While this new artificial head and ear simulator brings new possibilities to frequency response measurements, these great measurements don't mean much without a base of comparison. As you may have guessed, we need a target. Since the results are different between the old HMS II.3 and the new 5128, the target must also be different. But the challenge here is that there isn't a direct conversion between measurements made on these two devices.
Moreover, almost all past research on headphone frequency response (led primarily by Harman) was based on IEC-60138-4 compliant couplers, often referred to as the 711. As we adopt the 5128 platform, we're a bit ahead of the curve and have very limited data on what should be a desirable frequency response curve. Although there are a lot of unknowns, we're up for a challenge! And as you'll see, not everything is set in stone in the headphone world.
How We Did It
So, we have a nice state-of-the-art tool to measure headphone frequency response (and more), but to assess what people will like, why don't we just ask? Yes, the world needs another double-blind listening test—it's the only way to evaluate whether what we think we like is really what we like. The 35 participants in this study are all employees here at RTINGS.com.
The following figure shows the five sound profile curves that participants were asked to rate from 1 to 10 while listening to two different 25-second music programs: Daft Punk's Get Lucky and Steely Dan's Cousin Dupree.
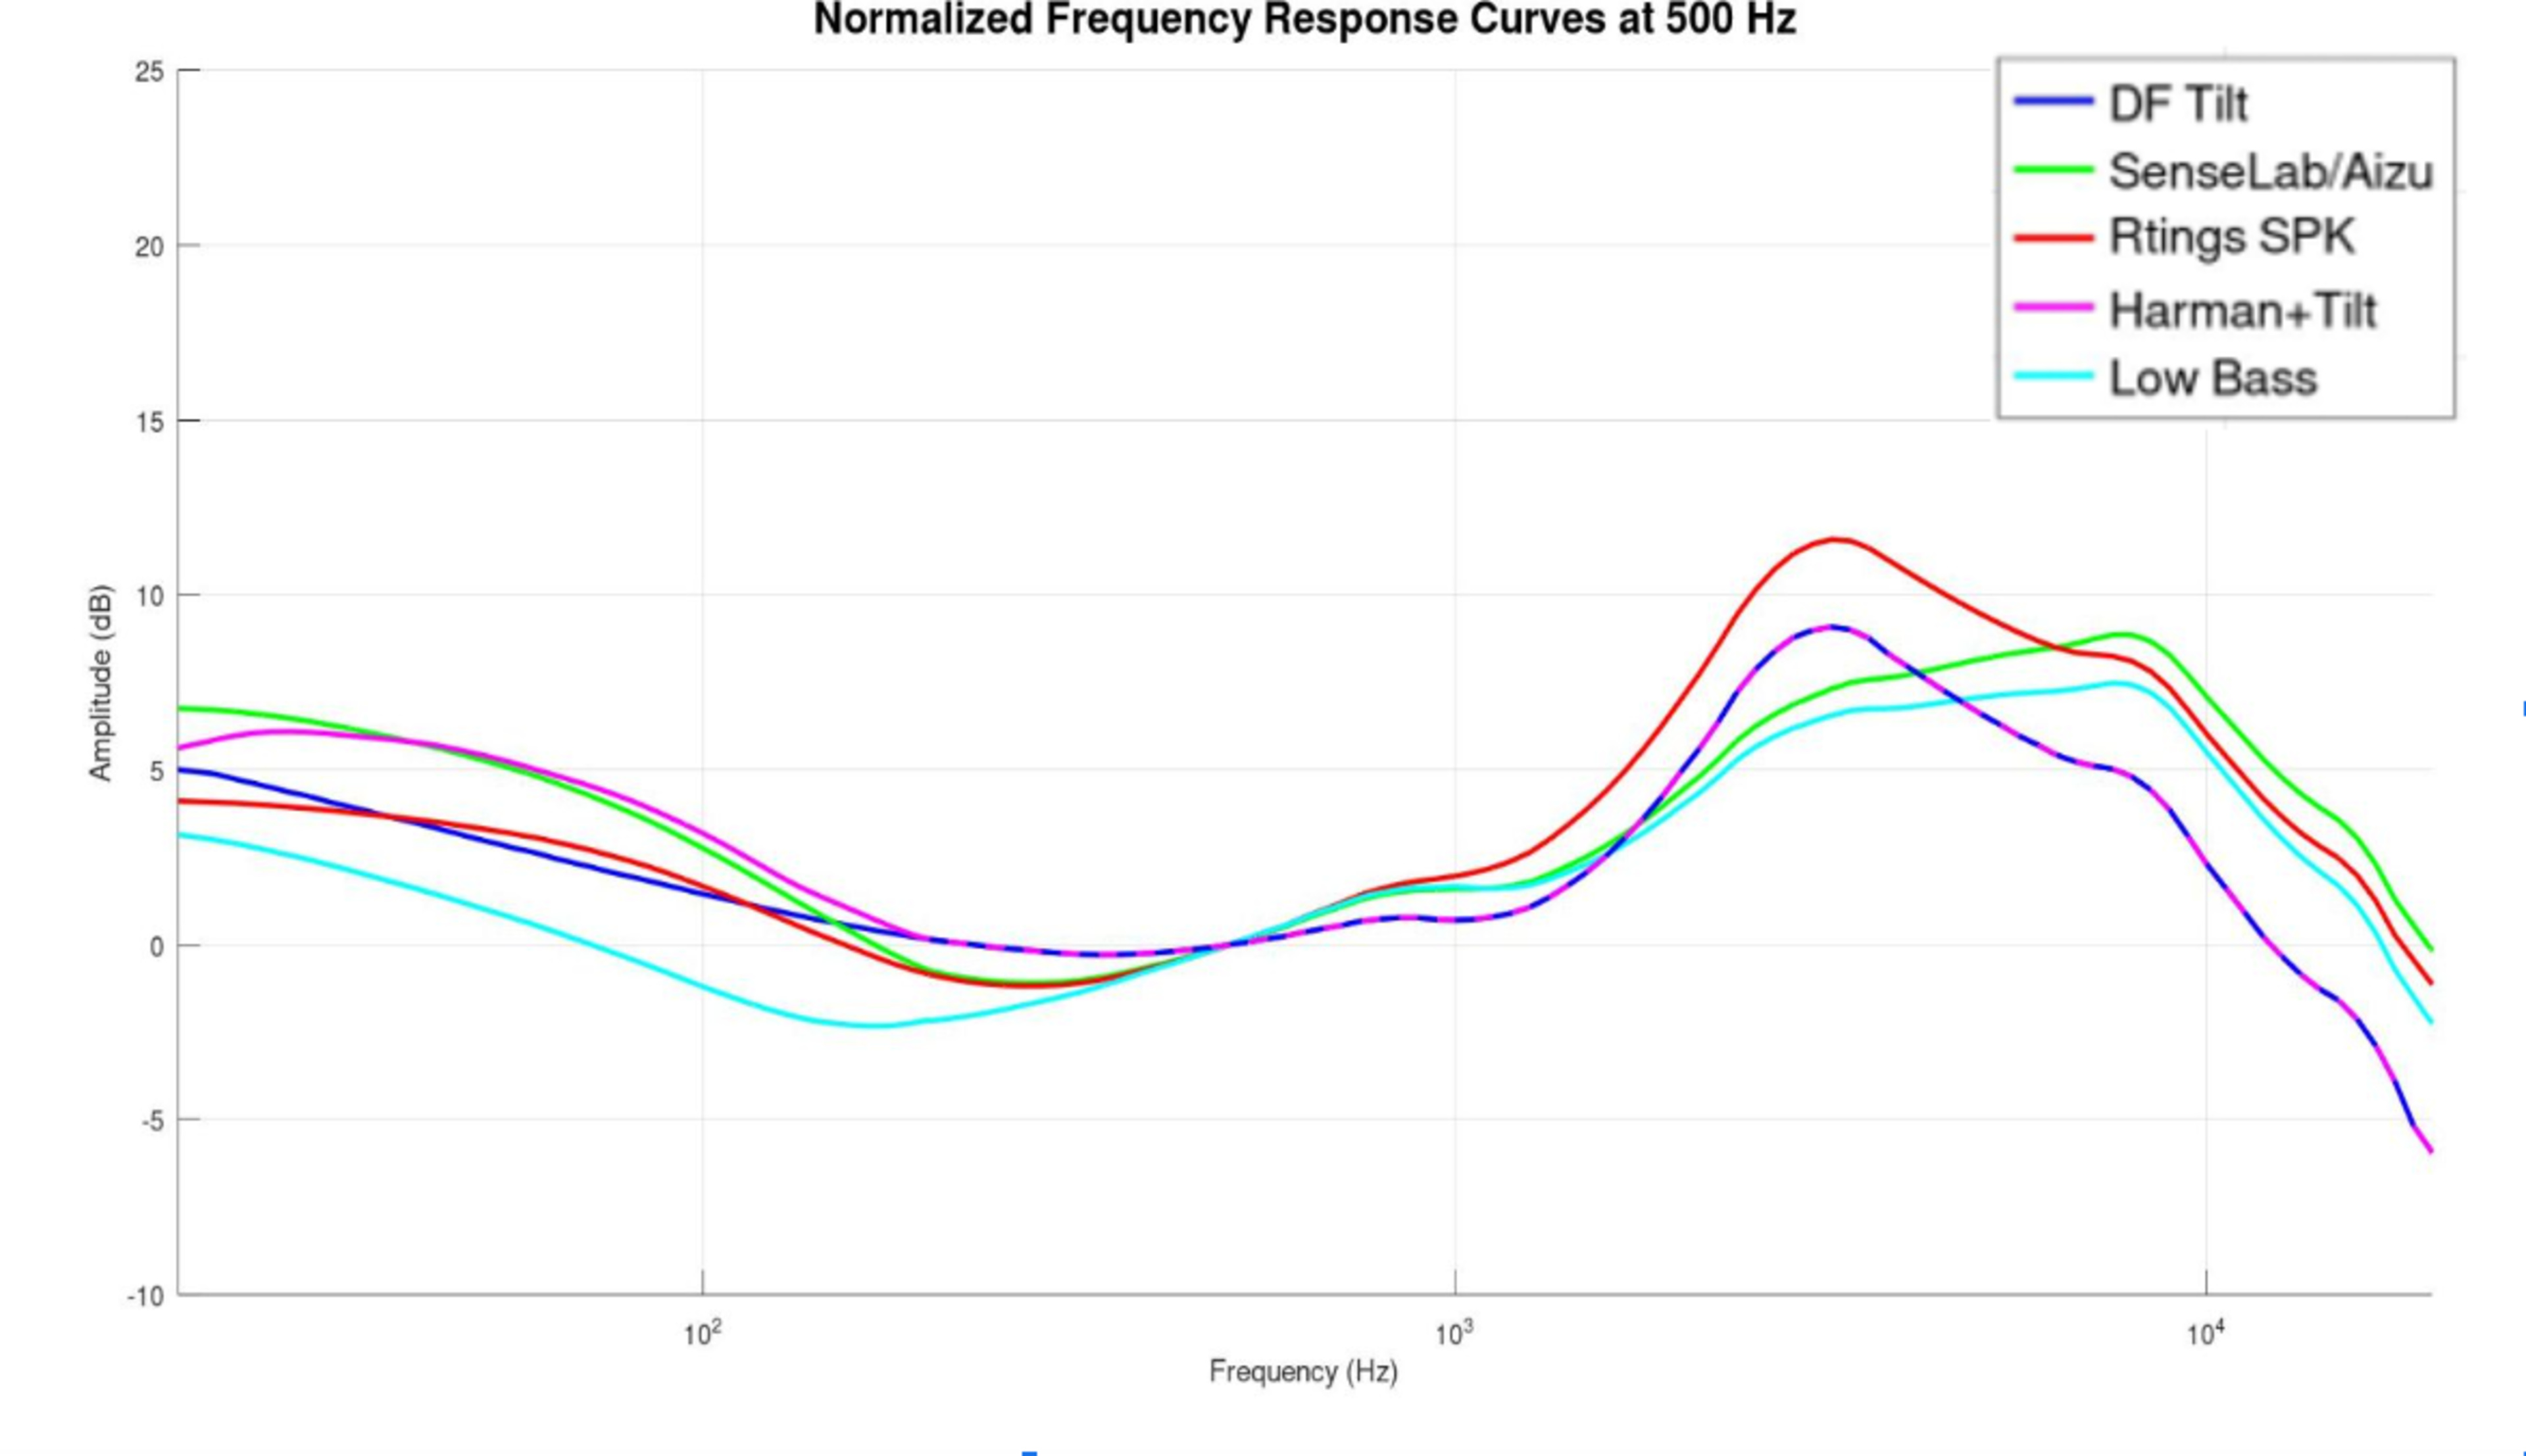
Most of these sound profile curves have a certain ground for potentially representing what people consider a balanced sonic signature:
Blue (DF Tilt)
A target curve based on the known neutral diffuse field response of the 5128, on which a -1 dB per Octave tilt has been applied.
Green (SenseLab/Aizu)
A visual approximation of the average preferred curve for the 5128, presented by Ravizza et al. in a recent publication of the Audio Engineering Society1. (More on this later!)
Red (RTINGS.com SPK)
The RTINGS.com target curve for speakers. It itself is based on Harman research, to which we apply the diffused field response of the 5128.
Magenta (Harman+Tilt)
A combination of the known bass behavior of the Harman Over-Ear 2018 target and a -1 dB per octave tilt 200Hz upward.
Cyan (Low Bass)
A -4 dB shelving filter below 300Hz and a -5 dB bell filter centered at 3000Hz applied to the magenta curve to achieve a curve with significantly less bass. This curve should be considered an anchor and isn't backed by any research or known principles that suggest people would like it.
Before formally evaluating these sound profiles, we played a 2-minute music program (Dire Straits' Sultans of Swing) for each of our volunteers, during which we randomly switched the EQ curves with no scoring asked from the participant. Then, we proceeded with the tests. The order in which we presented the EQ curves to the participants was randomized and randomized again for the second clip. We calibrated the volume levels at 85 dB SPL A Weighted and compensated for small differences in levels due to the different responses. For listening, we used the Sennheiser HD 650 headphones, which were equalized to match the resulting frequency response to the curve evaluated. We used AutoEQ to create the EQ profiles, Equalizer APO to implement them, and EACS (Equalizer APO Config Switcher) for live profile switching. After the first full sequence, the participants were allowed to listen to any of the five curves as often as they wanted and in their desired order.
People Like Different Curves And Are Sure Of It
By now, you're bursting with anticipation to see the results, right? Let's break the suspense.

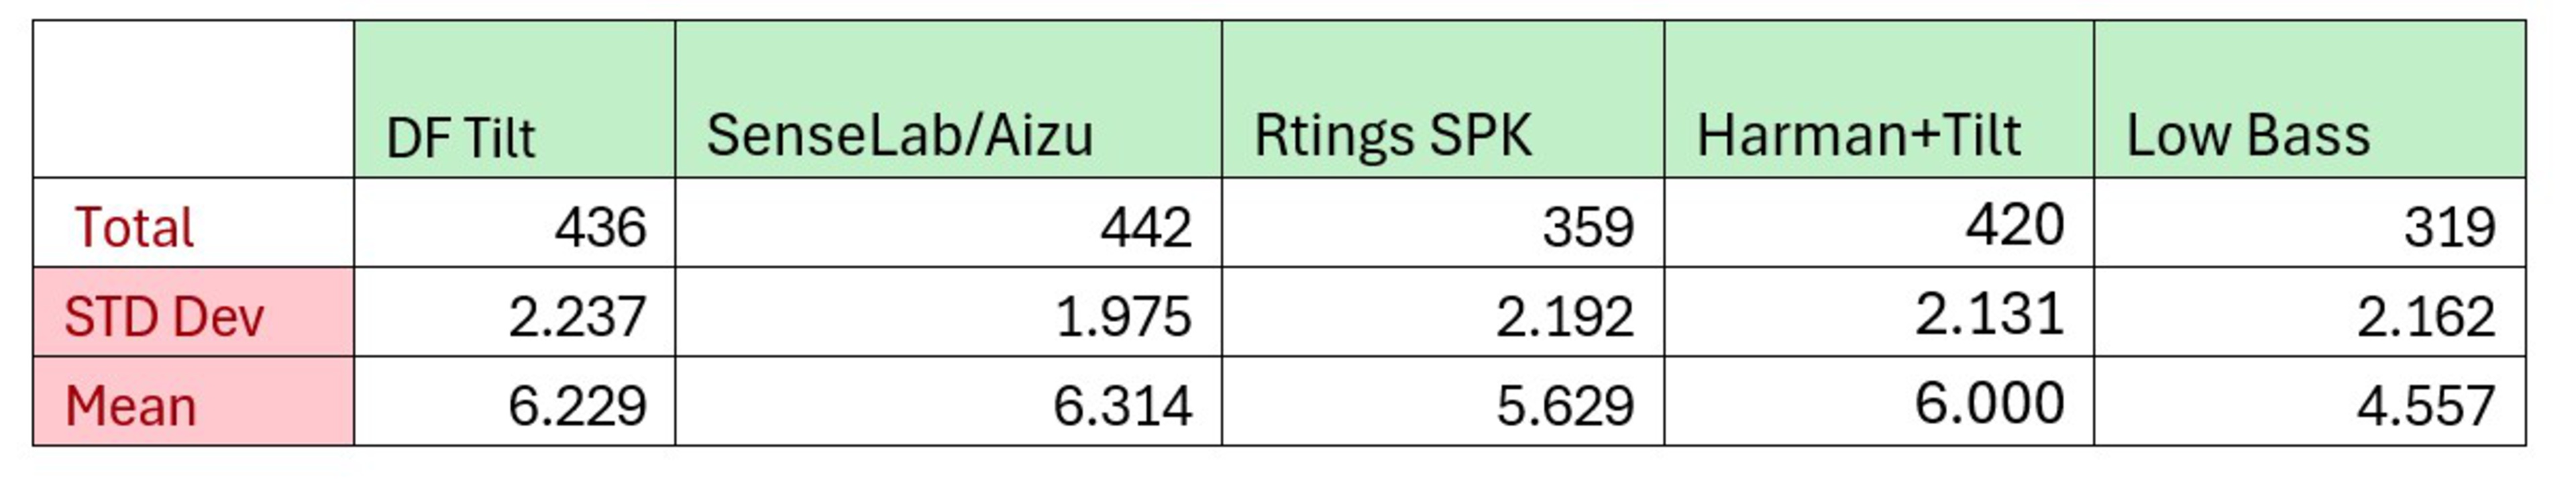
All this experimental work ends up with four curves out of five that are statistically tied! For the statisticians out there, here's the p-value table for each pair of curves (P>0.05 means statistically equal):
| Curve | VS Curve | p-Value |
|---|---|---|
| DF Tilt | SenseLab/Aizu | 0.82394 |
| DF Tilt | RTINGS.com SPK | 0.08538 |
| DF Tilt | Harman+Tilt | 0.55422 |
| DF Tilt | Low Bass | 0.00001 |
| SenseLab/Aizu | RTINGS.com SPK | 0.05283 |
| SenseLab/Aizu | Harman+Tilt | 0.37290 |
| SenseLab/Aizu | Low Bass | 0.00002 |
| RTINGS.com SPK | Harman+Tilt | 0.27414 |
| RTINGS.com SPK | Low Bass | 0.00266 |
| Harman+Tilt | Low Bass | 0.00056 |
The low bass anchor curve is confirmed to be the least preferred, with high confidence.
These findings and our approach will be received with some scrutiny; we'd be disappointed if it wasn't. We, like you, want to be comprehensive when making statements about sound quality. This small-scale experiment isn't a definitive characterization of what people like. It also doesn't negate the validity of the more thorough testing and results from the Harman group and others. It was, however, conducted meticulously and is a valid double-blind listening test.
One interesting statistic that stood out when analyzing the results is that 63% of the participants picked the same EQ curve as their most preferred while listening to both music clips. Nobody commented that "they all sound the same." The differences were audible, and participants were engaged and confident with their ratings.
Past studies also have notions of trained vs. untrained listeners, geographic location, gender, and age. Our sample was a bit small for proper statistics to be made on these considerations, but we had a simple survey. Here are the demographics of our group:
- 6 women
- 29 men
- 12 candidates between 20 and 30 years old
- 23 candidates older than 30 years old
- 14 audio professionals
- 15 people who mentioned playing a musical instrument
- 12 candidates who identify themselves as audiophiles
The last three groups are obviously not mutually exclusive; we had 25 subjects that were part of at least one of these categories. While we don't draw any concrete conclusions on these aspects, it didn't make any significant differences in preferences in our experiment, except that women did appear to prefer the Low Bass curve more than men. This agrees with some past research2, but considering we only had six female colleagues participating, you should take this with a grain of salt.

While these are interesting observations, the listening tests didn't yield the solution for crafting the one perfect target curve. These results show that although relatively small differences are audible from an individual perspective, there are limits to the principle that a certain exact frequency response will universally be "right. " Saying anything can cut it would be wrong as well. The results of the Low Bass curve confirm that.
So, back to the drawing board.
The Target (K.I.S.S.)
Considering what we learned from the listening tests, it may be relevant to recall the wise words of the late engineer Kelly Johnson: "Keep it simple, stupid."
Without further ado, here is RTINGS.com's new target curve:
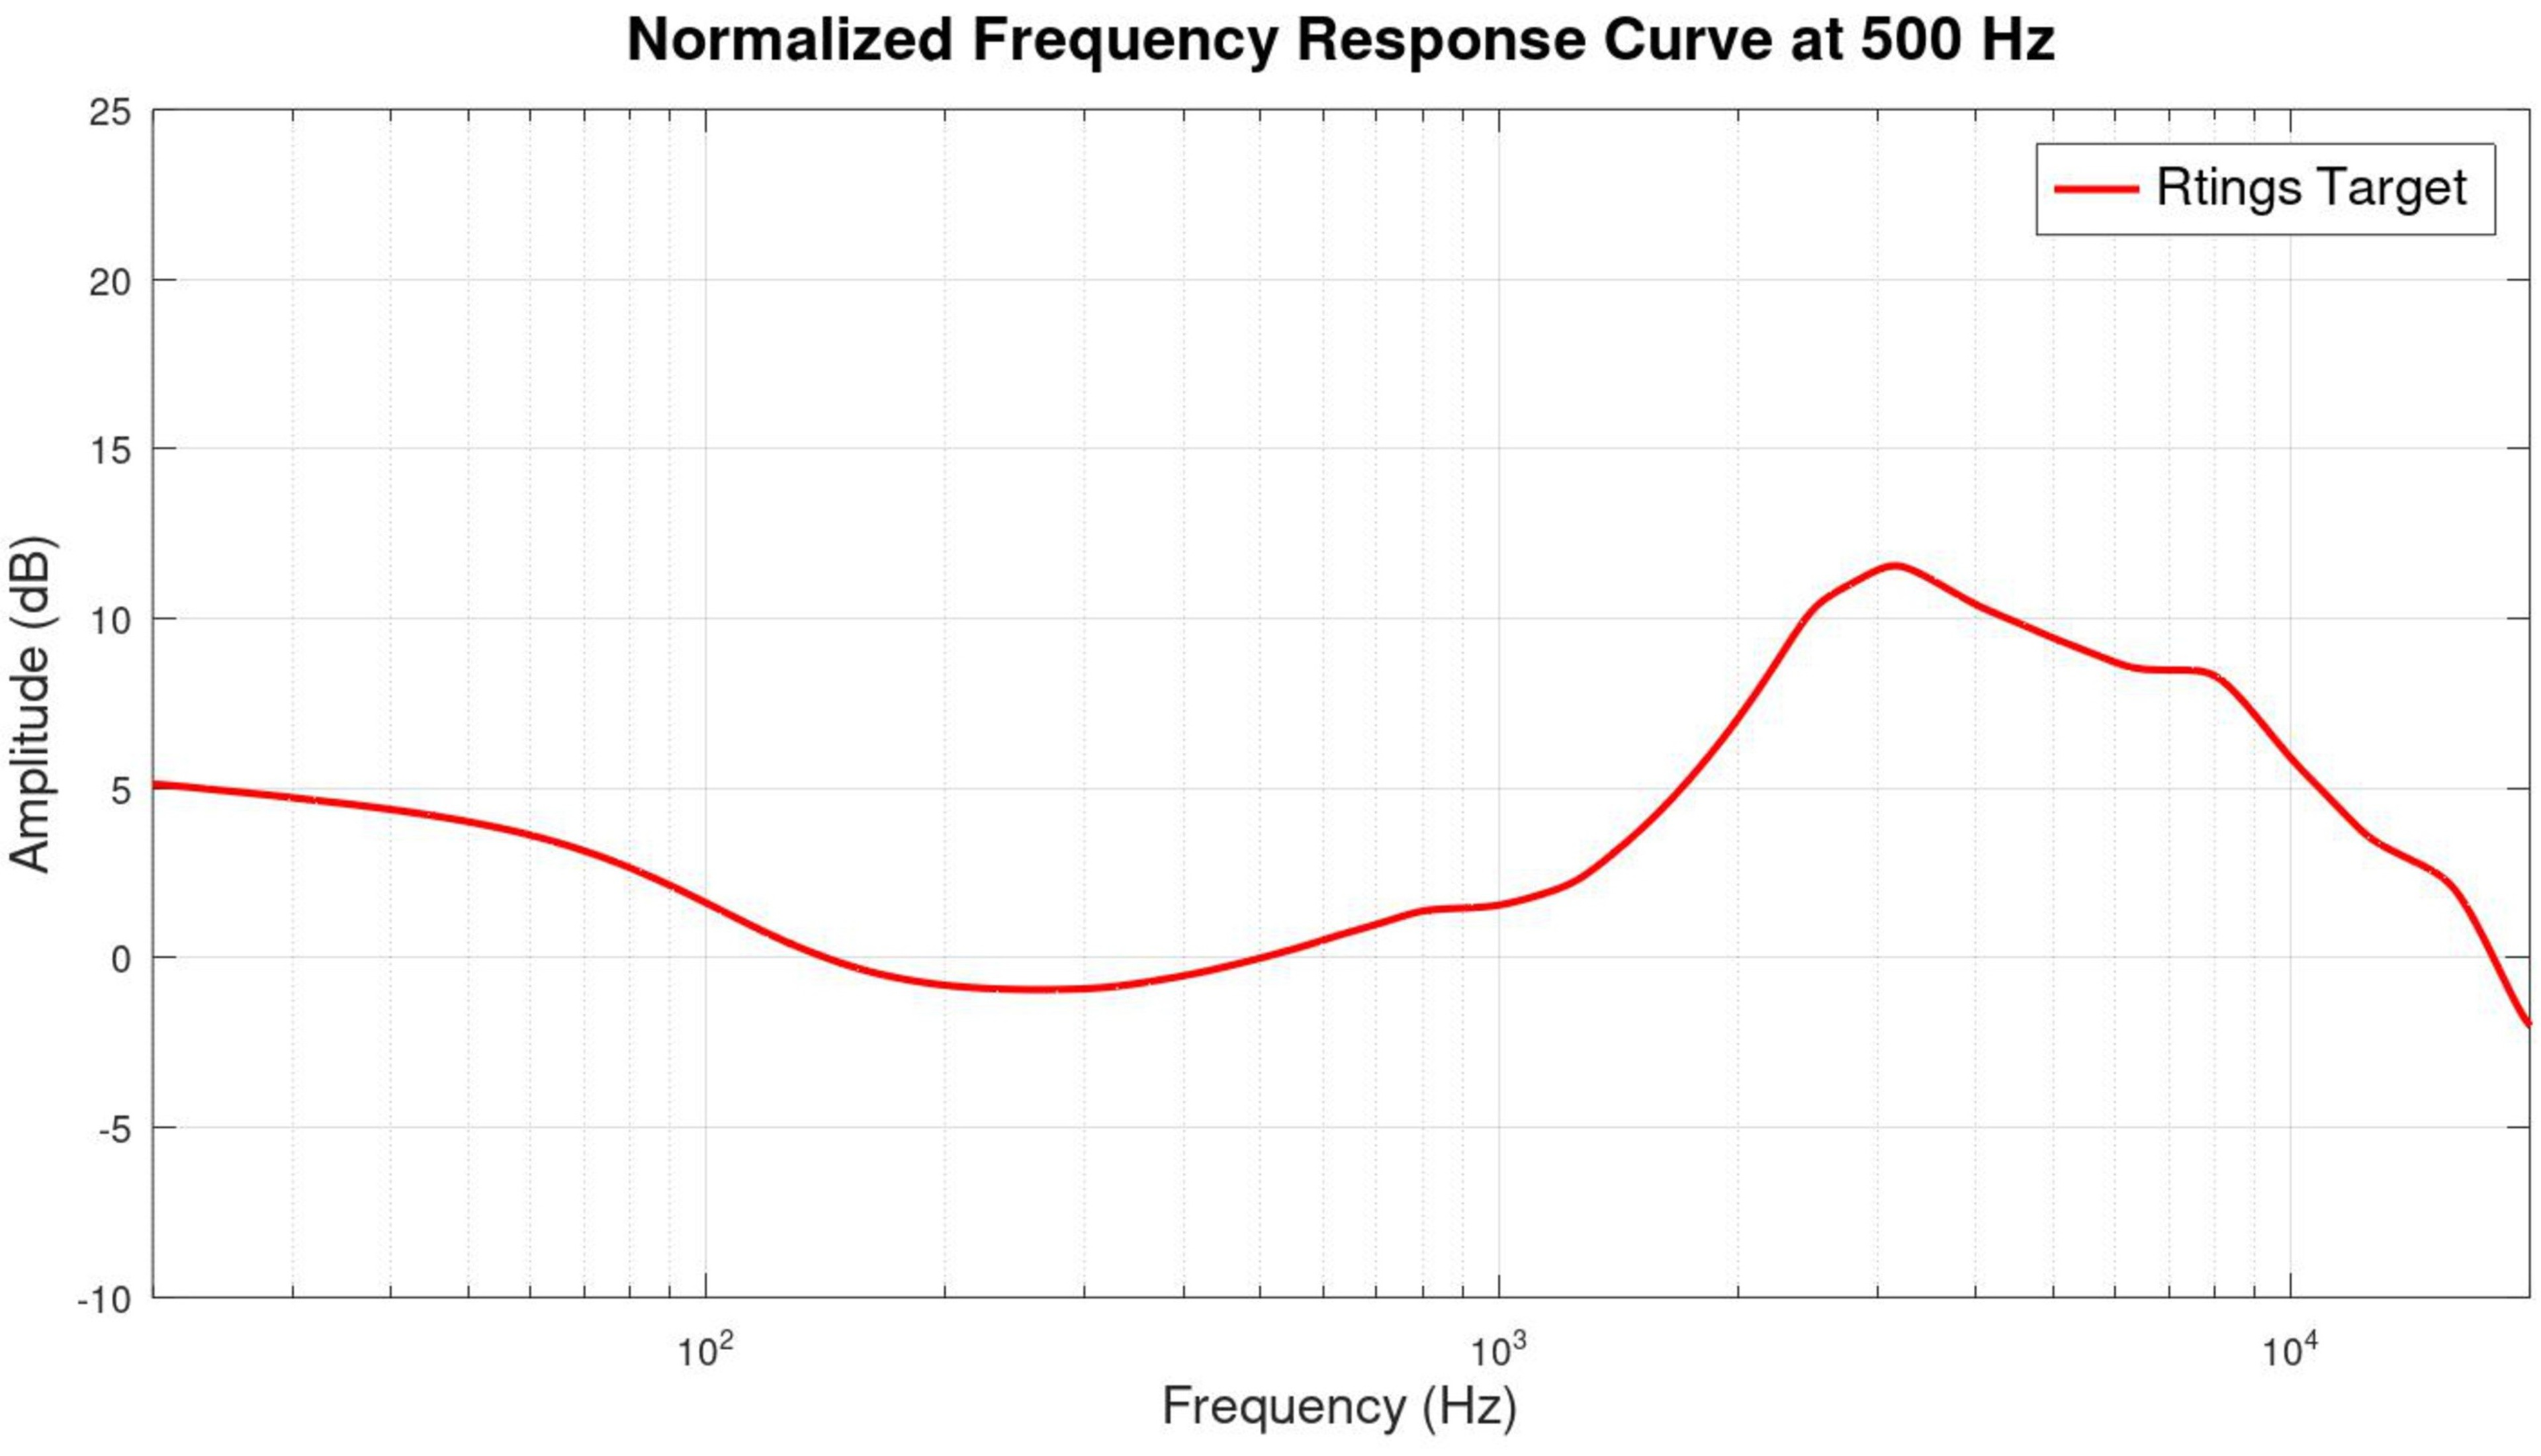
It was simply constructed by first starting with the response of the 5128 HATS in a flat diffused field. To which:
- We applied a -6 dB tilt in the response over the audio band (0.6 dB/octave)
- Then applied a 4.3 dB bass shelf (@105Hz, Q .707)
- And smoothed the curve to 1/6th octave
Yes. That's it. Let's go over each of these design choices.
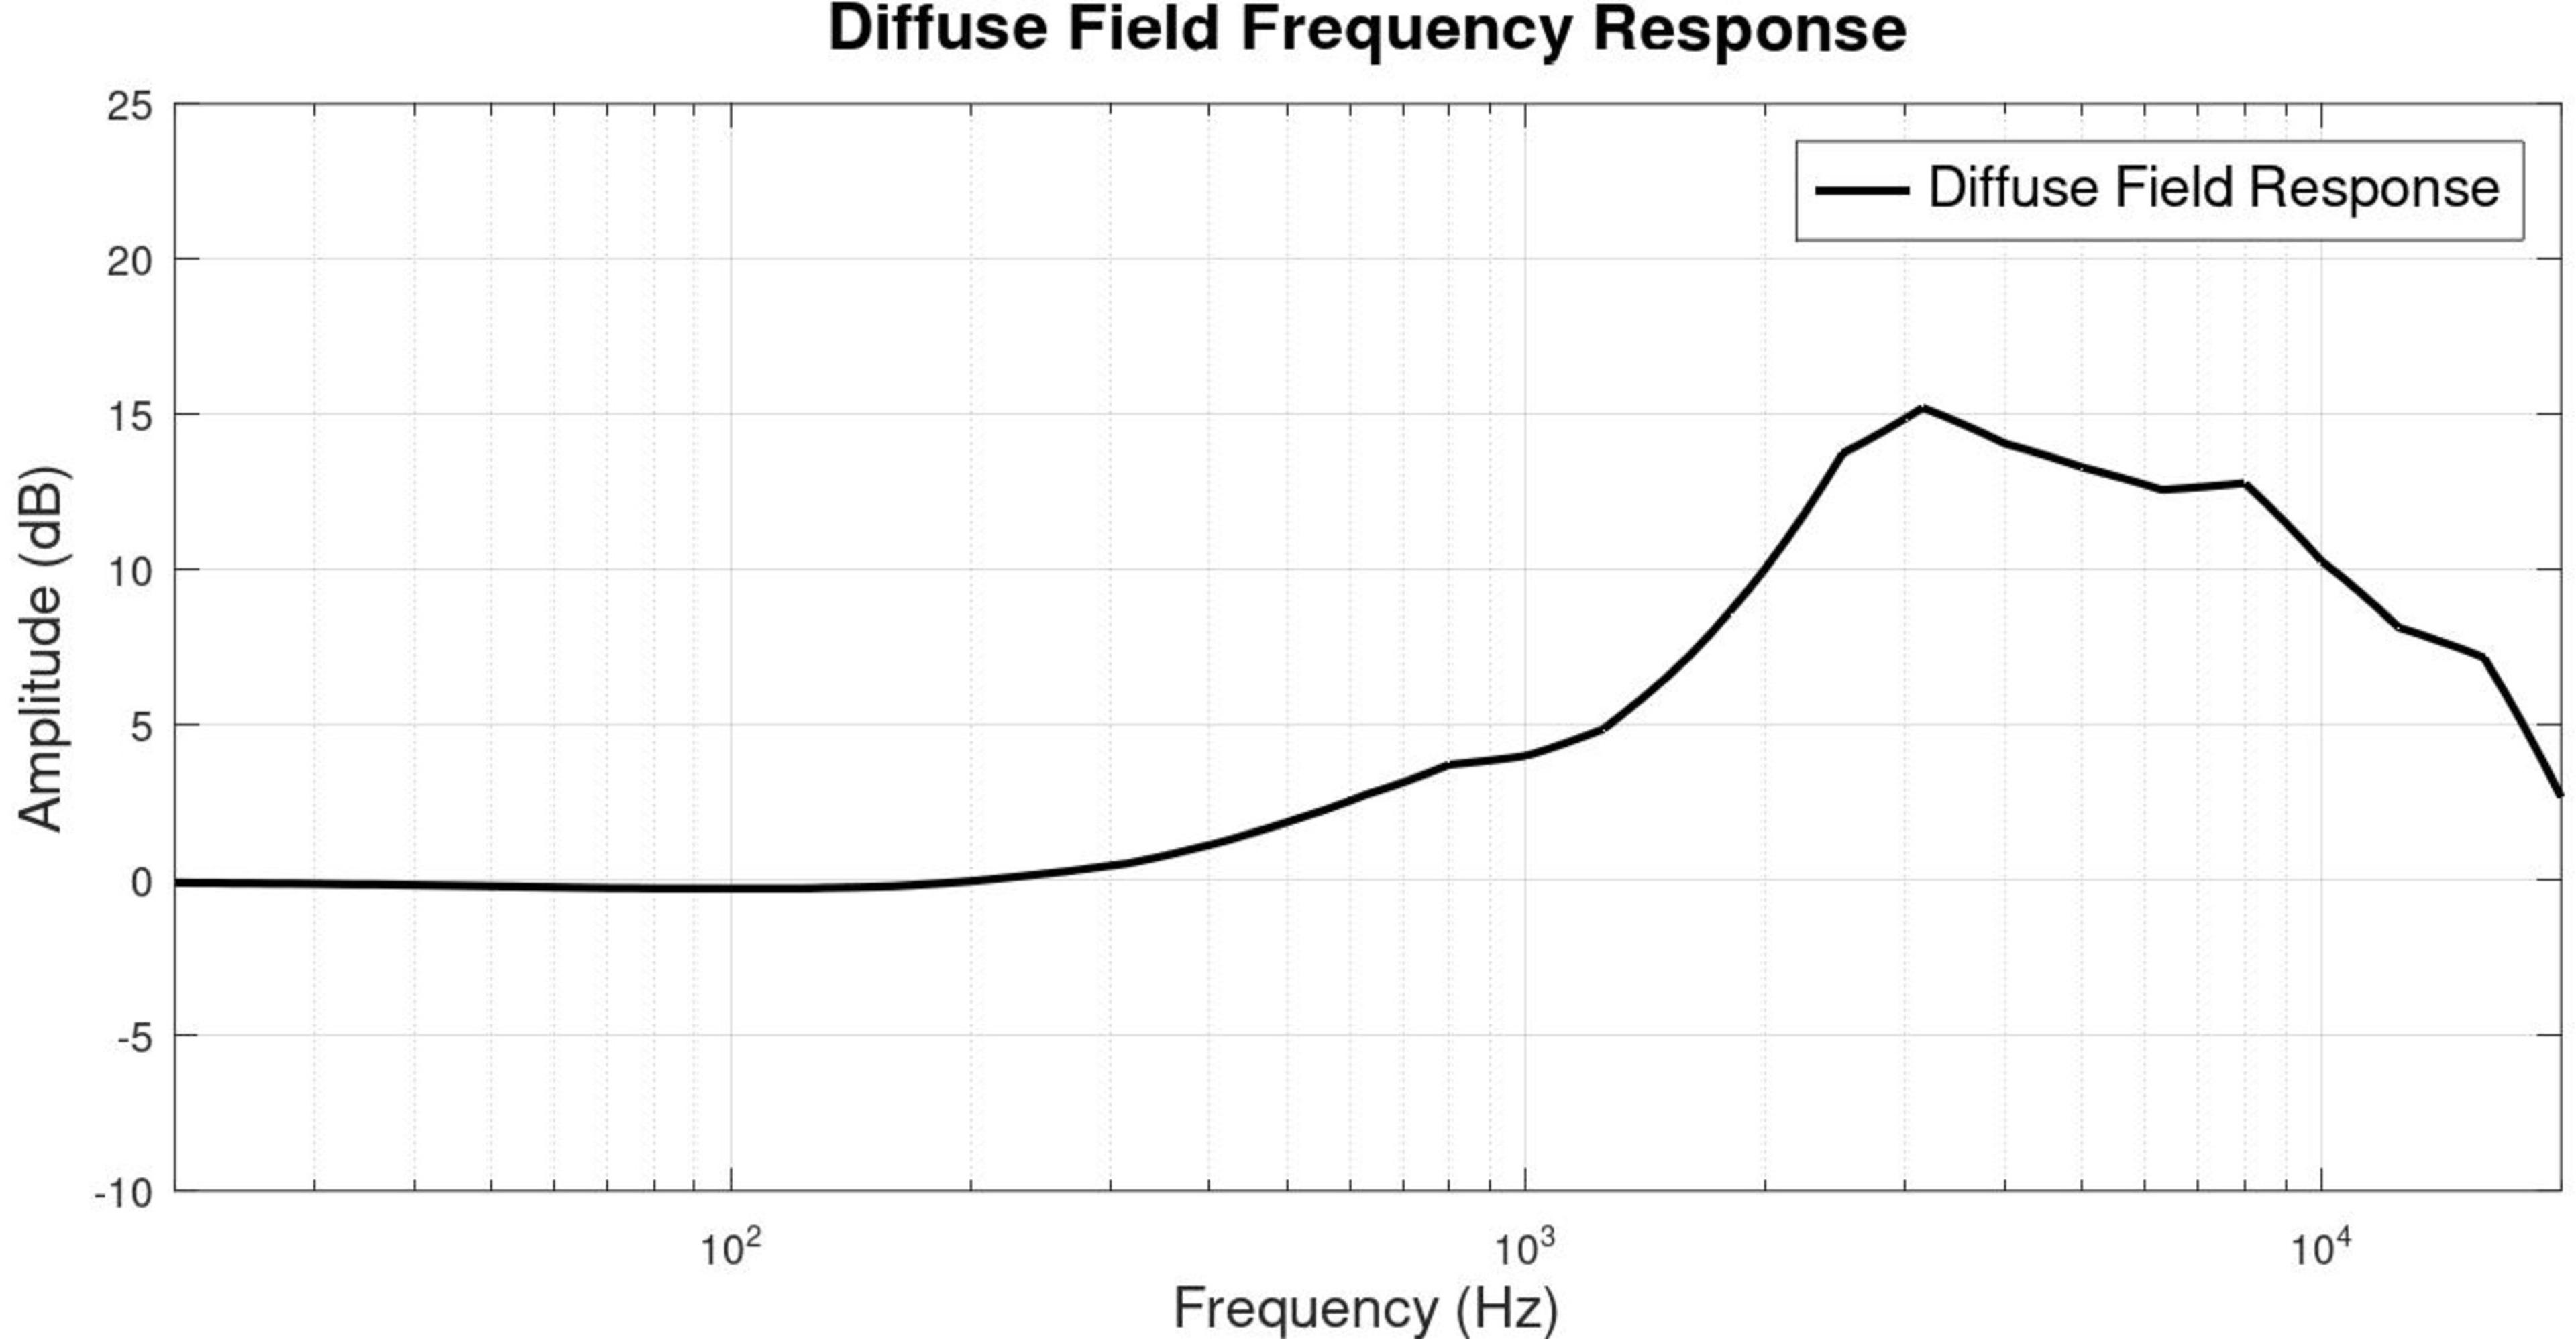
The first choice was to start with the 5128's known frequency response in a flat diffuse field. A diffuse field is when the sound pressure is equal at any frequency from any direction—in other words, a theoretically perfectly reflective room.
The graph below shows the response of the ear simulator under these conditions. The peak in the response is the HRTF (Head-Related Transfer Function)—how the HATS' head and artificial ears affect the sound as it arrives at the eardrum. You may have heard the terms ear gain or ear resonance. They're equivalent terms in the context of a HATS in a diffused field. It aims to reproduce a behavior representative of the heads and ears of real humans, but you won't necessarily have the same HRTF. We do know some measurements show less ear gain in real humans. These differences amongst individuals don't matter so much as the graph serves merely as a quantifiable reference. Our model isn't based on absolutes; we're after a preference curve.
Harman's research starts with the concept of good speakers in a good semi-reflective room and how sound reaches the eardrums under these conditions.
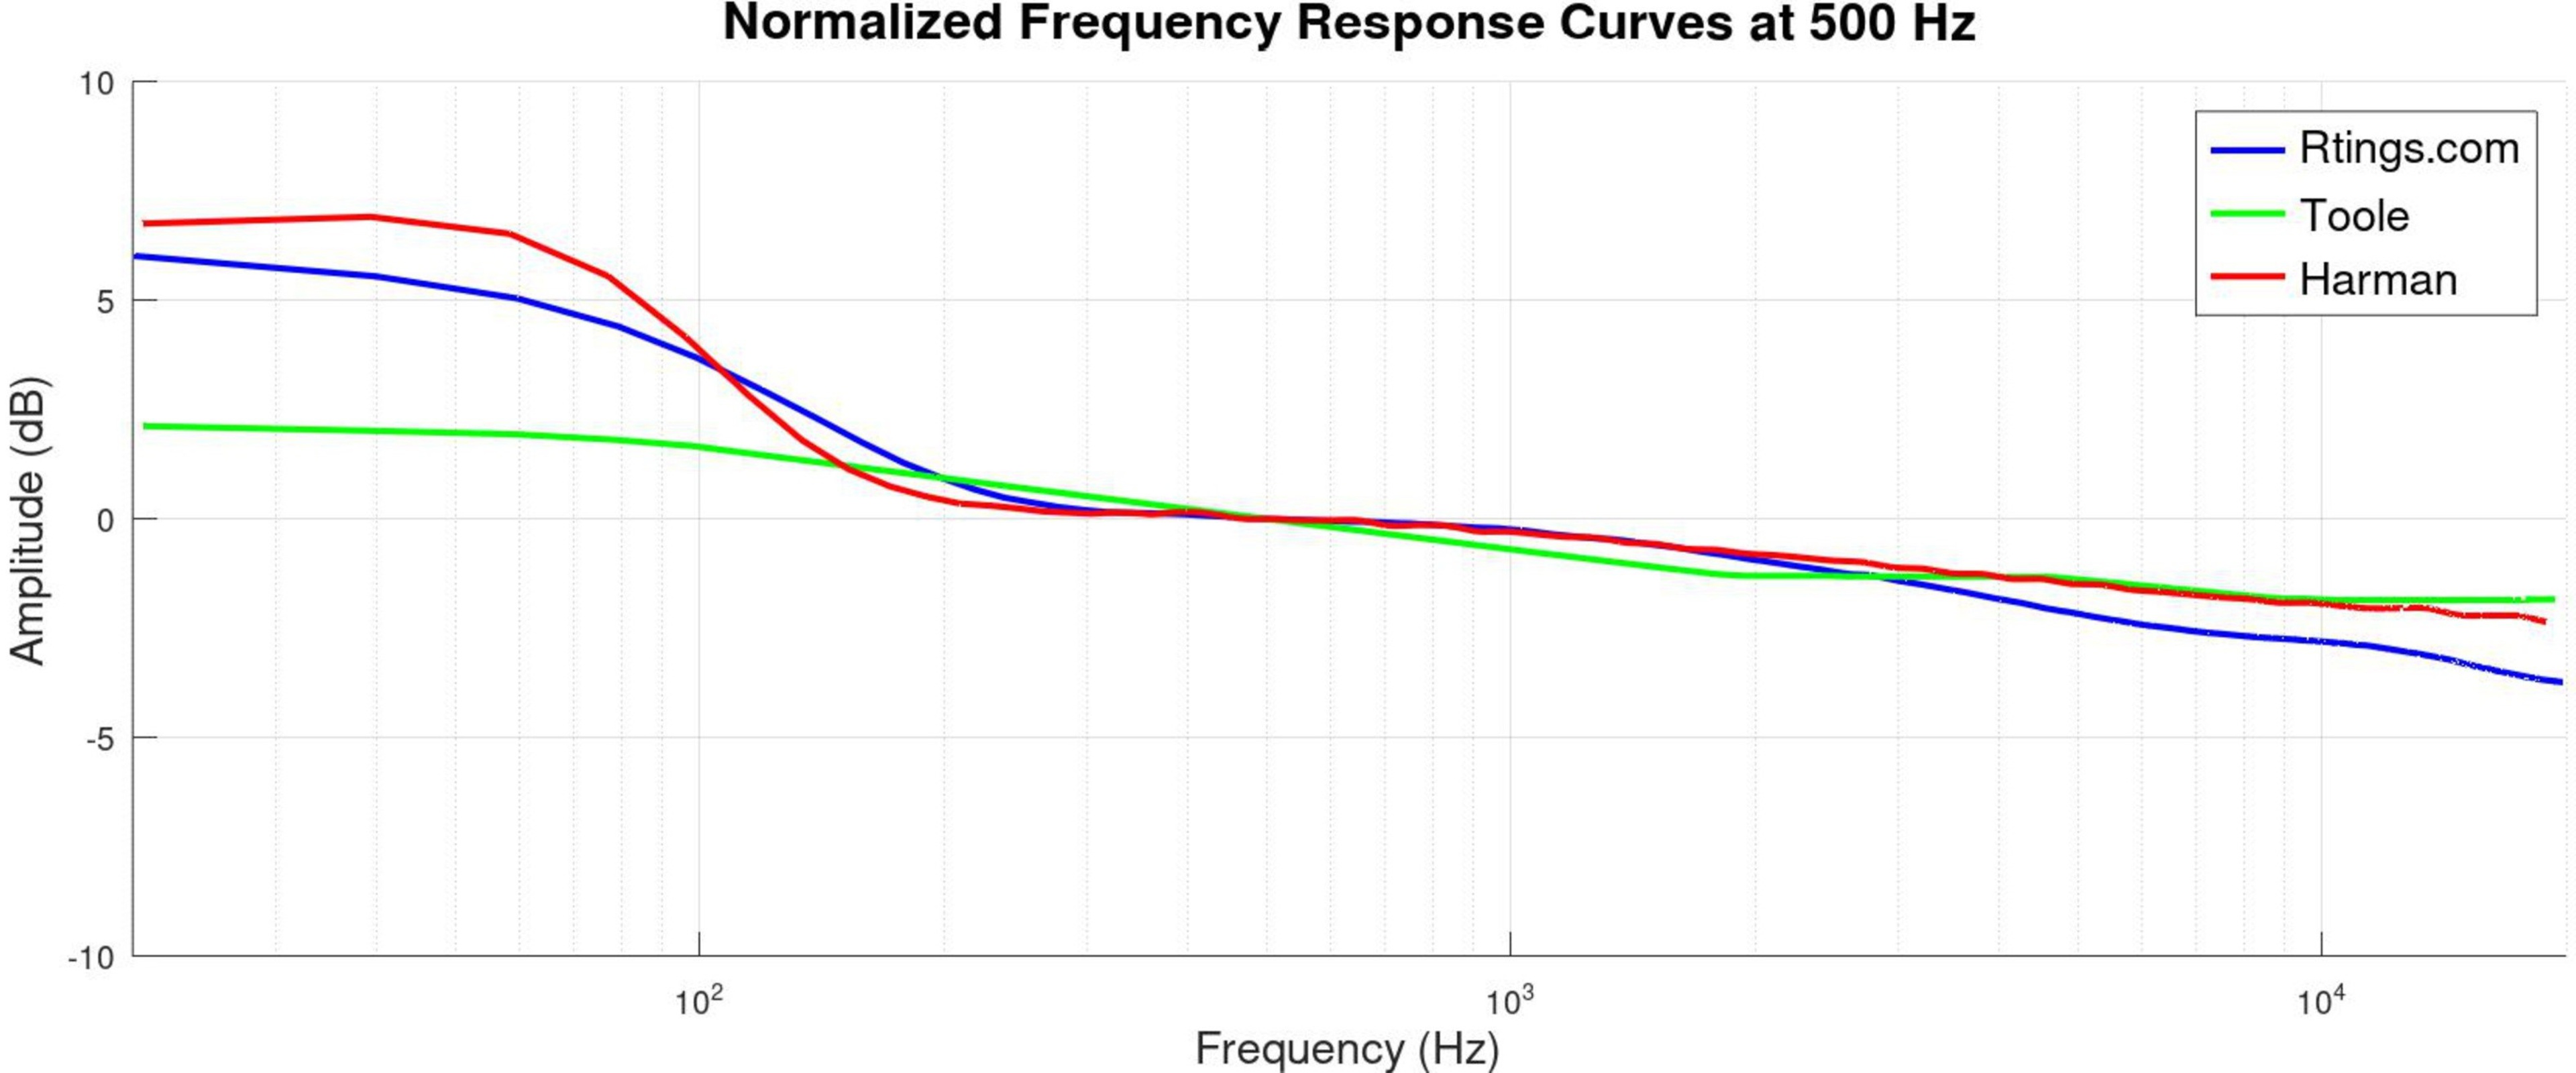
A known behavior of speakers in a room is that early reflections will induce a tilt in the frequency response. How much of a tilt depends on the specific room. That said, there are known target curves for speakers that are backed by research. We settled for a 6 dB tilt over the audible band, mainly to stay consistent with our own speaker target curve and some published speaker targets by Dr Floyd Toole and Harman.3,4
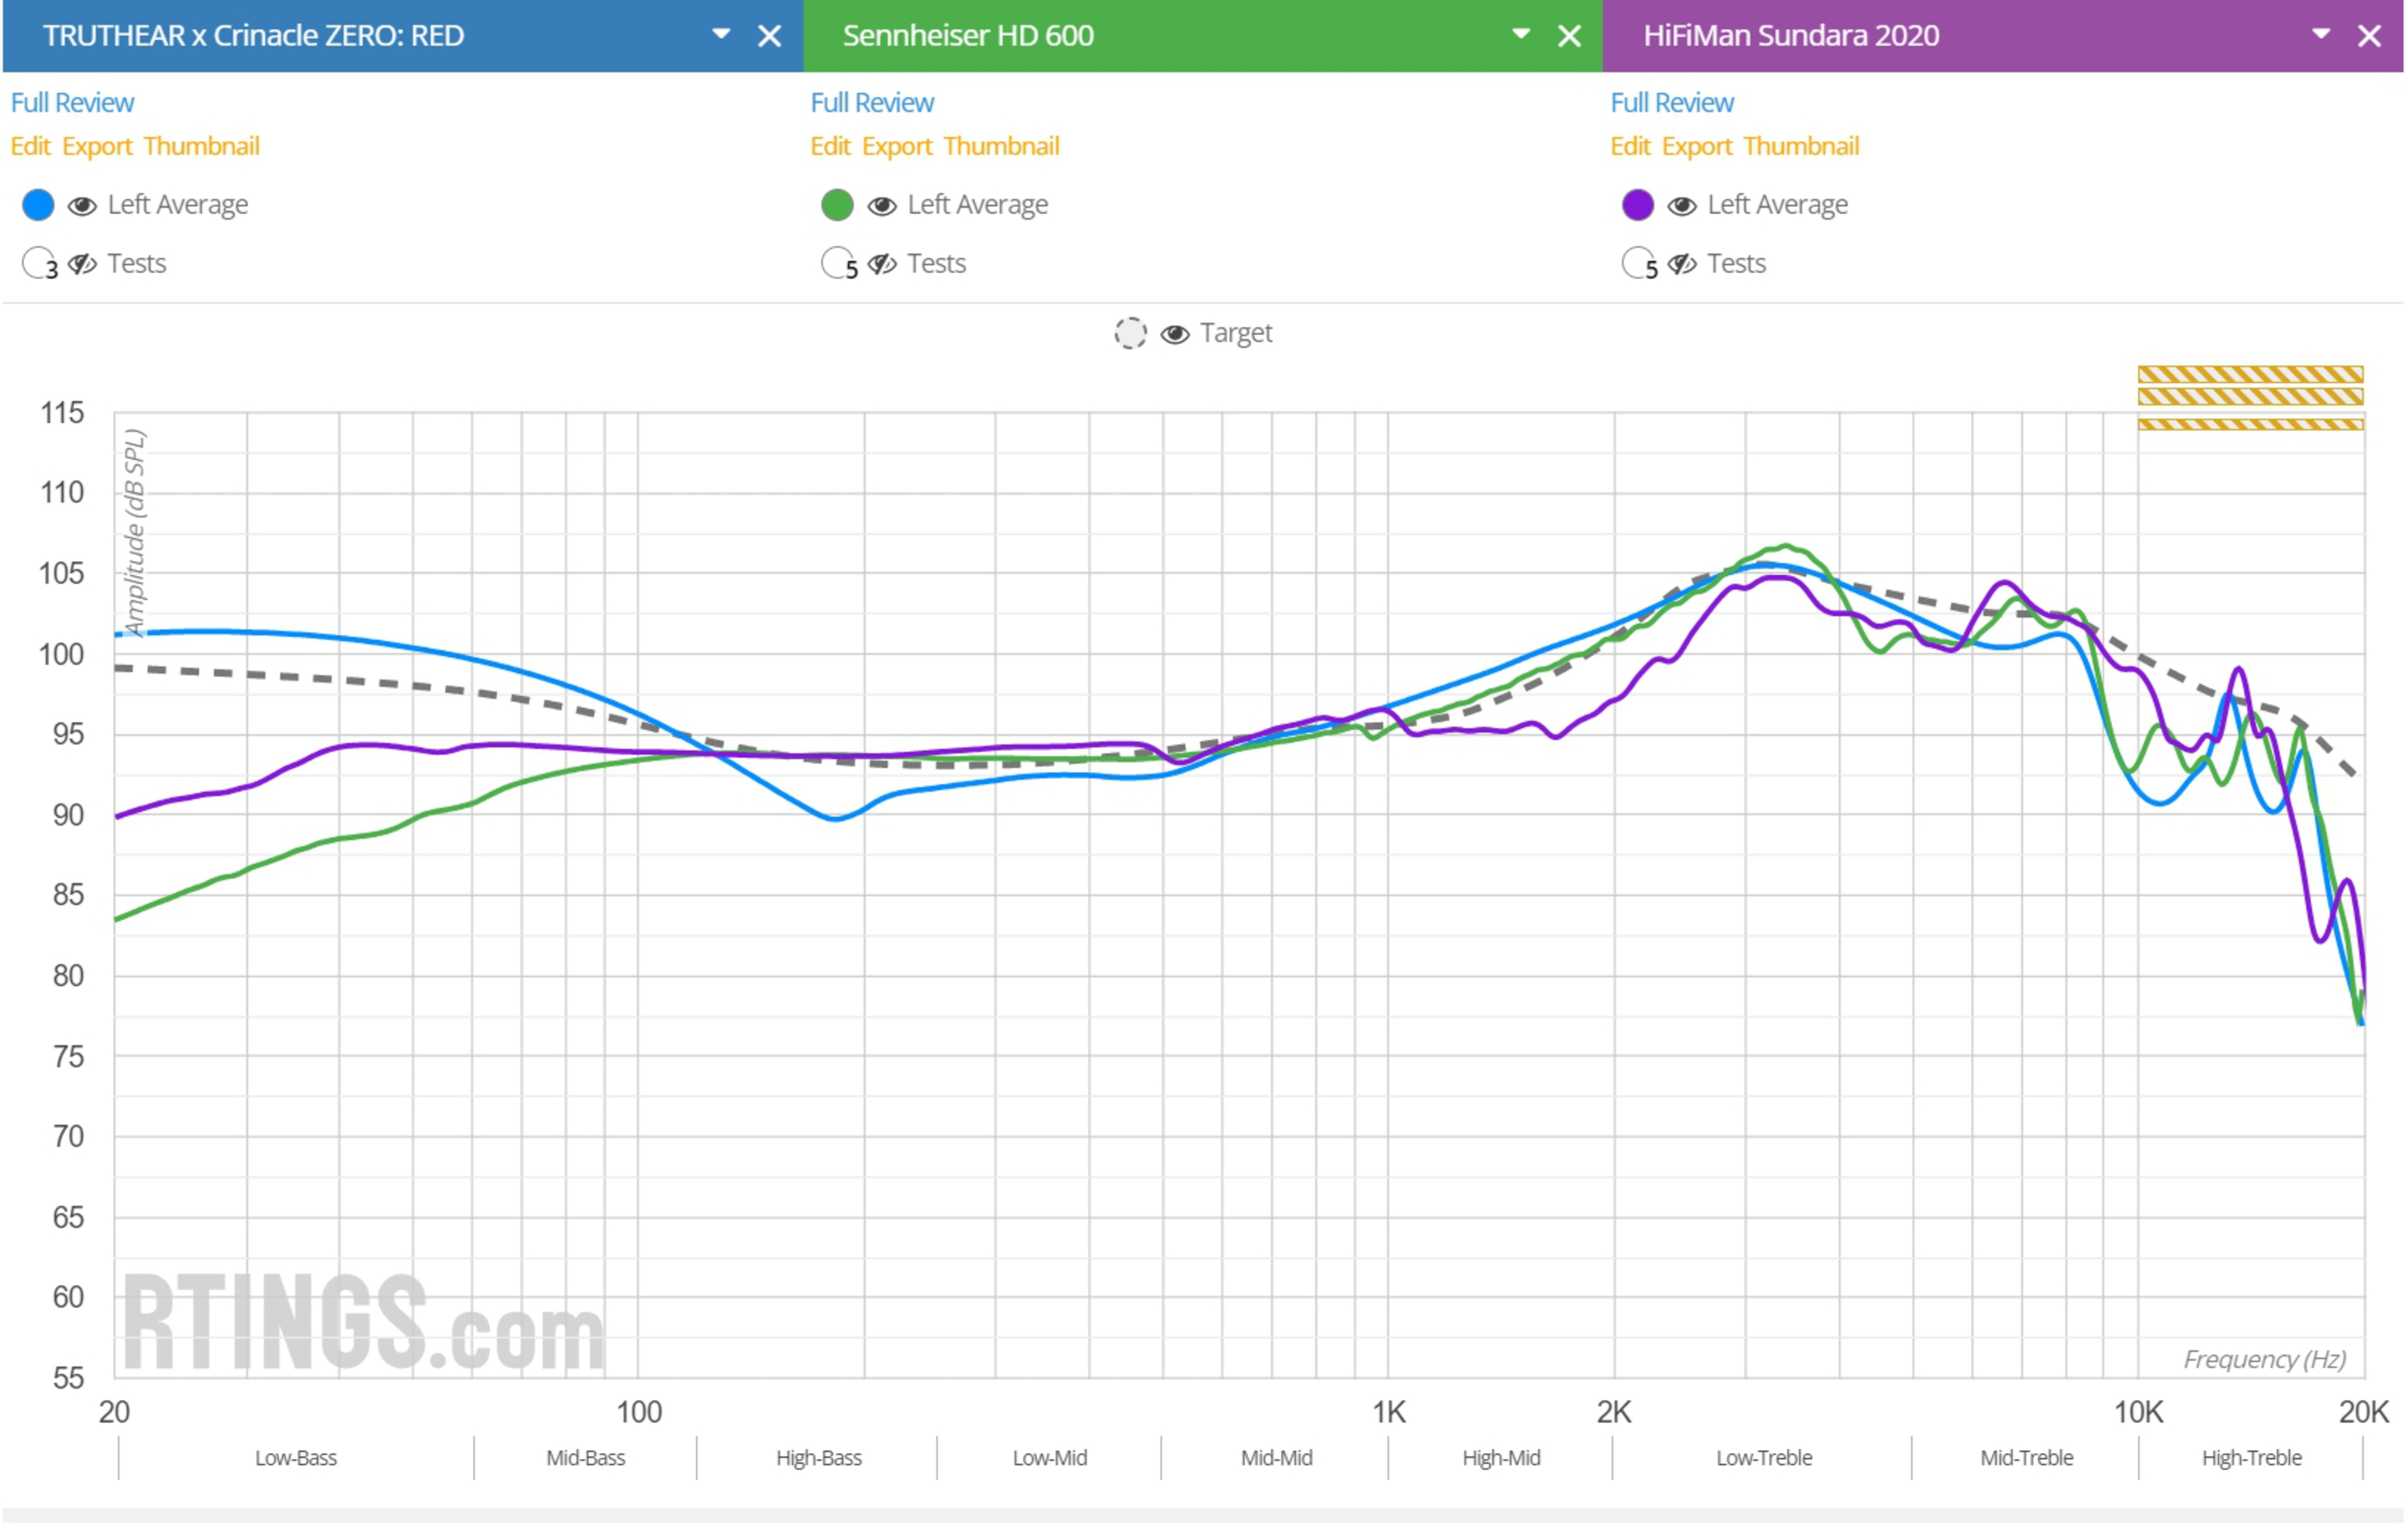
It's also a tilt value that made our target match closely with some known Harman-compliant headphones and earbuds in the mid- to treble range, like the TruthEar Crinacle ZERO: RED, the Sennheiser HD 600, and the HiFiMan Sundara 2020. Of course, those are just visual sample checks. Again, let's remember the premise introducing this section.
The third design choice concerns the bass boost. As there's no theoretical difference in the bass region of the diffuse field response of the 5128 and the GRAS rig used by Harman, we opted to use a bass shelf similar to Harman's to achieve a general sound signature. Since we aren't starting with their in-room response but rather a tilted curve, there are small differences in the bass region, but you get the point by now… it's okay. But didn't we tell you that both HATS measure differently? They do, but the difference between the measurements aren't consistent and repeatable across different headphones.
We also applied a significant amount of smoothing to the curve (1/6th octave). In this case, the initial Diffuse field response is already devoid of significant peaks and dips. Still, as a generality, a smooth response is more representative of the general tonality we are after in a target. Let's note that the frequency response measurements themselves don't use the same smoothing. We use 1/12th octave, which allows for a better inspection of the variations in the response.
So you have it in its essence: a simple approximation of what a majority will find a balanced tonality for headphones—no more, no less.
What Does It Mean For You?
This update to the headphones test bench isn't so revolutionary; we aren't concluding that personal preference makes all headphones equally good sounding. There are definitely headphones that sound "off." There are also sound profiles that are more in line with a balanced spectral presentation. However, we're moving in a direction where the idea of neutrality may or may not be what you are after, and both choices are valid. Our reviews will still provide a Neutral Sound score, but we are gradually bringing in a more descriptive assessment of the sound profiles. We encourage you not to focus on how a pair of headphones scores for Neutral Sound. Rather, look at the Sound Profile graph, see if it suits your taste, and assess if the bass and treble amounts align with your preferences. The target is just an indication, not an absolute measure of sound quality.
You'll also notice that with this test bench update, we went with a single target for headphones and in-ear monitors (IEMs). We opted for this simplified approach as it isn't yet fully understood how IEMs appear to show more differences in bass response between the IEC 711 couplers and Type 4620 ear simulators. We simply don't have strong enough evidence that an IEM target should be significantly more V-shaped.
Nonetheless, what is important is that there's a baseline from which you can work out if a device's sound profile is right for you. If it's any indication, most well-liked IEMs do quite well with our current target!
Our terminology and scoring also reflect the new direction with Headphones v1.8. Here are a few notable updates:
- The sound profile box now shows the frequency at which normalization (zero crossing) was applied.
- Frequency response measurements are now made at 94 dB SPL, which aligns more with accepted standards (IEC 60268-7).
- The terminology is updated to reflect the new direction. "Compliance to Target" replaces Bass-, Mid- and Treble Accuracy. (We're gathering the same measurements, but words matter).
- Similarly, "RMS Deviation" replaces "STD Error" to better align with our views.
- Scoring on RMS Deviation now penalizes small deviations to a lesser degree. This follows from the idea that some margin of deviation shouldn't be considered a flaw.
- Peaks and dips are now scored as an objective metric, and now contribute to the Neutral Sound usage score.
The Relevance of Previous Research
We want to wrap up this article by giving appropriate credit to headphone sound quality researchers and commenting on the state of the art. There have been some real challenges in the field of reproduction of audio through headphones, and enormous leaps have been accomplished, resulting in a large body of work that pushes the knowledge of audio fidelity characterizing standards. This work has benefited everyone, making the music that gets to our ears more enjoyable.
Circle Of Confusion
The circle of confusion. This well-known concept in the audio engineering circles, first put forward by Dr. Floyd Toole3, is based on a simple idea that makes a great deal of sense: if the listening conditions were standardized when audio content is created, we could use the same standards to reproduce it. The result would be that everybody would enjoy audio content as it was intended to be presented.
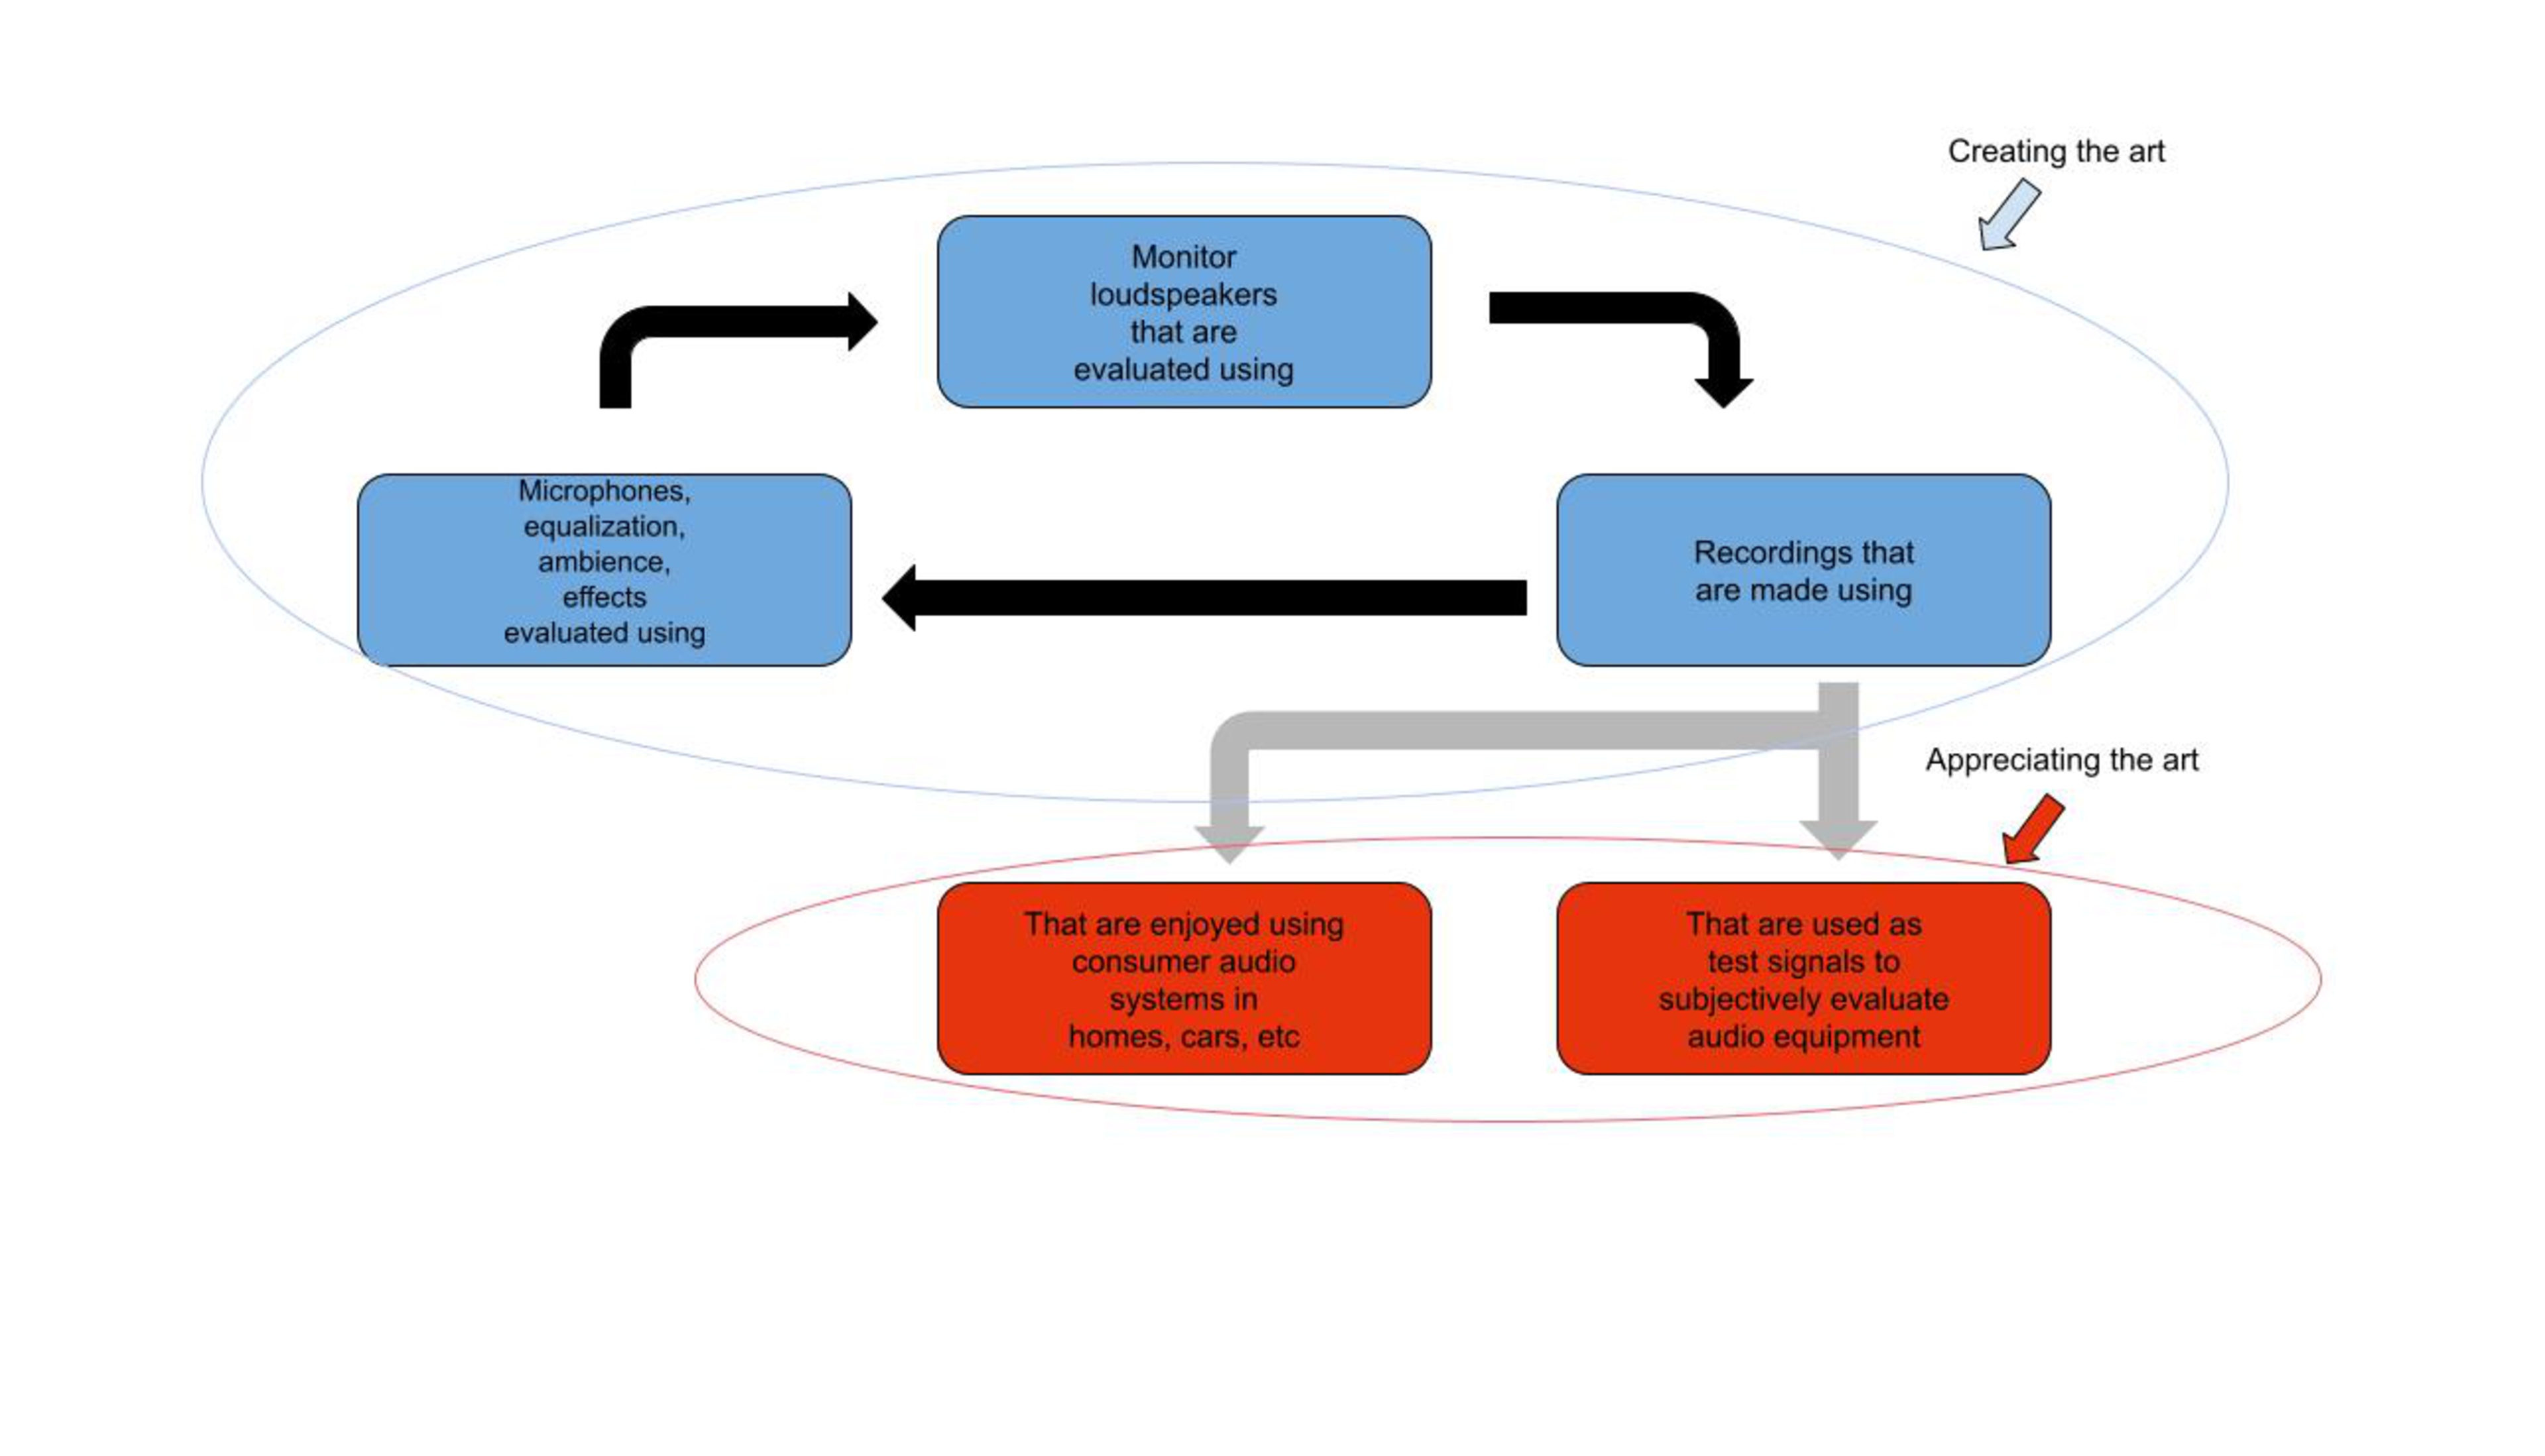
Without that, we're in a vicious cycle where listeners can't know how content is supposed to sound, and the creators can't know how people will enjoy their content. Thinking that all headphones should conform to a standardized sound profile, in this context, isn't a realistic design goal and not one that's desirable, either. We don't think it's the goal of any of those studies. Nobody can be against better sound quality for all, and we are thankful for everybody working in this direction. Ultimately, we all have the same objective: helping you get the headphones or earbuds that will produce the best sound (for you).
Harman Research
We can't write an article about headphone listening tests and target curves without mentioning the pioneers of headphone research. Headphone sound quality characterization would still be in its infancy without the work of Dr. Sean Olive, Todd Welti, and the team at Harman. As previously stated, the target curve we are implementing in Headphones v1.8 is closely in line with what Harman proposed without being a direct translation since their testing conditions and in-room response can't be reproduced.
We also agree with the fundamentals (and most of the fine print). A preference-based approach is a good way to develop a valid target as long as the "circle of confusion" isn't solved.
While we fully endorse Harman's methods, they have some limitations. Indeed, the thing about preferences is that they vary—a fact that's clearly demonstrated in our own listening test. We understand the incentive to evolve toward a "neutrality" standard, and to their credit, Harman has tested hundreds of subjects over the years to arrive at their target responses. Perhaps a method of adjustment where listeners have full control of bass and treble levels is the most unbiased way to test listeners' preferences. However, such a method will also, by its nature, converge to a single result when averaged. We also can't know if the final curve would have been slightly different had they started with a different in-room response. Or if some people would have chosen a certain tilt if they could have. What we take from all of this is that an approximation based on simple operations on the diffuse field response may very well be good enough. Some may consider that the research is fully complete and that the "best" frequency response for headphones is already set in stone. However, we need to keep in mind what "preference" means. Harman themselves had a significant variance in listeners' preference.2 For example, according to Harman's own findings, the bass amount preferred, while largely in line with their target level for the majority of listeners, still shows a 36% proportion who find this baseline either too much (21%) or would prefer more (15%). Our motto won't change; we're committed to helping you find the best headphones for your needs (or preference), hopefully for 100% of you, not 64%.
On The Type 5128 HATS
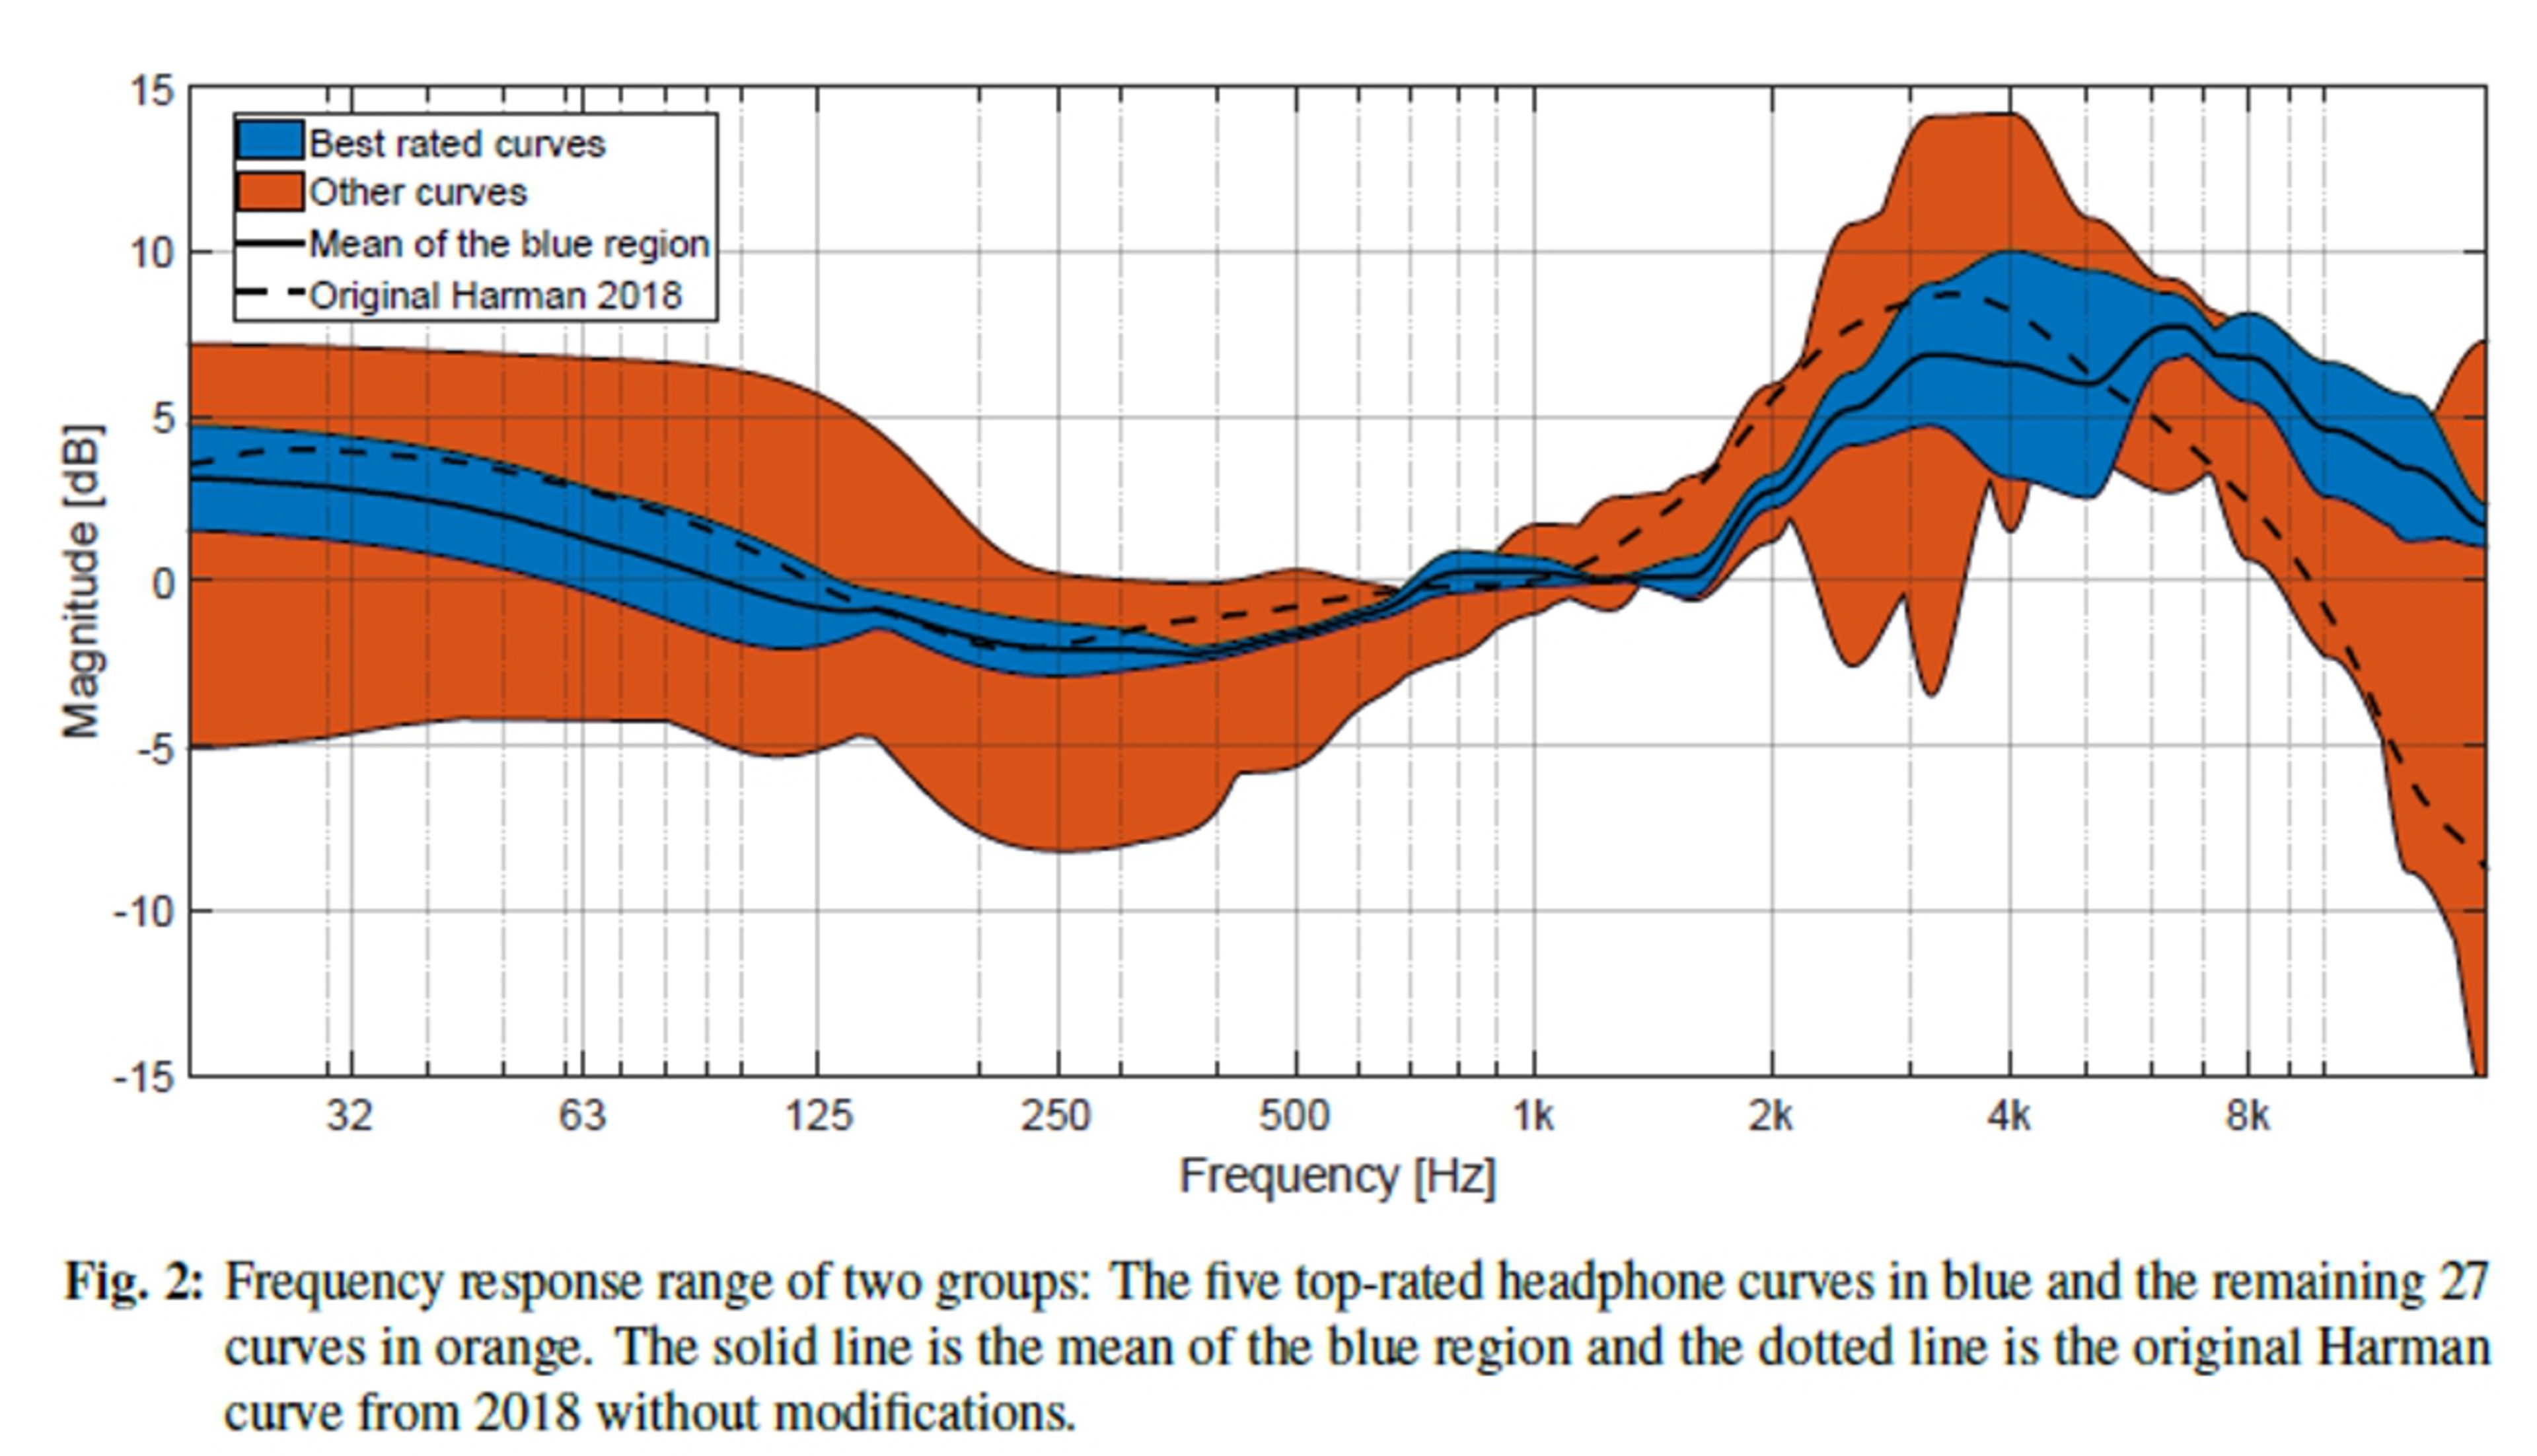
As we said before, very minimal data exists with which to make the new target for the new test fixture. To the best of our knowledge, only a single formal study has been done on a preference target for the Type 5128 HATS. The publication, An Over-Ear Headphone Target Curve for Brüel & Kjær Head and Torso Simulator Type 5128 measurements, was a joint effort between Senselab Force Tech in Denmark and The University of Aizu in Japan. Their work includes the evaluation of 32 different frequency response curves by 56 participants. It's similar in approach to the listening test we performed, but having so many outliers and odd curves allowed the authors to pick the "best" five to calculate an average. Their research does not conclude in a single "winning" curve, which aligns with our findings. Furthermore, the considerable delta in the bass and treble range in the five preferred curves, as seen below, is reassuring for our own conclusions since it brings the idea of a range of valid frequency response curves.
Believe In Your Preferences
There you have it. It's impossible to completely dissociate perceived headphone sound quality from subjectivity; even the most extensive research is based on that fact. Where there's subjectivity, there will be divergence of opinions and preferences. RTINGS.com will continue to value new developments in the quest for the best fidelity, and there's room for more research.
We view Headphones v1.8 as an important stepping stone. We'll build on this work as we transition to a flexible frequency response graphing tool for v2.0. Our goal is for you to be able to visualize the sound profiles compensated to many known preference targets and some calibrated responses like the diffuse field response. So, to all our colleagues in the headphone testing and research community, when more valid target curves are studied and designed around the Type 5128 platform, we'll definitely consider publishing them!
In the meantime, we want to state again that we aren't proposing a world where manufacturers can come up with just any response and not be judged. We need a reference, and this target that we're bringing you today is our small contribution. But having a reference doesn't mean a signature that deviates from that can't be well-executed and pleasing.
Try equalizing some of the headphones we measured to this target; let us know your thoughts! Also, let us know what you like in headphone sonics; it's a fun hobby in which we can all choose the products that provide us with the most enjoyment.
We hope that you'll like the updated reviews. As always, we want to hear from you; your feedback is key to how test benches evolve!