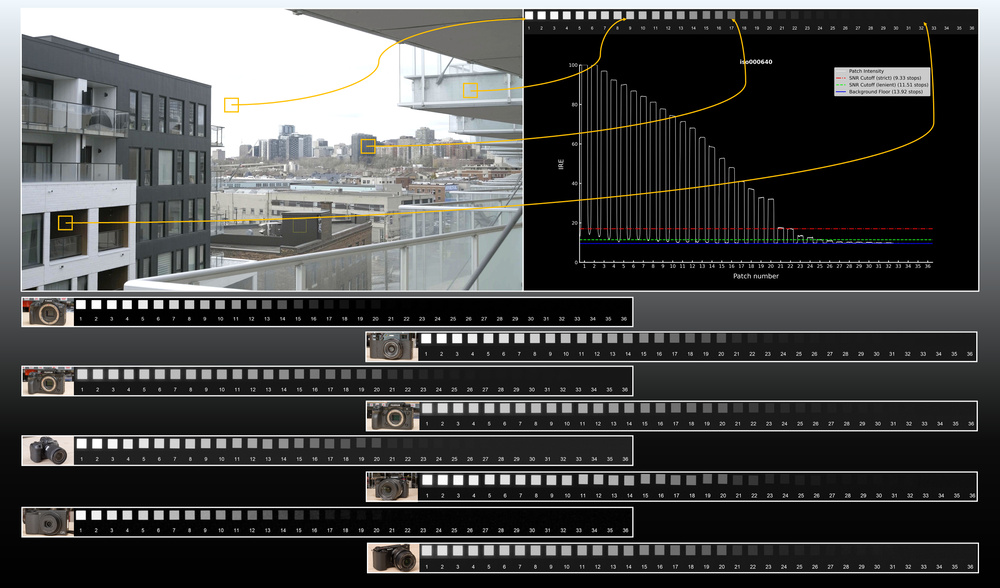
A good camera captures as many details as possible, regardless of shooting conditions. It's why manufacturers aim for their cameras to have a wide dynamic range; they won't clip details in bright highlights or lose details to background noise in the shadows. From what we've discovered in our testing, the video dynamic range that manufacturers claim isn't always what it seems.
We developed a methodology to evaluate a camera's full video dynamic range while factoring in noise to see if the numbers claimed by manufacturers really are accurate. Turns out that they are, but they also aren't. Using our methodology, we also observed that, in terms of video dynamic range, some cameras prioritize a greater full dynamic range regardless of the noise. In comparison, others are less noisy at the expense of a smaller video dynamic range.
This article explores how a camera's sensitivity and specificity impact its usable video dynamic range and how these concepts are intrinsically connected. Sensitivity refers to how effectively a camera detects light signals, while specificity reflects its ability to capture the expected value of a signal accurately. Striking a balance between sensitivity and specificity is crucial for maximizing dynamic range, as often, prioritizing one comes at the expense of the other. This trade-off ultimately depends on your preferences regarding acceptable noise levels and the amount of detail you're willing to sacrifice.
We also compare the video dynamic range of Log picture profiles with standard picture profiles, shedding light on their strengths and limitations. While Log profiles offer greater dynamic range by applying a logarithmic gamma curve to the captured scene, they come with challenges, like the need for post-processing. Understanding these trade-offs helps you choose the right settings for your creative and technical goals.
Claimed Dynamic Range Isn't Always What It Seems
A camera's video dynamic range isn't always what a manufacturer claims it to be, depending on what you consider usable dynamic range to be. One manufacturer might say that their camera has 15 stops of dynamic range, while another one claims it has 12 stops. Despite the advertised differences, both cameras may seem similar to you—if so, this might be due to how the dynamic range is measured.
Factoring In Noise While Measuring Dynamic Range
When considering video dynamic range, the point at which the signal saturates—or, in other words, the point where the highlights clip—is usually easy to determine. However, the lower threshold, which is the point at which the signal is lost to noise, is a bit trickier to determine. Many manufacturers measure dynamic range with a lower threshold that, in real-world usage, would be considered unusable due to the amount of noise present (despite still being able to make out some details).
For example, Sony claims that the Sony α 7 IV has about 15 stops of video dynamic range. Similarly, Fujifilm claims that the Fujifilm X-T4 has about 14 stops of dynamic range. It turns out this is fairly accurate, but only if we don't factor in noise. Looking at our results for both cameras, we measured 13.92 stops of dynamic range, which you can round to 14 stops.

We used Imatest's 36-Patch Dynamic Range chart with the DarkWorld Mask to measure video dynamic range. This chart has 36 patches with a fixed number of stops between each patch. We record a video to evaluate the dynamic range of a camera. Using 30 frames of that video, we measure the signal intensity of each patch. Patches 33 to 36 are used to define the dark background level of the image as they are the darkest patches of the chart, and their value is four stops lower than the 32nd patch. With the background level established, we count the number of patches that are above the background level. The following figures present the lined-up chart for the Fujifilm X-T4 and the Sony α7 IV at ISO 800.


On our chart, a dynamic range of 13.92 stops corresponds to the interval between the 2nd patch and the 30th patch. Even though some signal intensity is detected in the 30th patch by both cameras, when we look at the chart, the last few patches are hard to distinguish from the background. This means the faint signal intensity, indicating details in a real scene, could unfortunately be lost to the noise of the dark background. Therefore, the dynamic range stops before the 30th patch, meaning it doesn't quite hit the 14 stops of dynamic range as advertised, but it's pretty close.
Establishing Signal-To-Noise Thresholds To Evaluate The Usable Video Dynamic Range Of A Camera
To address the impact of noise on the video dynamic, we established two distinct thresholds that factor in the noise using signal-to-noise ratio (SNR). We defined a strict threshold and a lenient threshold. For the strict threshold, the value of the noise must be lower than 6% of the value of the signal intensity of a measured patch (SNR 16.67:1). For the lenient threshold, we allowed the noise to be a bit higher compared to the signal. The noise must be lower than 14% of the value of the signal intensity of a patch (SNR 7.14:1). We established the strict threshold to indicate the number of stops at which point the noise starts to become visible. The lenient threshold allows some noise to be visible, but details in the low shadows should still be distinguishable. Finally, the background floor represents the mean intensity of the signal of the black patches from 33 to 36.
For the following waveforms, the legend box indicates the number of stops for each threshold.
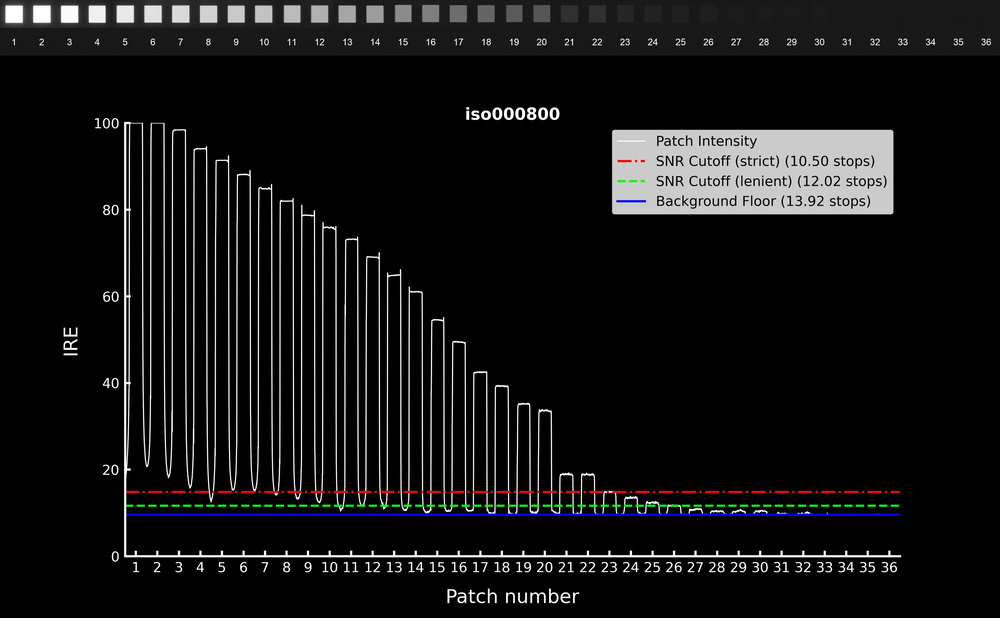
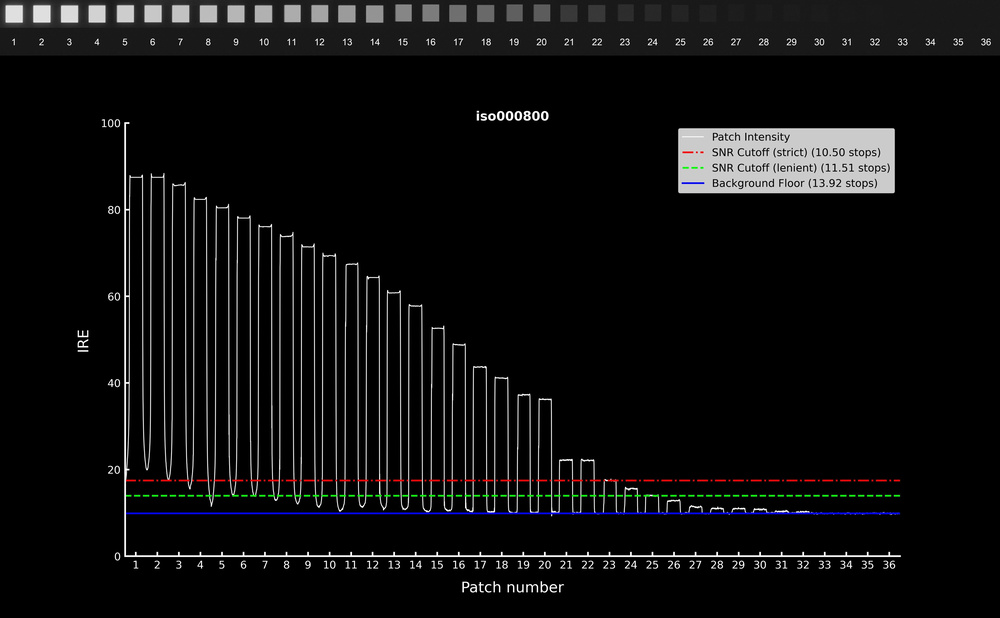
Looking at these waveforms, the full video dynamic range of each camera is indicated by the blue line, representing the number of stops of light above the dark background level. We also evaluate the video dynamic range based on the strict and lenient thresholds to better understand each camera's usable dynamic range. Looking at the results, we see that the usable dynamic range of the Fujifilm X-T4 and the Sony α7 IV is around 10.50 to 12 stops, depending on the threshold.

Using strict and lenient thresholds to factor in noise when filming with a camera gives a better idea of its usable video dynamic range, which differs from the full dynamic range usually advertised by manufacturers. Factoring in the noise gives a better idea of the dynamic range we realistically get when shooting a scene. In other words, a camera's usable video dynamic range will depend on its capacity to detect faint light signals and how the camera manages noise.
Sensitivity Vs. Specificity Of A Camera
The limiting factor of a camera's dynamic range is its sensor. For the camera to get the most out of a faint signal of light in a dark area of a scene, the sensor must be as sensitive as it can be. Unfortunately, in imaging, high sensitivity also correlates with the apparition of unexpected signals. In the case of a camera, an unexpected signal is a pixel with an intensity value that differs from the true value it is supposed to have. The following figure shows a dark patch from our chart that's supposed to be black and uniform. The right part of the image is the same patch but with increased brightness in post-processing.

The patch's base level of intensity is pretty low since it's supposed to be black. However, when we increase the brightness, we can more easily see the underlying variation in signal intensity. Even when little to no light hits the sensor, the electronics still generate noise.
When developing an imaging system such as a camera, its sensitivity must be calibrated. A highly sensitive camera might be able to detect fainter light signals when they are present, but it might also be noisier. This is where specificity comes in. In imaging, specificity corresponds to the capacity of a camera to correctly detect signals at the right intensity that are actually in the scene. A more specific camera will usually be less noisy but might sacrifice faint details in the low shadows.
Great cameras will be able to be sensitive while still being specific. For example, the figure below shows three hypothetical receiver operating characteristic curves (ROC curves). These curves indicate the correlation between sensitivity and specificity. A great imaging system will have a curve similar to the green curve. In this case, the camera would be highly sensitive while being pretty specific, which means that the registered value of a captured signal should be close to the expected value even when the intensity of the light is faint. An okay imaging system would have a curve like the orange one, while a mediocre system would have a curve similar to the gray line.
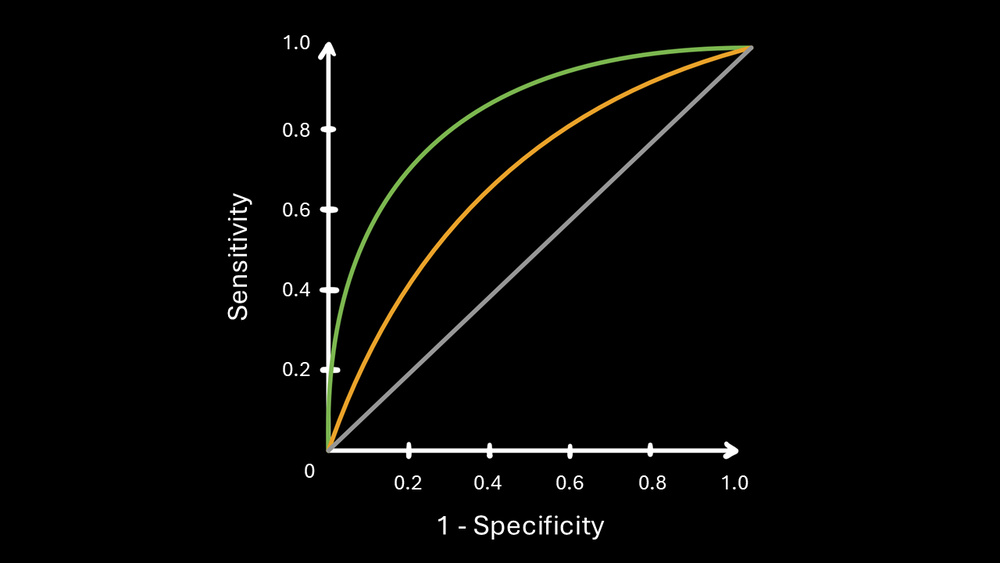
The best sensor will have a higher area under the curve. Although two sensors could have the same area under the curve, they could still output different dynamic range results because they don't manage sensitivity and specificity the same way. For example, the figure below shows two hypothetical ROC curves with the same area under the curve, but they aren't the same.
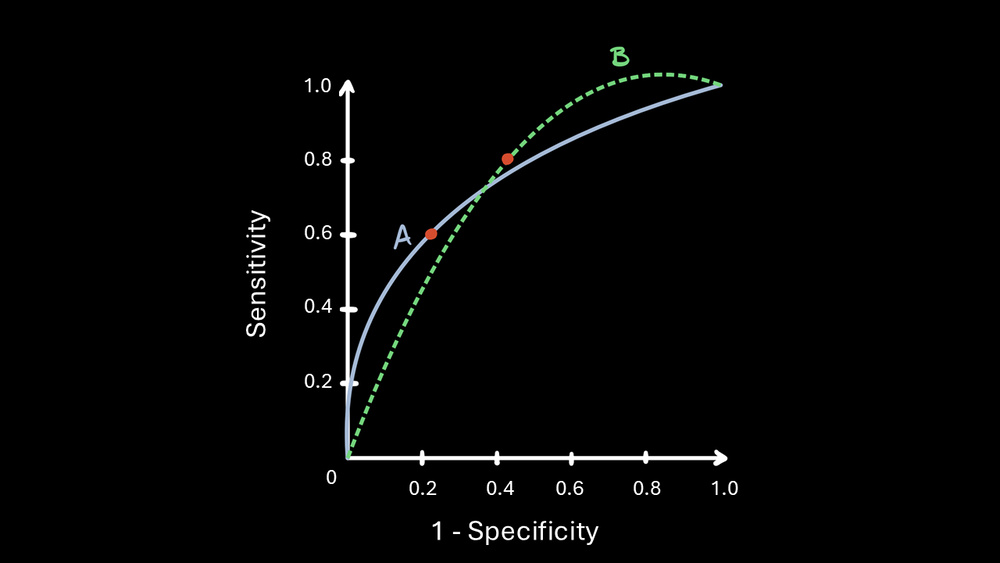
The A curve is more specific at lower sensitivities than the B curve. In contrast, the B curve is more specific at higher sensitivities than the A curve. For example, Camera A could be calibrated to have a sensitivity of 0.6, making it pretty specific. In the case of Camera B, it manages to be specific at a higher sensitivity than Camera A. Calibrating Camera B to have a sensitivity of 0.8 would make it a bit less specific than Camera A at a sensitivity of 0.6. This means that Camera B can capture fainter light signal than Camera A. However, since it's less specific, the registered value for this faint signal might not be accurate and would fluctuate around the expected value. Compared to Camera B, there would not be any advantage to calibrate Camera A at 0.8 sensitivity since at this value, Camera A is always less specific than Camera B.
This indicates that even great cameras will have to prioritize a certain threshold of specificity depending on the sensitivity. It's impossible for a camera to be both perfectly sensitive and perfectly specific. Therefore, depending on the ROC curve of a camera, it could be more advantageous for a system to be less sensitive so that it can be more specific. Although to have good dynamic range, a camera must be sensitive enough to capture details in the low shadows while still being specific enough that those details aren't clouded by noise.
Should Sensitivity Or Specificity Be Prioritized?
As shown above, increasing the sensitivity of a camera will also decrease its specificity following its ROC curve. This raises the question: should manufacturers increase the sensitivity of a sensor at the expense of losing some specificity, or should they do it the other way around? Well, there's no right answer. Our test reveals that by releasing different variations of a camera or upgrading a specific model, they might change the sensitivity and specificity to better fit the new specs of a camera. Looking at both the Fujifilm X-H2 and X-H2S, we observed that the X-H2S has a higher video dynamic range than the X-H2. When factoring in the noise, however, the X-H2 actually has a higher video dynamic range than the X-H2S. When considering only the background floor, the X-H2S has a greater full video dynamic range. Therefore, the X-H2S might be more sensitive but also less specific, allowing the camera to capture more details in the low shadows while being noisier than the X-H2.

Interestingly, for other manufacturers, a decrease in sensitivity to prioritize the specificity of the camera might be seen as an upgrade. When looking at the Panasonic LUMIX S5 and Panasonic LUMIX S5 II, our results show that the S5 has a greater full video dynamic range than the S5 II. However, when you factor in noise, the S5 II actually has a greater dynamic range.

Using Higher ISO To Differentiate The Noise Level
While users can't modify the camera's hardware to change its particular calibration, increasing the ISO setting can increase sensitivity at the expense of specificity. In other words, if you want the camera to be more sensitive, simply increase the ISO, which will amplify the captured signal. However, doing so will amplify the underlying noise, resulting in a noisier-looking image. We discussed this subject in our article about our camera photo tests on photo RAW noise.
We tested a camera for every ISO available when developing our video dynamic range test. Using a higher ISO, it's easier to compare two cameras from the same manufacturer to determine which one is noisier since the noise is amplified. When looking at the waveforms of both Fujifilm cameras at ISO 12800, we see a greater fluctuation of the signal in the patches of the chart for the X-H2S, which can be translated to greater noise.
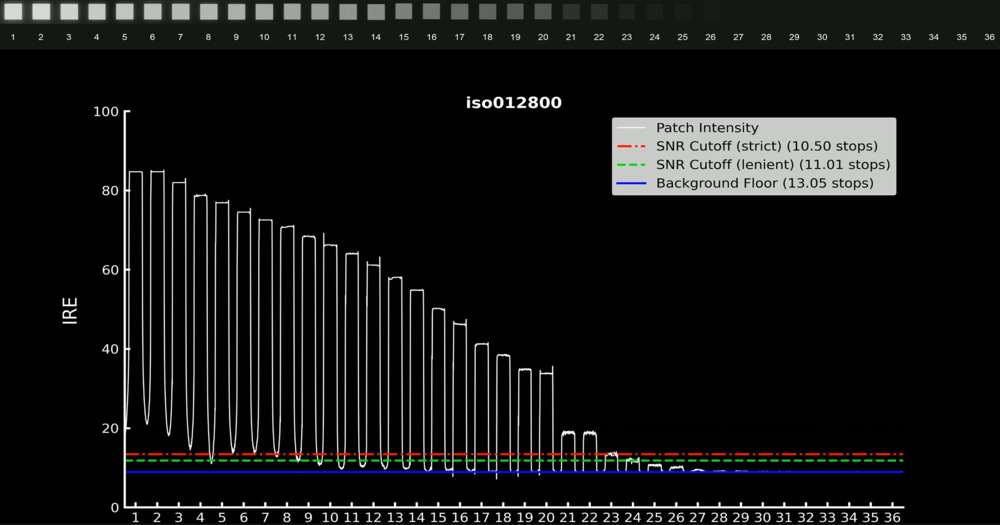
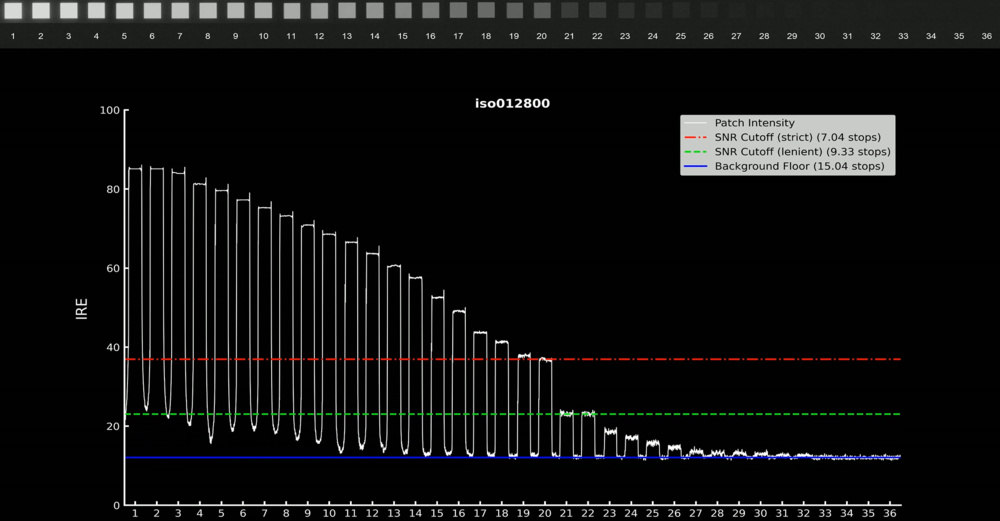
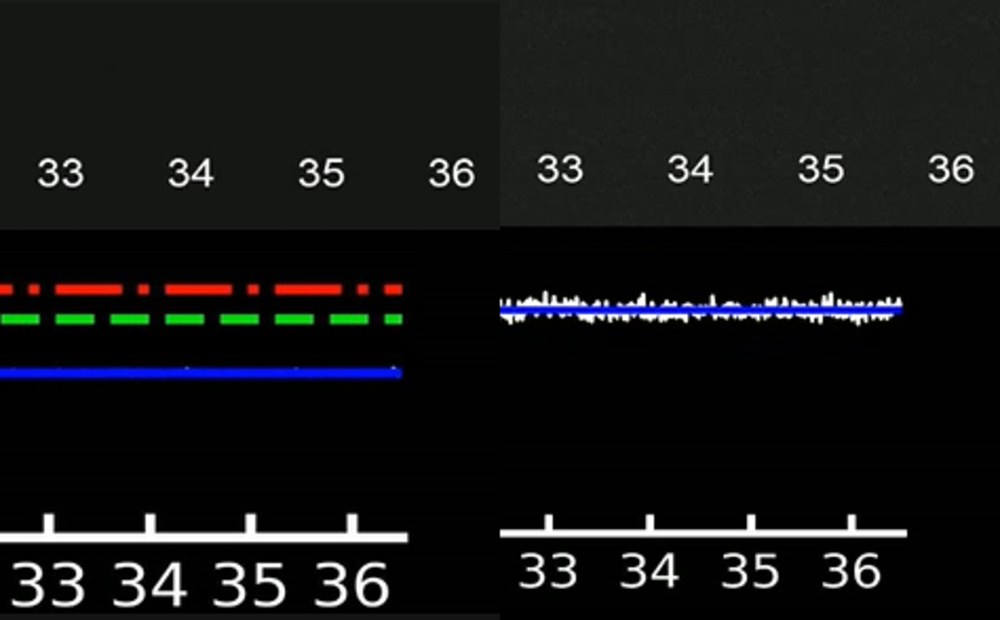
When looking at the last patches of the chart, we can see the greater noise fluctuation of the X-H2S compared to the X-H2 around the line in blue.
Regarding the Panasonic cameras, this can also be better visualized when filming the chart at higher ISOs. Looking at the waveform at ISO 51200, we see that the S5 has a greater signal fluctuation than the S5 II.
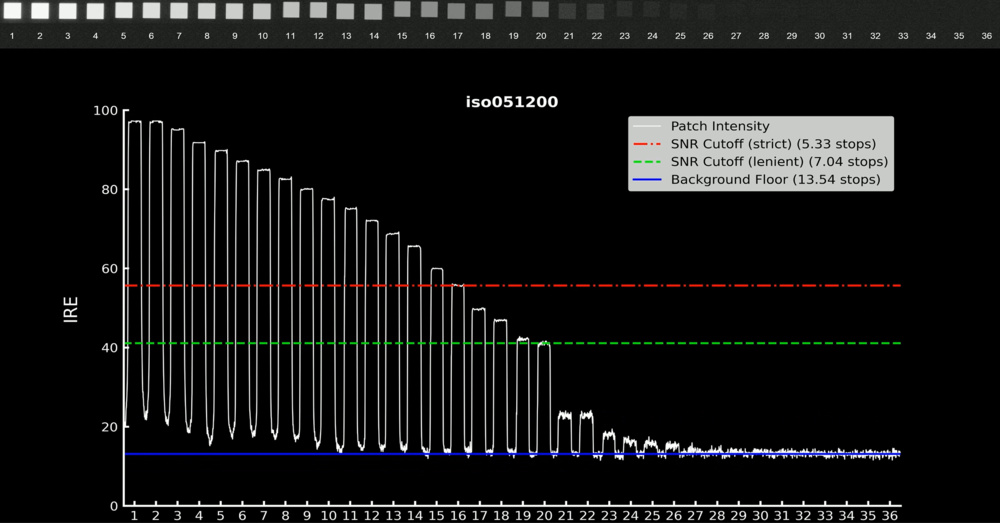
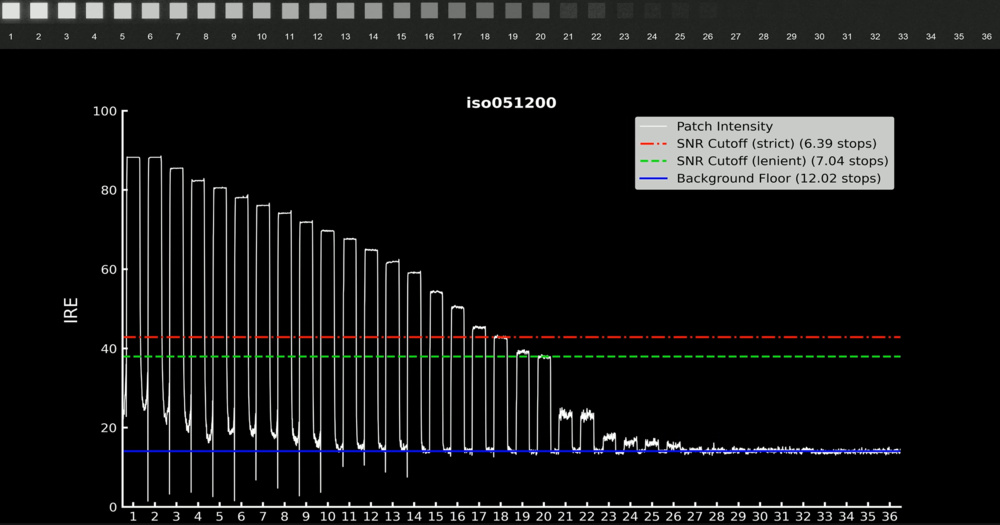
When looking at the last dark patches, the fluctuation around the background line is higher for the S5 compared to the S5 II.
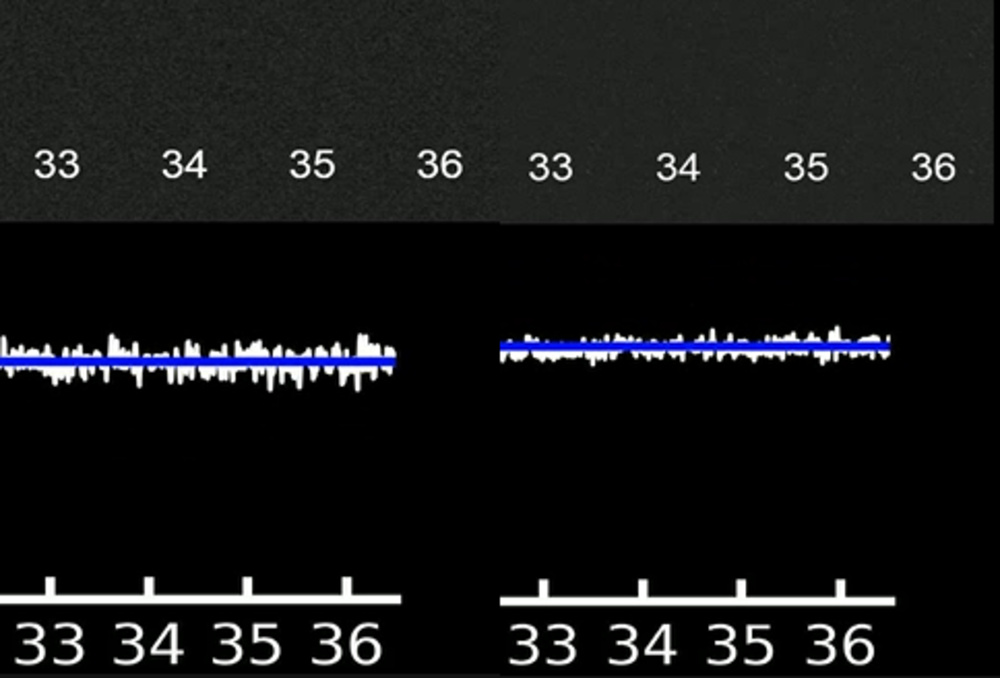
This shows that some cameras have different uses, like the X-H2 and X-H2S, with one being more sensitive and the other more specific. It also indicates that for some manufacturers, increasing the specificity at the expense of sensitivity might be regarded as an upgrade, as we see when we compare the S5 II to the S5. Be careful, though: a more specific but less sensitive camera isn't necessarily better. The decrease in one might be because the camera is made for different uses.
Why Some Cameras Are Noisier
Due to technological progress, modern cameras are usually less noisy than older cameras. Many modern cameras have high-quality sensors that decrease noise while increasing specificity. When comparing two modern cameras, however, the surrounding hardware must be considered, as must the encoding implementation when applying different gamma curves or picture profiles.
Noise will hinder the differentiation of details in an image. The figure below shows how increasing the noise makes it harder to differentiate the tree rings.
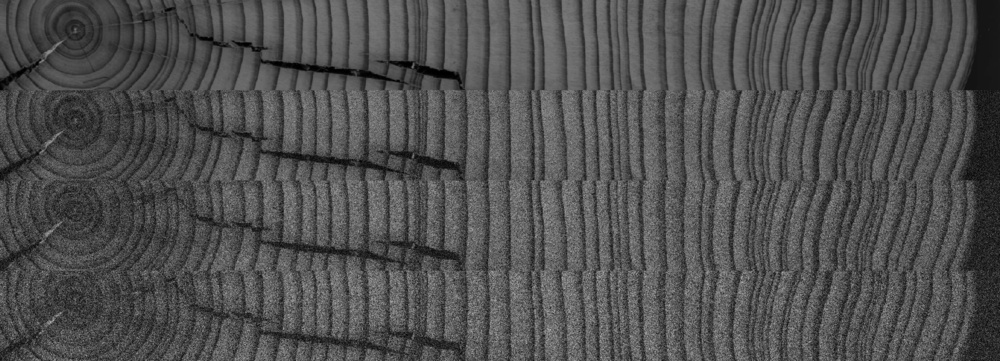
There are many different types of noise, and many factors can affect the image of a video. Without going too deep into it (we'll keep this for another article), and since the camera's sensor is the main factor determining video dynamic range, we'll mostly do a brief overview of sensor noise.
Thermal noise (or dark noise) is caused by the random motion of electrons in the camera sensor and increases with higher sensor temperatures and longer exposure times. This type of noise will often appear as random brightness fluctuations in darker areas. Therefore, how a camera handles heat will affect the noise in the video.
Shot noise (or photon noise) is caused by the random arrival of photons at the camera sensor. This is more prominent in low-light conditions, where the arrival of photons is sparse. This type of noise is prominent in our test since it's done in a completely dark environment with only the chart lit up. This type of noise results in graininess in dimly lit parts of the video.
Finally, there is readout noise. This type of noise is introduced during the electronic readout of the sensor data and is caused by imperfections in the camera's analog-to-digital conversion process. It mostly manifests as a faint and consistent pattern across the image. As stated, there are many more factors that can affect noise and video dynamic range. These are mostly the ones attributed to the camera's sensor, which is the main determinant of video dynamic range.
While we haven't explicitly tested how cameras handle noise in video to determine why some perform better than others, we can make some educated guesses. In the case of the Fujifilm X-H2 and X-H2S, the X-H2S has a stacked sensor for faster data readout speed. A trade-off for faster readout speed could be higher signal fluctuation due to more imperfections in the analog-to-digital conversion. This partially explains why the X-H2S performs worse than the X-H2 when considering our dynamic range test's strict and lenient thresholds.
In the case of the Panasonic LUMIX S5 and S5 II, it is a bit more of a mystery. The S5 and S5 II are equipped with similar 24 MP full-frame sensors, but the S5 II still outperforms the S5 in terms of video dynamic range when factoring the noise. Unfortunately, we don't know exactly what improvements or hardware adjustments were made to the sensor to achieve this.
Increasing The ISO To Get More Details, But To What Extent?
Shooting a scene with a higher ISO is usually regarded as unfavorable since increasing the ISO increases the gain of the camera, which amplifies the signal and the noise. As previously mentioned, changing the ISO of a camera will modify its sensitivity and specificity following an ROC curve. Usually, you would increase the ISO to increase the details visible in the shadows when increasing your exposure isn't an option. Ideally, you would increase the ISO to the minimum value that allows you to capture the details you want in the shadows without clipping too many details in the highlights.
As stated above, when developing our video dynamic range test, we evaluated the dynamic range of each camera with every ISO available. We also developed a way to visualize how increasing the ISO can move the camera's video dynamic range. The luminosity patch detection chart indicates the patches in the camera's full dynamic range before being clipped in the highlights or losing details in the low shadows. Keep in mind that the exposure, or level of light hitting the sensor, is the same for this test. This means that we don't change the shutter speed or aperture and only adjust the ISO. We do this to remove exposure as a variable and isolate the impact of ISO.
For Some Cameras, The Full Range Of Details Is Already Available Around Base ISO
When looking at the luminosity patch detection chart, we observe that some cameras can't get details in the low shadows when set to a lower ISO. In this case, the ISO must be increased to get as many details as possible in the low shadows. This, unfortunately, has the effect of clipping details in the highlights. Looking at the luminosity patch detection chart for the Canon EOS R50 below, we see that for a certain level of light, the ISO must be increased to get details in the low shadows. As stated before, the last four patches are the chart's darkest patches, which means that pretty much no details are distinguishable from a dark background. This means that around ISO 2500, the camera manages to get all the details in the chart. Increasing the ISO further would simply clip the few details still present in the highlights with diminishing returns in the shadows.

Other cameras will give you almost the full video dynamic range even at lower ISO settings. This means that for the same light exposure, increasing the ISO will give you diminishing returns in getting details in the shadows. In that case, it'll just increase noise while also clipping details in the highlights. Keep in mind that our chart sees a big jump in stop numbers between patches 32 and 33 (4 stops). This means that with a more precise chart, it might be possible to detect more details we can't illustrate here.

Looking at the luminosity patch detection chart of the Fujifilm X-T4 above, we see that the full video dynamic range is practically attained at lower ISOs, with most of the details in the shadows captured. Increasing the ISO will mostly clip the details in the highlights without increasing the amount of visible shadow detail. It doesn't mean that increasing the ISO is necessarily useless in that case. These results are obtained in the context of a controlled environment on a specific chart. When shooting a real scene with more nuance, increasing the ISO might give you the push you need to get the details you want in the darker areas of the image.
Maximizing A Camera's Video Dynamic Range
Since the sensor is the limiting factor determining a camera's video dynamic range, it is important to use the right settings to unlock the camera's maximum dynamic range while shooting a video. Log gamma curves were developed to maximize a camera's video dynamic range. Log picture profiles redistribute the tonal values of a scene more evenly across the camera's dynamic range. The resulting footage looks flat and lacking in contrast, and it needs to be color-graded to be usable.
When comparing our lined-up chart, with one shot in a Log picture profile and the other in a standard picture profile, we can see the lower contrast from the Log footage. We also see that the Log footage looks more gray than black in the low shadows.

A black band was added above each aligned chart to better see the difference. When shooting with a standard picture profile, we see that black is closer to a true black, and the white appears sharper. With the Log picture profile, the intensities appear more even, and the darkest patches are not exactly black. We also observe that when shooting in Log, some Log picture profiles leave some headroom and floor room to facilitate color grading and give more range to the user to increase contrast.
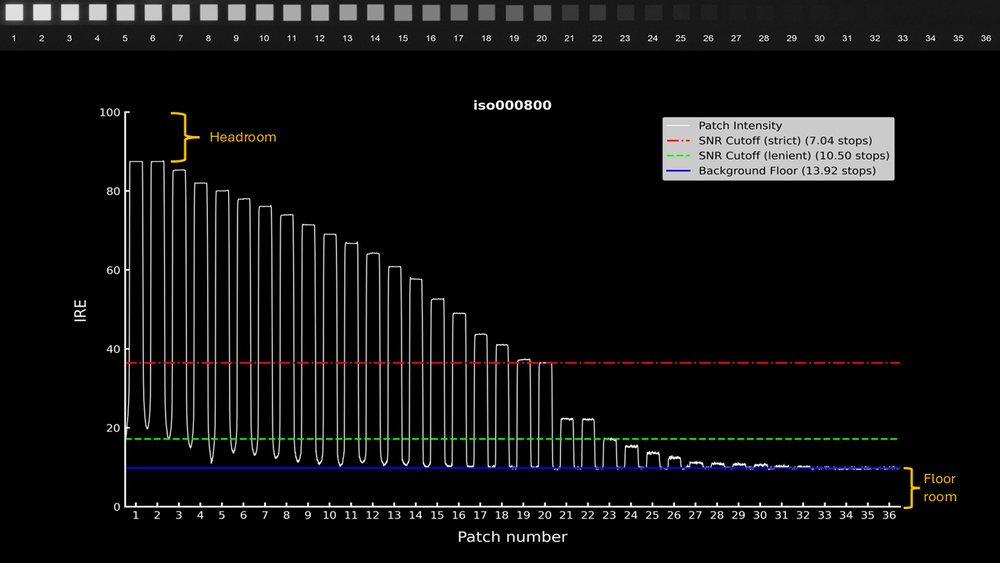
This is why, when shooting with a Log picture profile, color grading needs to be done for the footage to look more appealing to the eye. Color grading is not necessary when using a standard picture profile designed to look good on displays since the gamma curve used in this type of profile has been designed to make the intensity of the signal look more natural. Therefore, shooting with a Log picture profile is a bit of a double-edged sword. More details in the scene will be captured, but further post-processing work will have to be done for the footage to look good.
Shooting Using A Log Picture Profile To Get The Full Video Dynamic Range Of The Camera
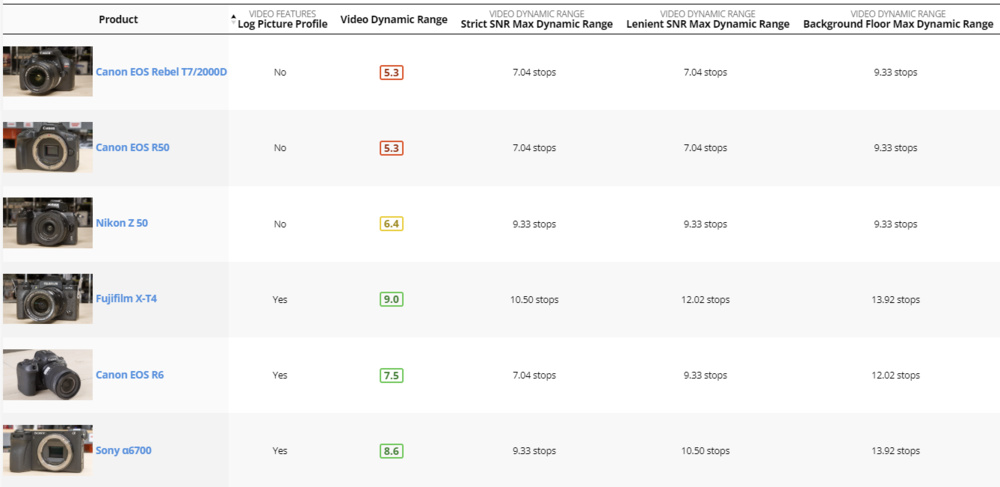
You should use a Log picture profile, if available, to get the most out of a camera's video dynamic range. Although standard picture profiles such as Rec709 display a better-looking image without color grading, they don't maximize the dynamic range like a Log picture profile does. Our results show that the Canon EOS R50, which has no Log picture profile available, scores lower than the Canon EOS R6 using the C-Log3 picture profile.

Our results show that cameras with a Log picture profile option have a greater full video dynamic range than cameras that don't, and they score better overall. This decrease in video dynamic range is expected since standard gamma curves cut the dynamic range to increase contrast and look better on a display. Surprisingly, when factoring in the noise, we observe that some cameras shooting with a standard picture profile perform almost as well as cameras shooting in Log. This indicates that how the camera handles noise plays a big part in video dynamic range even when applying a Log curve to the footage.
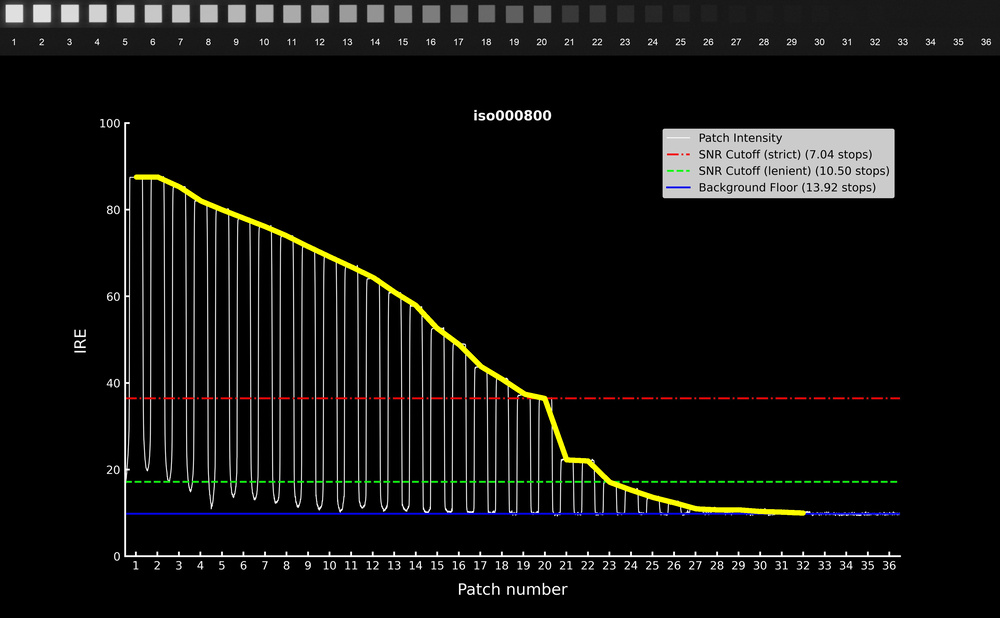
When comparing the waveforms of a standard picture profile with a Log picture profile, we can see the different shape of the curve defined by the intensity measure for each patch (the yellow line following the intensity levels of each patch in the following figure).
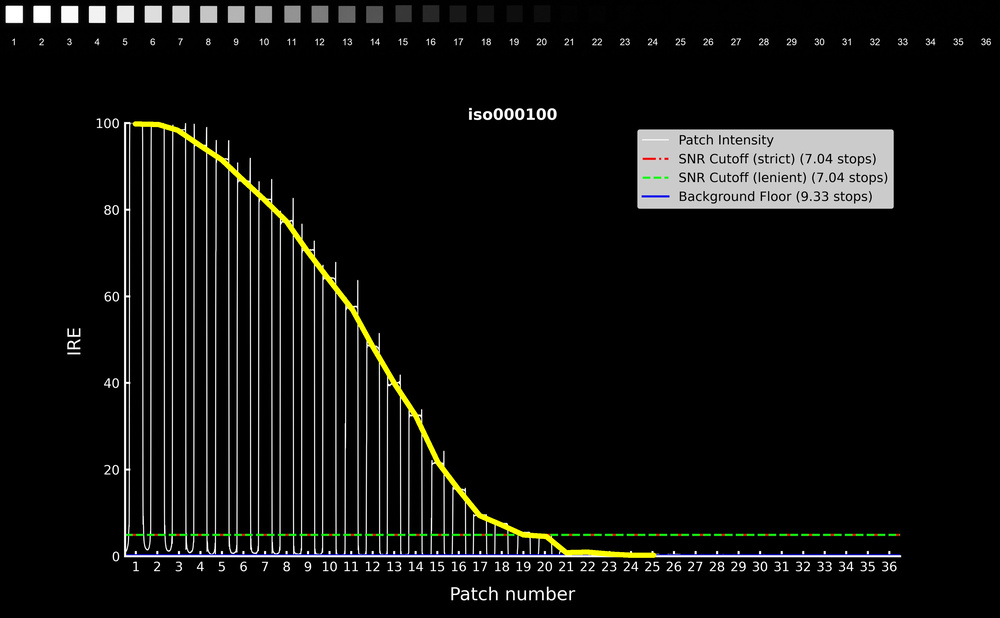
Looking at the slope produced by the standard picture profile, we see that the highlights and low shadows are crushed while the values in the mid-tones are stretched, creating a steep slope in the mid-tones. This increases the contrast of the image, which looks better when viewed on a display compared to an ungraded video shot in Log, but there's a loss of detail in the highlights and low shadows. This higher contrast can be seen when looking at the lined-up patches above the waveform.
The slope produced by the Log picture profile is less steep. Basically, the intensity between each patch is more evenly distributed. By doing so, the video dynamic range can be increased since the details in the highlights and the low shadows aren't crushed anymore. Consequently, the image displayed will look flatter since the contrast is lower.
Using The Same Log Picture Profile Doesn't Mean Getting The Same Video Dynamic Range
As previously mentioned, the sensor is the physical limit that determines the camera's video dynamic range. This means that even when using the same Log picture profile, the video dynamic range of two cameras might be different for two different camera's systems. For example, both the Panasonic LUMIX GH6 and the Panasonic LUMIX S5 support Log recording in V-Log, but our results show that their video dynamic range is different.

Applying a Log picture profile will basically unlock the video dynamic range inherent to the camera's sensor. It won't magically increase the dynamic range over what the sensor can capture. In this case, the sensor of the GH6 has a lower video dynamic range than the S5, even when applying the same Log picture profile.
Conclusion
While developing our video dynamic range test, we observed that the dynamic range claimed by the manufacturers isn't always what it seems. When measuring the video dynamic range, we decided to factor in the camera's noise as well to have a better idea of the usable dynamic range compared to the camera's full dynamic range. Using our methodology, we discovered that some cameras have a greater full video dynamic range than others but don't handle noise as well because of sensor hardware limitations.
Our test also revealed that, for some cameras, increasing the ISO to boost shadow detail will give diminishing returns. Some cameras have a good enough full dynamic range that, for a certain level of light, the base ISO is usually enough to get the most details in the shadows while minimally clipping the details in the highlights.
Finally, to no surprise, our test revealed that shooting with a Log picture profile allows for a greater full video dynamic range compared to shooting with a more standard picture profile such as Rec709. It is important to keep in mind that the footage looks flat in Log and will need post-processing to look good.
At the end of the day, a camera's sensor design is still a black box, requiring further investigation and testing. If you're looking for a camera based on its video dynamic range, our tests have shown that while there are cameras that have a wider dynamic range than others, there is no clear choice in terms of one product being better than another. The best camera for you depends on what you plan to shoot, your lighting conditions, and whether you intend to spend extra time accounting for noise, color grading, or other post-processing tasks.


