Our philosophy at RTINGS.com is that good product testing isn't just about measuring a product's performance; it's about understanding why a product performs the way it does. That's why our new mattress test bench includes a full teardown of each mattress in addition to whole-product performance measurements.
By testing the individual layers of a mattress, we can isolate the mechanical properties of every component: quilted tops, foams, coils, and any special materials. This gives us an unprecedented level of insight into how each product design decision contributes to a mattress's overall performance and feel. This data allows us to begin building predictive models that relate a mattress's construction to its real-world performance.
Test results
Breaking It Down: Why Layer-Level Testing Matters
Until now, most mattress testing has focused on high-level measurements: how firm a mattress feels, how much edge support it offers, how bouncy and responsive it feels, how much heat it retains, or how much motion it transfers. Indeed, we test all these performance aspects, too, but we've developed objective, repeatable methods for measuring them. Still, these metrics are the result of many design choices made beneath the surface.

Our full teardown process measures the properties of each layer in isolation. For foams, we measure basic properties like layer thickness and density, but also indentation force deflection (IFD) and resilience; for spring layers, we assess layer height, the density of the coils, their gauge, as well as stiffness and bounce. This allows us to treat the mattress not as a black box but as a structured system where we can model inputs and predict outputs.
Modeling Firmness From First Principles
The data we collected with the first published batch of mattress reviews is sufficient to begin building basic predictive models grounded in engineering theory of stacked materials' behavior. This first-principles-based approach—which builds understanding from fundamental physical laws rather than relying solely on empirical trends—lets us model performance from the bottom up. The first aspect we tackled is firmness, a key factor in mattress comfort and support.
The Input and Output Firmness Measurements
We measure the "output" firmness of a full mattress unit by performing compression tests at the lumbar area using a 355 mm diameter convex platen driven at 90 mm/min by a linear actuator fitted with a load cell. The resulting load–versus–indentation data is normalized to the platen area (i.e., expressed in kPa) to align with measurements taken on internal components using different apparatuses. To quantify firmness, we calculate the normalized stiffness (in Pa/mm) as the average slope of the normalized load–depth curve at 1.5, 2.1, and 2.8 kPa, matching the pressure applied by an "average" sleeper. Note that we use an empirical model to relate this normalized stiffness value to the descriptive "firmness level" also shown in the reviews.

We measure the "input" firmness of individual mattress layers by performing compression tests on each constituent component. For foam layers with non-linear behaviour under compression, this follows the ASTM D3574-17 Test B1 standard indentation force deflection (IFD) method. Each test uses a 380 mm × 380 mm × 100 mm sample, which is compressed by 25% of its original thickness using a 200 mm diameter platen. This quasi-static test holds the platen at the target depth for one minute before recording the force. As with whole-mattress testing, the force is normalized to the platen area and is reported as what we refer to as the foam's 25% indentation pressure deflection (IPD) value, in kPa. To align with commercial foam specifications, the IPD graphs in our reviews also show values at 65% indentation and the corresponding IFD values in pounds-force (lbf).

For spring layers, which are expected to exhibit a linear response under compression, the firmness input is measured as the average slope of the load-versus-indentation depth curve. This is collected using a method analogous to that used for the full mattress: a 355 mm diameter platen is driven into the spring layer, and the resulting force data is normalized by the platen's area. The normalized spring layer stiffness (in Pa/mm) is then calculated as the average slope of the curve at 1.5, 2.1, and 2.8 kPa.

The Springs-in-Series Model for Mattress Firmness
To estimate a mattress's overall firmness from its component layers, we begin by modeling each layer—foam or spring—as a linear spring. In this simplified approach, the mattress is treated as a series of springs stacked vertically, with each spring having its own normalized stiffness, Kᵢ, and thickness/length, tᵢ.

For any spring layer found in a mattress, we directly use the normalized stiffness values derived from our physical compression tests. For foam layers that don't have a directly measured stiffness value, we estimate a pseudo-normalized stiffness from the indentation pressure deflection tests. Specifically, we divide the 25% IPD value by 25% of the foam layer's thickness, tᵢ:

The simplest springs-in-series model for the total stiffness of such a system, Ktotal, is based on the harmonic sum of the individual layer stiffnesses, much like resistors in series:

However, this tends to overemphasize the contribution of softer layers, underpredicting total mattress stiffness. And this simplest model neglects the contribution of layer ordering/depth. The poor prediction is shown in the following scatter plot of measured stiffness versus modelled stiffness, which has a trendline slope far from unity (0.86) and low coefficient of determination (R2 = 0.65).

Instead, we predict a mattress's total normalized stiffness through total strain energy, Utotal, which is the sum of each layer's strain energy, Uᵢ. We further extend the model by modulating each layer's strain energy with a simple decaying depth weight:

where ΔLtotal and ΔLᵢ are the changes in the thickness of the entire mattress and the ith layer, respectively, when subjected to a compressive force, and di is the depth from the surface of the mattress to the top of the ith layer. The depth decay factor α serves as a model-fitting parameter and was set to 0.0075 through trial-and-error optimization to maximize the model's coefficient of determination (R2) against measured whole-mattress stiffness. The total change in mattress thickness is the simple sum of each layer's change in thickness:

And finally, the change in thickness of each layer is calculated using Hooke's Law for linear springs, which we similarly extend with a decaying depth weight (with the same factor α = 0.0075):

where Psleeper is the compressive pressure exerted by an average sleeper (2000 Pa).
Thus, predicting the total stiffness of each mattress comes down to the following sequential calculations:

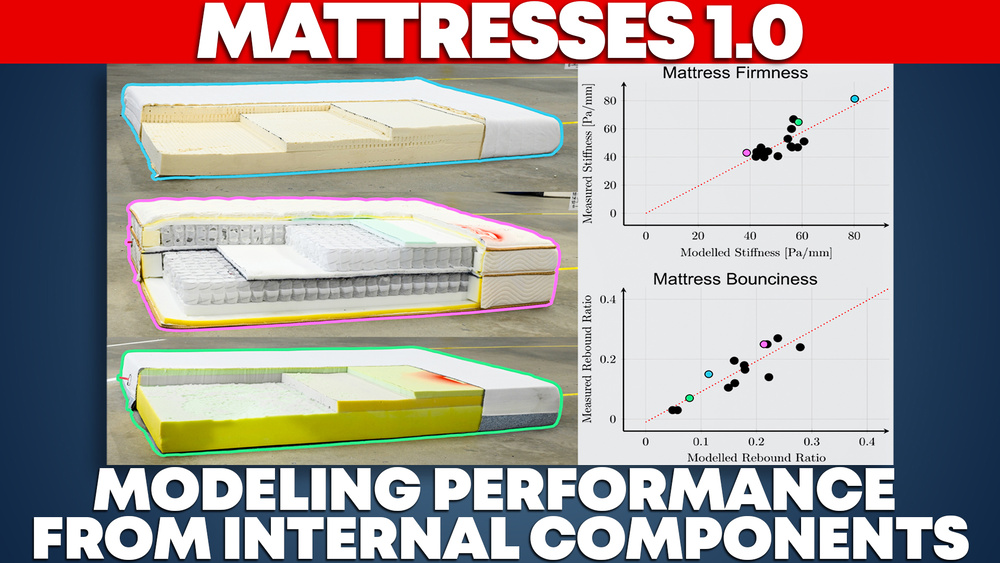
The results for the initial batch of tested mattresses are presented in the following plots. The scatter plot on the left illustrates the relationship between measured and modeled normalized mattress stiffness, exhibiting a strong linear correlation. The trendline's slope, which is close to unity, and the coefficient of determination (R² = 0.7) indicate that the simplified springs-in-series model offers a reasonable first-order approximation of overall mattress stiffness based on the stiffness of its individual layers. However, the non-zero y-intercept indicates a systematic underprediction of approximately 25 Pa/mm. This underprediction likely stems from the real-world nonlinear compressive behavior of foams, as well as additional stiffness contributions from interlayer adhesives and outer covers. The scatter plot on the right shows the results after this bias is corrected for in the model.

The relatively strong agreement between the model and the measured normalized stiffness values is encouraging, given the diversity of mattress constructions represented in the dataset. These include all-polyfoam designs, mattresses incorporating latex or memory foams, hybrid constructions, and traditional innerspring models. Notably, the linear springs-in-series strain energy model also provides a satisfactory prediction for the Purple Mattress, despite its distinctive comfort layer composed of a proprietary viscoelastic grid (shown in the inset of the previous figure).
Our firmness model shows that to accurately predict how firm a mattress will feel, you need to account for a depth decay effect - deeper layers contribute less to the perceived firmness. In practical terms, this means that the top few inches of material play an outsized role in how a mattress feels when you lie down. So, if firmness is your concern, your attention should be on the upper layers. This matches advice frequently shared in the DIY mattress community (like the excellent guide posted to r/Mattress shown in the following screenshot): if your DIY mattress feels too firm, try swapping in a softer comfort or transition layer, or rearranging layers to bring softer materials closer to the surface. On the flip side, if your mattress feels too soft, using firmer support layers or removing excess foam can help. Our data gives quantitative support to these intuitive strategies, showing that how you layer materials—especially near the top—has a major impact on perceived firmness.

Modeling Bounciness With Depth Consideration
With a first principles-based model for mattress firmness in place, we turned our attention to bounciness (or resilience): another key factor in how a mattress feels to a sleeper. As with firmness, our custom mattress test bench enables both whole-product and individual-component measurements of bounciness, which we use to build our model directly from physical inputs.
The Input and Output of Bounciness Measurements
We measure the "output" bounciness of a full mattress by dropping a 12-lb medicine ball from a height of one meter onto the mattress surface and recording the maximum rebound height (in cm) using slow-motion videography. The following video shows an example for the Saatva Classic, including the rig we designed to ensure repeatable drops at the center of the mattress and to allow direct measurement of rebound height:
We measure the "input" bounciness of individual mattress layers by performing resilience tests on each constituent component. For spring layers, this is done in a similar manner to the full mattress unit. A six-lb medicine ball is dropped from one meter above the surface, and the maximum rebound height (in cm) is recorded using slow-motion videography. We opted for a lighter ball in these tests after finding that the 12-lb ball frequently caused some spring layers to bottom out. The following video shows an example recording from our review of the Saatva Classic:
For foam layers, bounciness (or resilience) is measured by dropping a 16 g steel ball from 500 mm above the foam sample. In the reviews, we present resilience as a percentage of the original drop height. The test rig includes an electromagnet for consistent, repeatable ball releases and a clear graduated tube for accurate rebound measurement via slow-motion video. The following video shows an example from our review of the Saatva Classic of this test in action:
A Depth-Weighted Layer Bounciness Model
For the purposes of modelling, we describe a mattress's bounciness through the rebound ratio: the ratio of the maximum rebound height to the initial drop height of the medicine ball. We modeled the rebound ratio of an entire mattress, Rtotal, as a weighted sum of the bounciness (or resilience) of its individual layers:

where wᵢ and Rᵢ are the normalized model weight and rebound ratio of the ith layer, respectively. Since resilience measurements for the full mattress, spring layers, and foam layers were obtained using different drop heights and impactor masses, direct comparison requires calibration. To address this, we introduced separate scaling factors for foam and spring layers, which act as model-fitting parameters. These were determined through trial-and-error optimization to maximize the model's coefficient of determination (R2) against measured whole-mattress bounciness:

The normalized model weights, wᵢ, incorporate two factors: (1) the relative thickness of each layer within the mattress stack, and (2) the layer's depth from the top surface, since deeper layers contribute less to overall bounciness due to energy losses and inertial damping from the layers above:

tᵢ and ttotal represent the thickness of the ith layer and the total mattress thickness, respectively, while di denotes the depth from the surface to the top of the ith layer. The depth decay factor α serves as a third model-fitting parameter, set to 0.01 through trial-and-error optimization to maximize the model's coefficient of determination (R2) against measured whole-mattress bounciness.
The results of our mattress bounciness modeling are shown in the scatter plot below, where measured rebound ratios are plotted against the model-predicted values for each tested mattress. The trendline exhibits a slope near unity and a y-intercept close to zero, indicating that our simple depth- and thickness-weighted model effectively captures overall bounciness based on the properties of individual layers. With appropriate model-fitting parameters, the model achieves an R2 value of 0.78.

Note that the above scatter plot doesn't include the Purple Mattress, as its unique grid comfort layer doesn't allow for resilience measurements to be taken like with foam comfort layers.
Our bounciness modeling shows that, while depth-weighting improves prediction accuracy, the support layer ultimately plays the dominant role in shaping a mattress's overall rebound. This is because springs—especially pocketed coils—are dramatically more resilient than foams, and their contribution to bounciness persists even when placed deep within the mattress. As a result, sleepers who want a bouncy, responsive feel should focus primarily on the support layer. Conversely, those looking to temper this effect should seek out low-resilience foams, such as memory foam, in the transition or comfort layers to help absorb motion and dampen rebound.
Early Statistical Modeling To Predict Responsiveness
The models we developed for mattress firmness and bounciness relied on a straightforward relationship between whole-mattress outputs and corresponding input measurements taken from each individual layer - relationships that we explain using first principles. With a large enough dataset, however, we can begin to explore more complex relationships between layer attributes and overall mattress performance using statistical models and multiple linear regression.
At this early stage in building our database, developing such statistical models is challenging without risking overfitting. A common guideline is to have at least 10 data points per model parameter (predictor). That said, we can begin to perform statistical tests to determine which predictors may be most influential in determining how a mattress performs in specific aspects. We began with the simpler aspect of responsiveness, which is likely influenced by only a few key predictors.
The Output Responsiveness Measurements
Mattress responsiveness plays an important role in the overall sleep experience. While some sleepers enjoy the slow, enveloping feel of a low-response mattress, others may find it harder to shift positions and prefer a more responsive surface. We measure responsiveness by painting a pattern on the mattress surface and recording how long (in seconds) the pattern continues to move after a 12-lb medicine ball is removed. An example video from our review of the Casper Snow is shown below:
Multiple Linear Regression
In this section, we apply multiple linear regression to test three hypotheses regarding the extent to which specific mattress layer properties can explain variation in surface response time. The method assumes a model of the form:

where Y is the dependent variable (i.e., measured "output" response time), β₀ is the intercept, all other βᵢ are the slope coefficients for each independent variable, Xᵢ, and ε represents the model error.
The hypotheses test whether each chosen independent variable, Xᵢ, has a statistically significant relationship with the dependent variable. To keep the model simple, we hypothesized that the depth- and thickness-weighted average resilience and indentation pressure deflection (IPD) of the top 75 mm of mattress foam are significant predictors of surface response time. That is:


where Rᵢ is the rebound ratio (resilience) of the ith layer, IPDᵢ is its indentation pressure deflection, and dᵢ is the depth to the center of the ith layer (within the top 75 mm of the mattress). The depth decay factor, α, was set to 0.04. The thickness of the ith layer, tᵢ, also within the top 75 mm, is given by:

Tabulating X₁, X₂, and Y for each mattress allowed us to use Excel's Regression Data Analysis tool to estimate model coefficients and assess statistical significance at a 95% confidence level. The results for the linear model and the individual predictors are given in the tables below:
| Metric | Value |
|---|---|
| R2 | 0.776 |
| Adjusted R2 | 0.735 |
| F-statistic | 19.04 |
| F-statistic p-value | 0.00027 |
| Predictor | Coefficient | p-value |
|---|---|---|
| 1 (Intercept) | β₀ = 0.74 | 0.41 |
| X₁ (Depth-Weighted Average Resilience) | β₁ = -9.99 | 0.0001 |
| X₂ (Depth-Weighted Average IPD) | β₂ = 0.0017 | 0.016 |
The linear model explains a substantial portion of the variance in mattress surface response time, with an R² of 0.78 and an adjusted R² of 0.74. The regression is statistically significant overall, as indicated by the F-statistic (F = 19.04, p < 0.001), meaning the model explains more variation than would be expected by chance, supporting our use of a linear model for the statistical hypothesis testing of mattress surface response time predictors.
Both depth- and thickness-weighted average resilience and IPD were statistically significant predictors (p = 0.0001 and p = 0.016, respectively). This supports our hypotheses that these material properties meaningfully influence mattress surface response time. The negative resilience coefficient denotes that higher resilience is associated with shorter response times. This makes intuitive sense as resilience quantifies how efficiently a material returns energy after deformation. Materials with higher resilience recoil more quickly when unloaded, resulting in a faster surface response. In contrast, higher IPD was associated with longer response times. The intercept term was not statistically significant (p = 0.41).
Conclusion And Outlook
Our new mattress test bench marks an advancement in understanding mattress performance by combining full teardowns with objective, layer-by-layer measurements. This approach enables us to move beyond surface-level observations and grants insight into the fundamental reasons behind a mattress's performance. Even at this early stage, initial first principles-based predictive models for firmness and bounciness have shown good correlation with measured values. Furthermore, early statistical modeling for responsiveness has successfully identified key material properties—resilience and IPD—as significant predictors, reinforcing the validity of our data-driven approach.
Looking ahead, we believe the expanding dataset from this test bench has tremendous potential. We foresee increasingly sophisticated predictive models across a wider set of performance metrics, including heat retention, motion isolation, and edge support. This will help us deliver even more detailed, actionable insights for our users and pave the way for personalized mattress recommendations. We're also excited by the potential to support DIY mattress builders through a deeper understanding of how components interact. Ultimately, our commitment to objective, component-level testing is about unlocking a more complete understanding of what makes a mattress deliver a great night's sleep.