- Table of Contents
- Intro
- Headphones 2.0: Main Changes
- Comments
We're launching Headphones Test Bench 2.0 very soon. This test bench builds upon Test Bench 1.8, which developed our own in-house target curve and opened the door for a more subjective interpretation of our data. However, as we alluded to in our Improving Headphone Testing article, no one target can satisfy all users. As a result, assessing headphones' sound quality based on one single curve has obvious limitations we wanted to overcome with this test bench.
With Test Bench 2.0, we've overhauled our approach to sound. We added new tests, improved the accuracy of existing objective measurements, and added features that allow for a more flexible interpretation of these measurements. While previous test benches fixated on developing one test (or a set of tests), this change focuses on improving our overall test suite to make it easier for you to make a buying decision. It's been shaped by community feedback, which indicated that, while our measurements were useful, our evaluation of headphones didn't always help you make informed buying decisions.


Headphones 2.0: Main Changes
Sound Profile
This update introduces an interactive graph tool that can compensate a response to a range of targets. You'll notice that if you click on the Sound Profile, Raw FR, or Bass, Middle, and Treble compliance graphs to enlarge them, you can now view comparisons with other target curves validated on the B&K Type 5128 HATS, such as the Harman IEM target, the SoundGuys.com headphone target response curve, the SoundGuys.com studio curve, and a diffuse field response, among others.

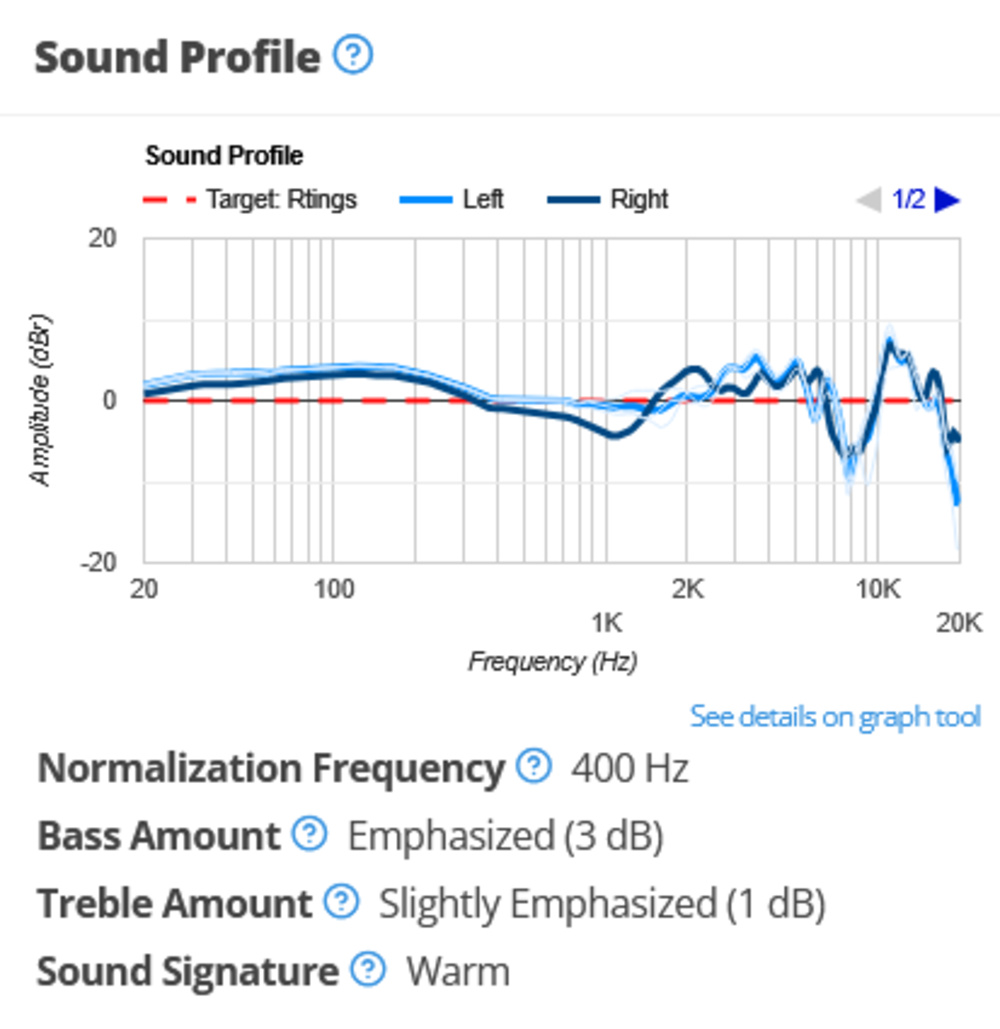
Furthermore, we've introduced Sound Signatures, which are determined by an algorithm that uses rounded integer values of the Bass and Treble Amount to sort headphones' sound profiles into seven categories. We've also added descriptions to the Bass and Treble Amount categories to give you a better idea of how a response performs compared to our target. These Sound Signatures aren't intended to be prescriptive but allow you to more easily sort through our headphones' measurements based on your own listening preferences. You can find them in the ribbon at the top of the review and in the Sound Profile test.
| Sound Signature | Characteristics |
| Boosted Bass | Bass-forward sound, with a de-emphasized treble range |
| V-shaped | Excited sound, with prominent bass and treble |
| Warm | Emphasized bass and low-mids, with rolled-off highs for a smoother sound |
| Flat | Follows a diffuse field sound target in the bass and treble |
| Balanced | Follows our target curve in the bass and treble |
| Bright | Emphasized and sharp treble, with a more recessed bass response |
| Elevated Mid-Range | Under-emphasized treble and bass response, prominent mids |
Changes To Our Verdicts And Usages
One of the first things you'll notice at the top of the review are the usages. Most notably, we've added a new category of performance usages, which provide objective assessments for performance-related aspects in headphones based on specific, relevant tests we use.
Audio Reproduction Accuracy: This usage indicates fidelity in audio reproduction. Higher weight is given to objective performance measurements, with a smaller weight given to bass, mid, and treble compliance to our target curve.
 |  |
Noise Isolation: This usage gives immediate insight into a pair of headphones' ability to attenuate environmental noises from the listening experience. In our evaluation, we also factor in how well the headphones minimize leakage.
Microphone (In Development): This indicates how well the microphone reproduces your voice in any environment. We're currently in the process of improving our evaluation of integrated microphones, but we recognize that microphone performance is an important aspect of various headphones' usages.
You'll likely immediately notice that Neutral Sound has also been removed as a usage. While some aspects of it live on within the Audio Reproduction Accuracy performance usage, we decided we wanted to place greater emphasis on user preference, given the difficulty in defining neutral sound and the inability of multiple studies to arrive upon a single target curve that represents the preferences of the average listener.
There have also been smaller changes to other usages. We've tweaked the weighting of some of the tests that make up our Sports and Fitness, Travel, Office Work, Wired Gaming, and Wireless Gaming usages, as well as some of the verbiage. As with the Microphone performance usage, we've flagged the two gaming usages as 'In Development'; we're still working on a formulation that encompasses everything users will want from a wired or wireless gaming headset. If you have feedback on how to shape these, leave a comment below!
Changes To The Ribbon
We've also reshaped the ribbon found at the top of the review so you can quickly identify important specifications and technical details that can assist you in making a buying decision. You can also filter according to these specifications with the table tool. We added the following information to the ribbon:
- The Frequency Response Consistency score
- Sensitivity
- Sound Signature
- Bass and Treble Amount

Frequency Response Consistency
We've also expanded the scope and accuracy of our Frequency Response Consistency test. We now use the B&K Type 5128 testing head for our baseline measurements. For IEMs, we collect the frequency response after three re-seats. For on-ears and over-ears, we perform five passes on the testing head, but the bass and mid regions are also measured with a canal-blocking in-ear microphone on humans with various physical features: long hair, glasses wearers, and small, medium, and large heads. We gray out our measurements above 2k due to the increased variance and difference in human hearing perception in this range.
Enlarging the graph allows you to see an averaged response for each human subject, as well as the individual passes. This can provide valuable insight for users on a more personalized basis. For example, users with glasses can see how consistently their headphones can deliver audio between multiple re-seats. As a result, it's easier than ever to see deviations from the overall average of all measurements.
 |
Stereo Mismatch
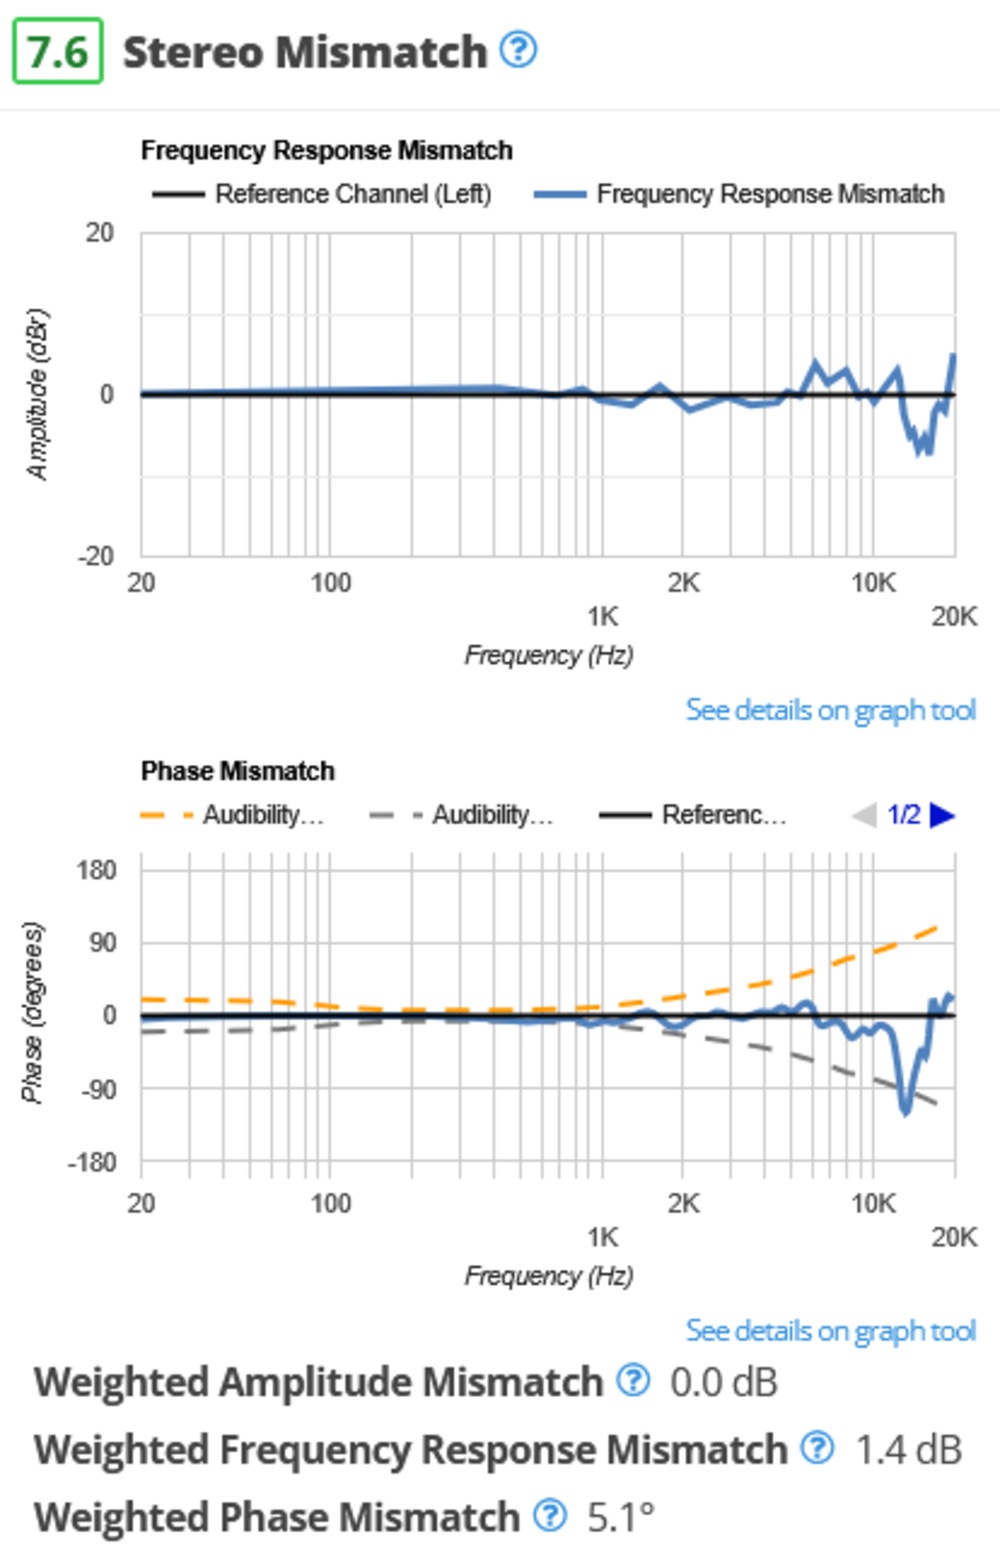
While this test isn't entirely new, it represents a new formulation of the tests previously displayed in the Imaging box. We wanted to group all mismatches between L/R drivers within one test box, and this now includes a separate graph for frequency mismatch. We also measure phase shift in both directions and represent this on the graph tool.
Group Delay
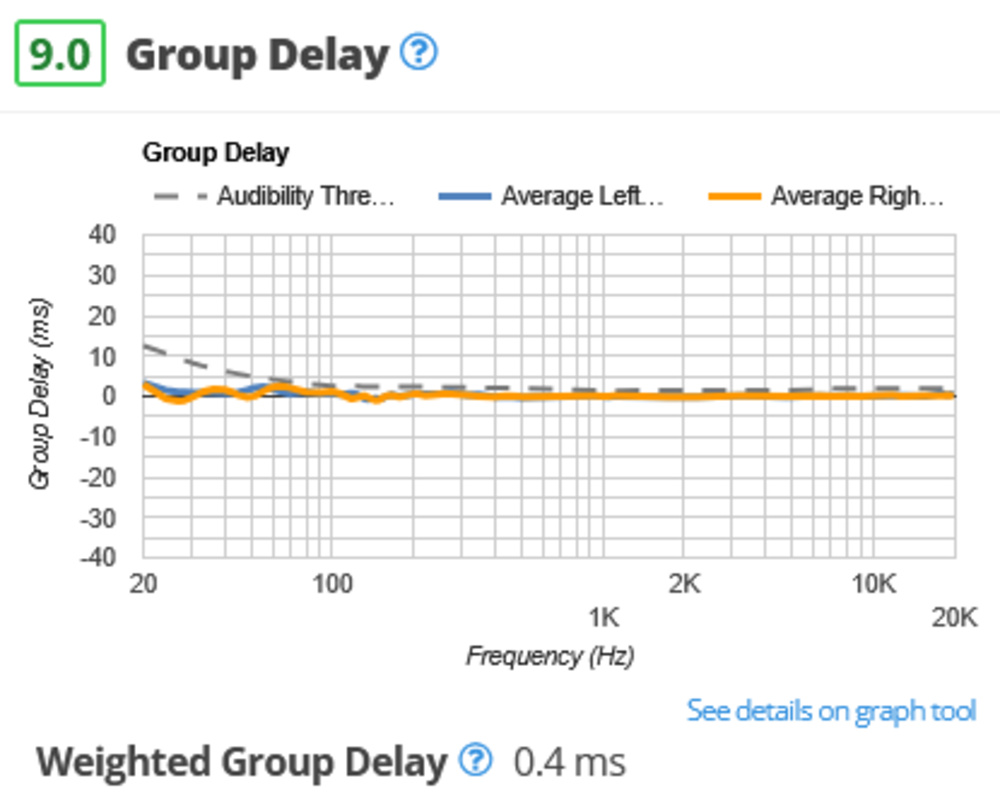
Group delay has now been given its own test box, too, with a measurement for the weighted group delay value given in milliseconds.
Cumulative Spectral Delay
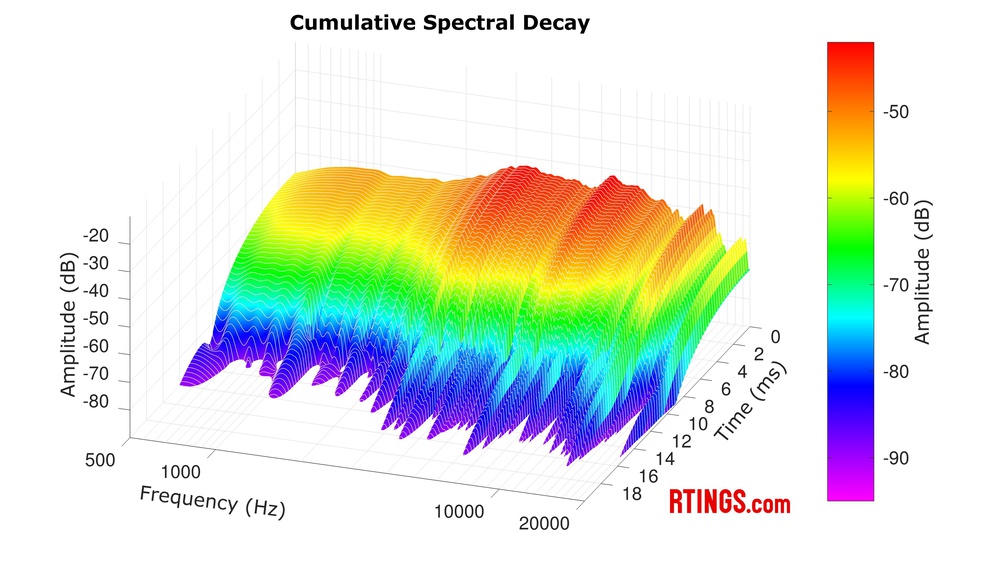
We're introducing a CSD graph that plots frequency response against both amplitude and time. We derive this waterfall plot from the impulse response function in Audio Precision, using a time window that allows us to test Bluetooth headphones, as well as traditional analog headphones within the same methodology. Not only can the way it's derived vary wildly from one published source to the next, but it can also be argued that the sole addition of a time axis on the acoustic space that represents the coupling of headphones to a human head is peculiar to a certain degree. We're well aware that Cumulative Spectral Decay for headphones is a polarizing subject, and its relevance can rightfully be questioned. We'll share our results for now, but we'd love your feedback! Are CSD graphs useful for you? Are they misleading or simply plain wrong? Do you believe that sustained resonances viewed on a CSD graph can be audible in everyday content? Leave us feedback below!
PRTF
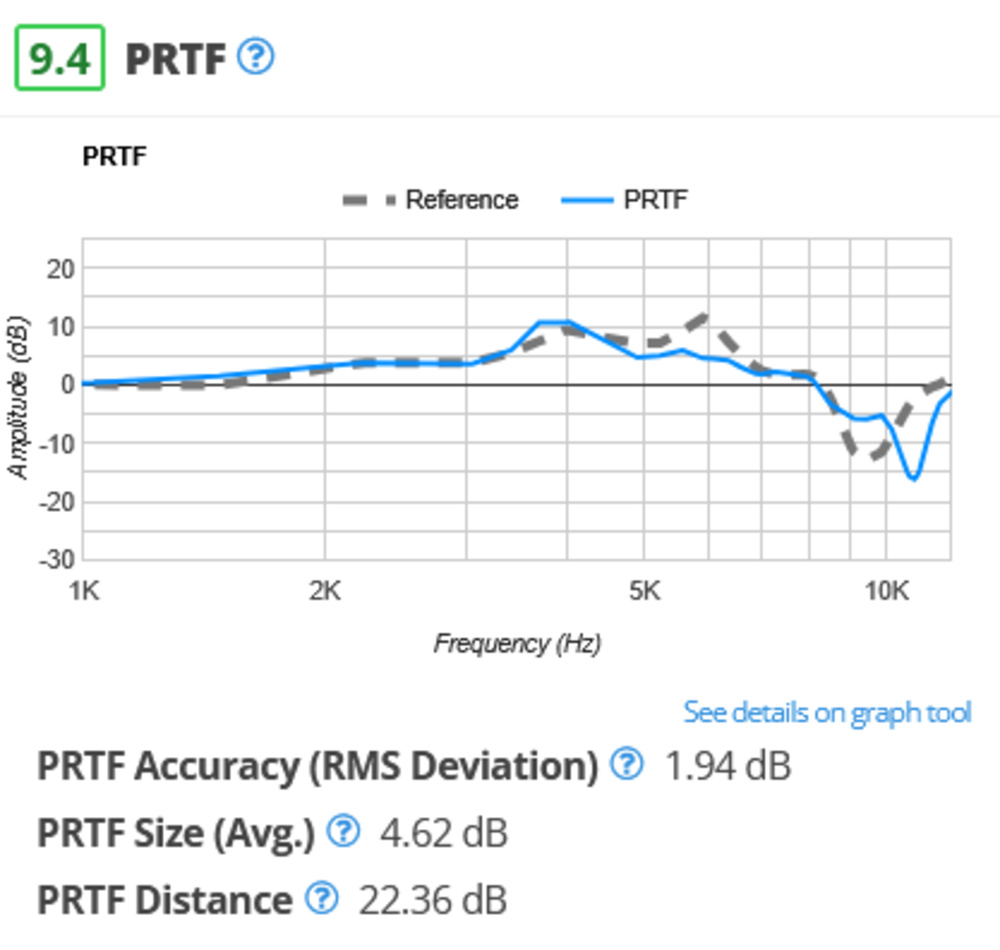
Like Stereo Mismatch, this test isn't entirely new but was re-formulated as we felt it didn't represent a complete assessment of what constitutes soundstage. While our method of comparing the pinna-related transfer function of headphones with that of an angled reference speaker allowed us to draw some correlations with headphones' spatial qualities, we're aware of its limitations and shortcomings in this regard. That said, we've decided to keep the test in the form of PRTF while removing Openness and Acoustic Space Excitation, as we still feel that it can offer partial insight into the spaciousness of the headphones' soundstage.
Harmonic Distortion
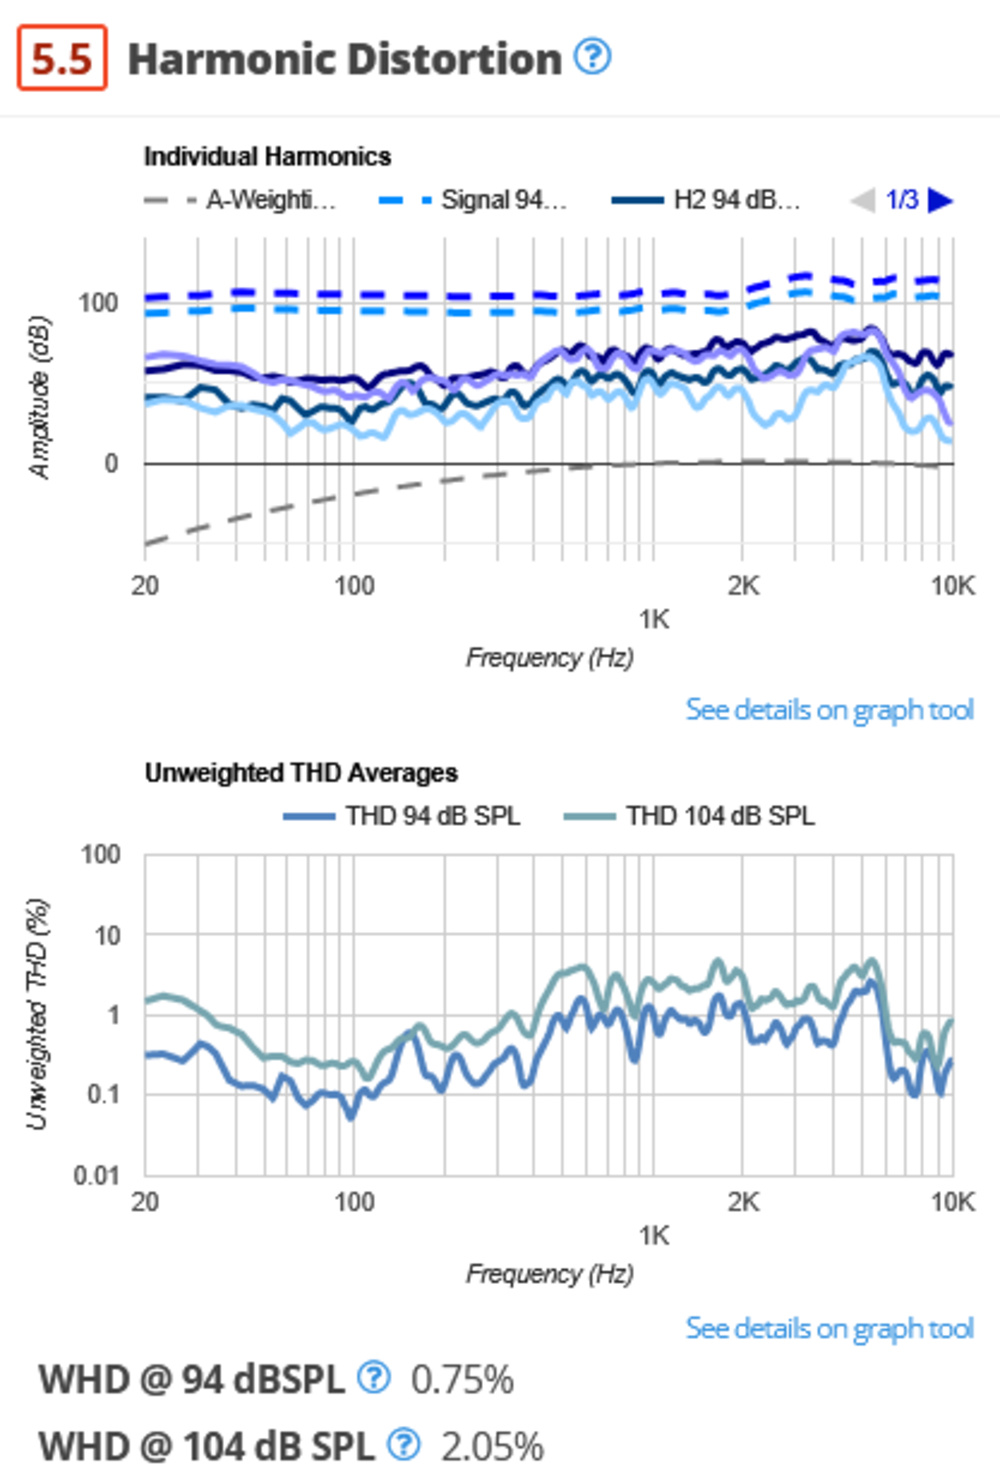
We've overhauled our harmonic distortion testing, too, revising our testing methodologies and the way we showcase our data. Using the B&K 5128 connected to our Audio Precision AP517b Analyzer, we now take distortion measurements at both 94dBSPL and 104dBSPL to match current industry standards.
We display our data as an unweighted THD graph, as well as in the form of weighted values at both 94 and 104dBSPL. For our weighted values, higher harmonics are given more weight using the weighting coefficient -n²/4. These harmonics are then A-weighted against frequency to account for the relative loudness perceived by the human ear, before an average is found.
Finally, for those who'd prefer to see an extra step between the unweighted THD and the weighted values, we also provide a graph illustrating the second and third harmonics at 94BSPL and 104dBSPL. We include the A-weighting curve to further demonstrate how headphones' distortion performance translates to the weighted averages.
However, we're aware of harmonic distortion's limitations as a comprehensive metric of audio fidelity, and we'd like to address this in the future. Is there a distortion measurement you'd like us to include in a future test bench? Let us know in the comments below.
Electrical Aspects
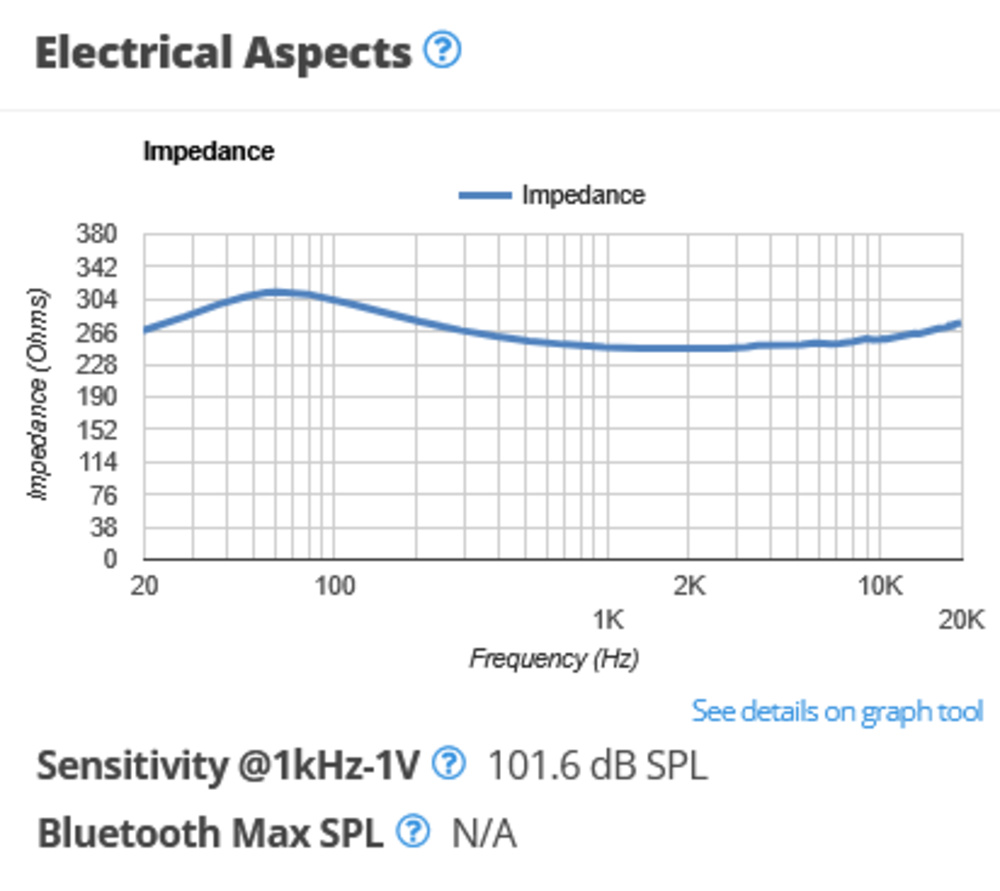
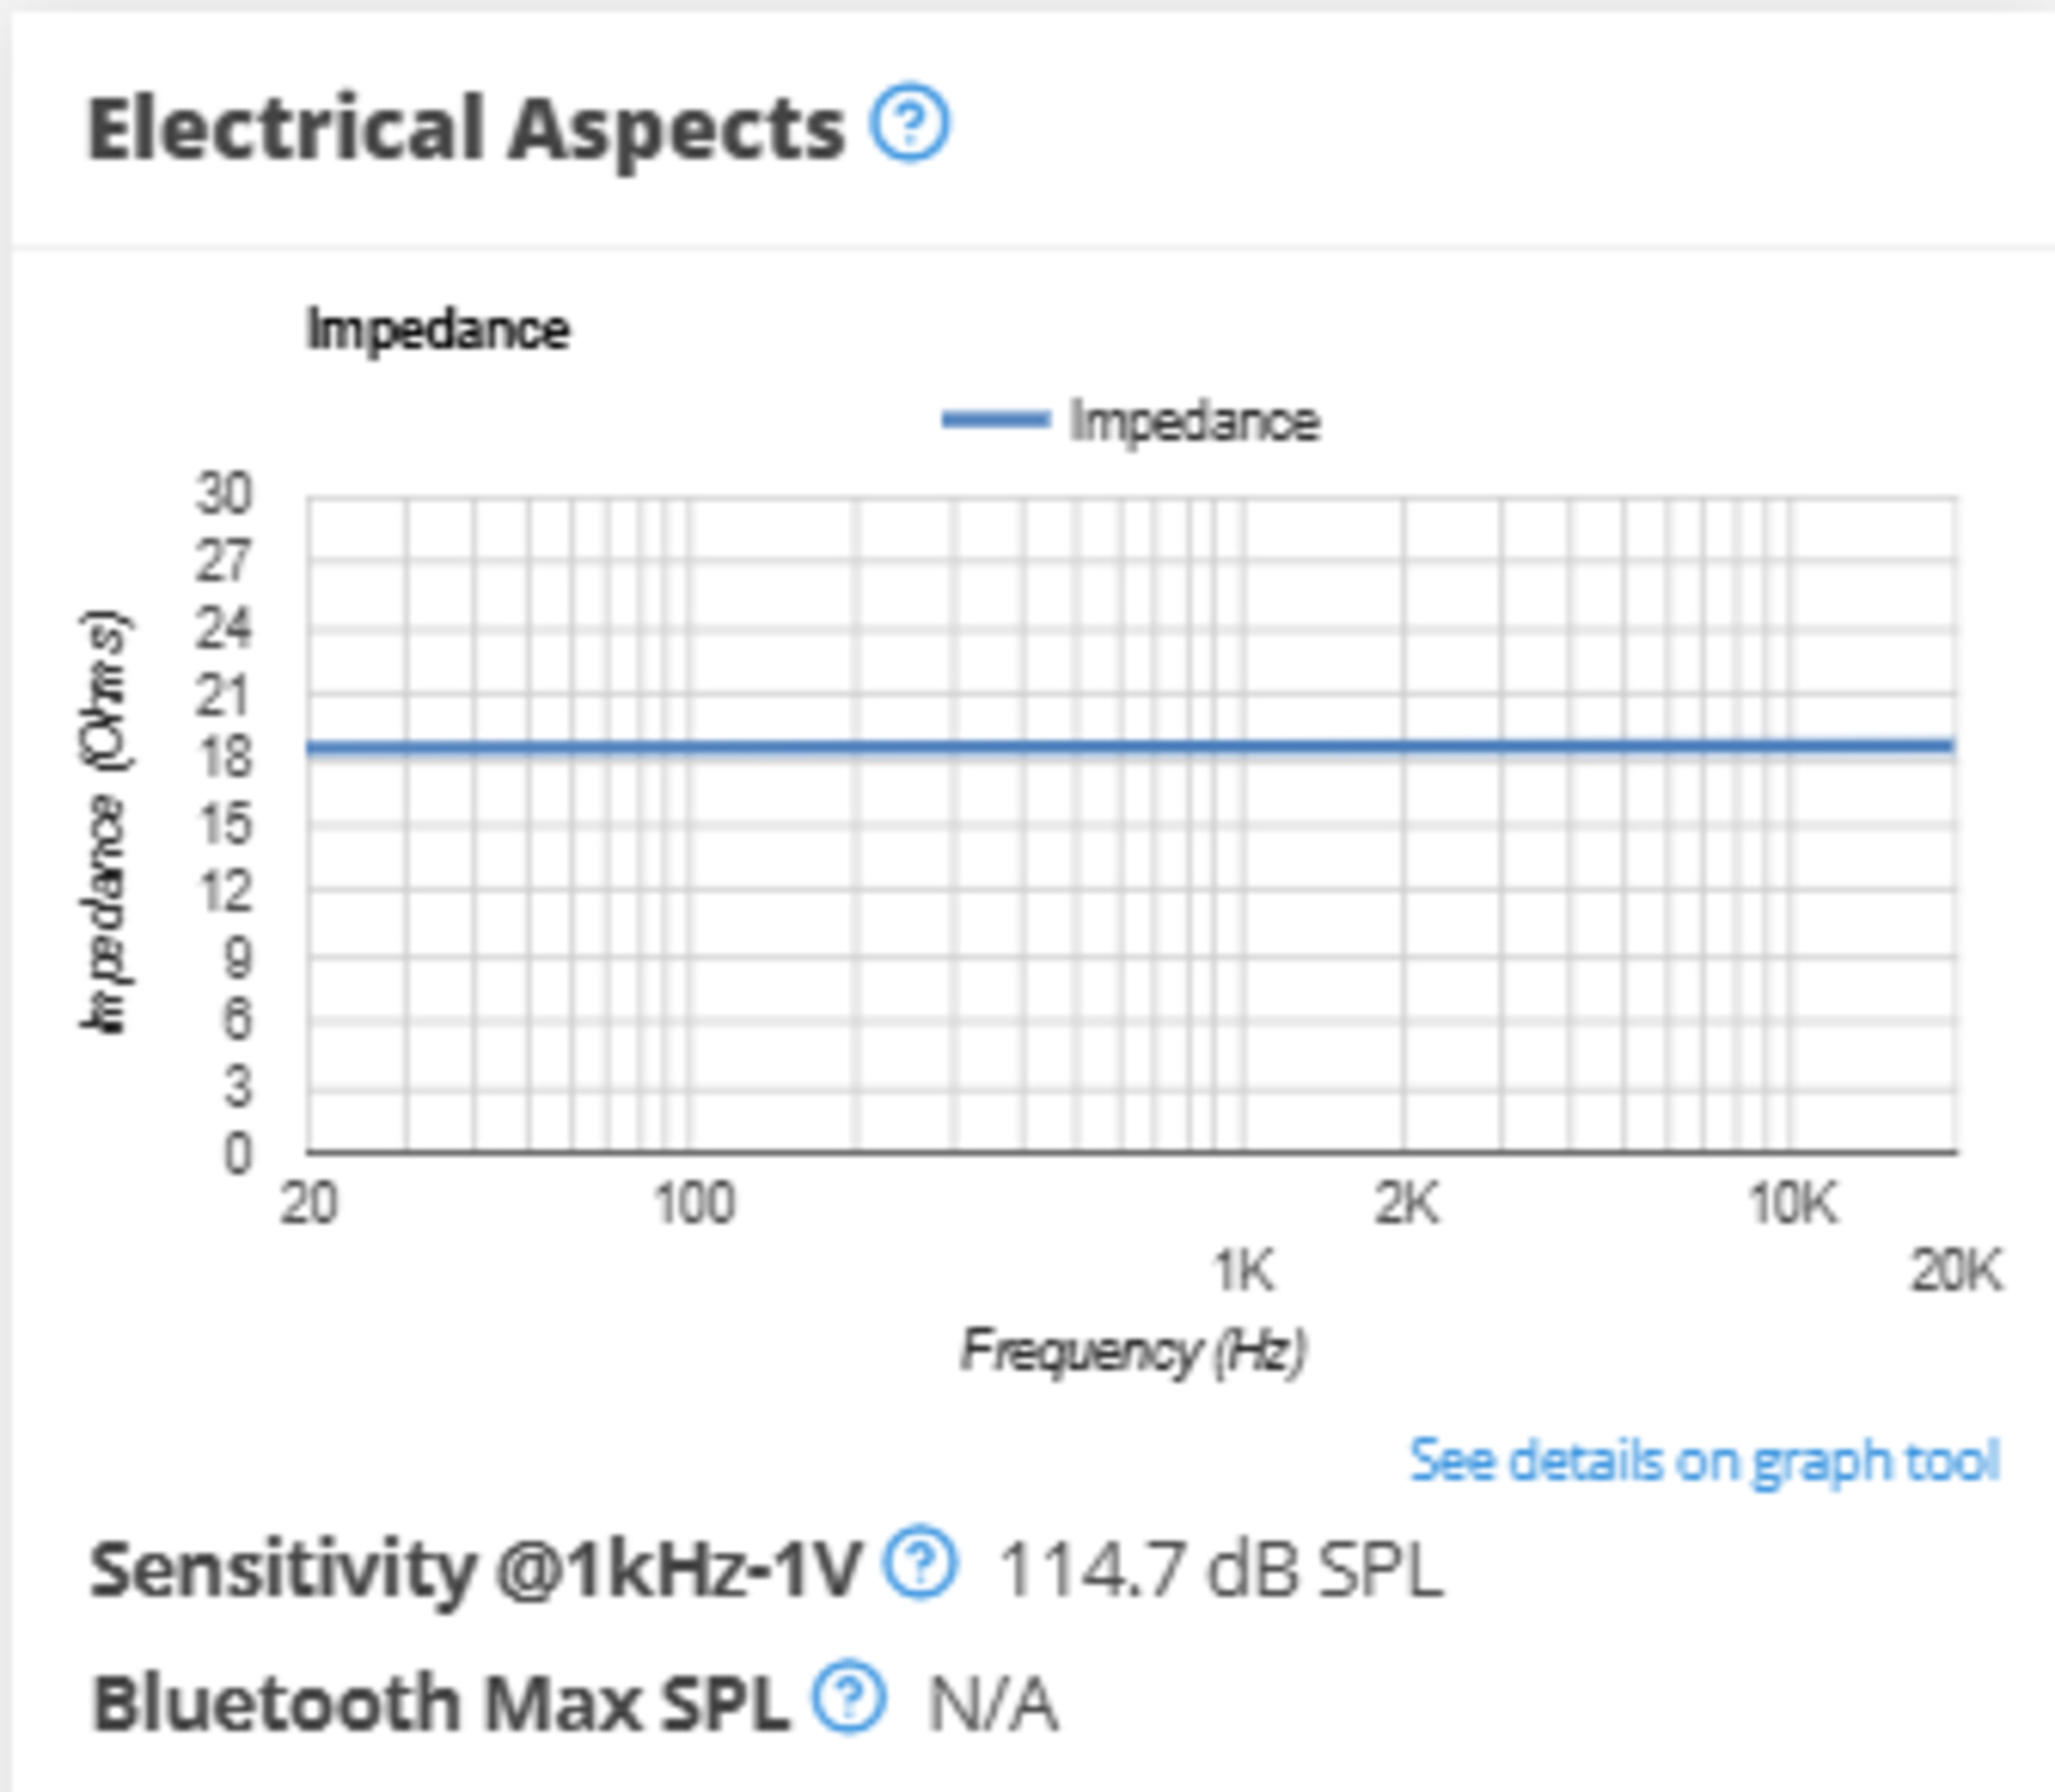
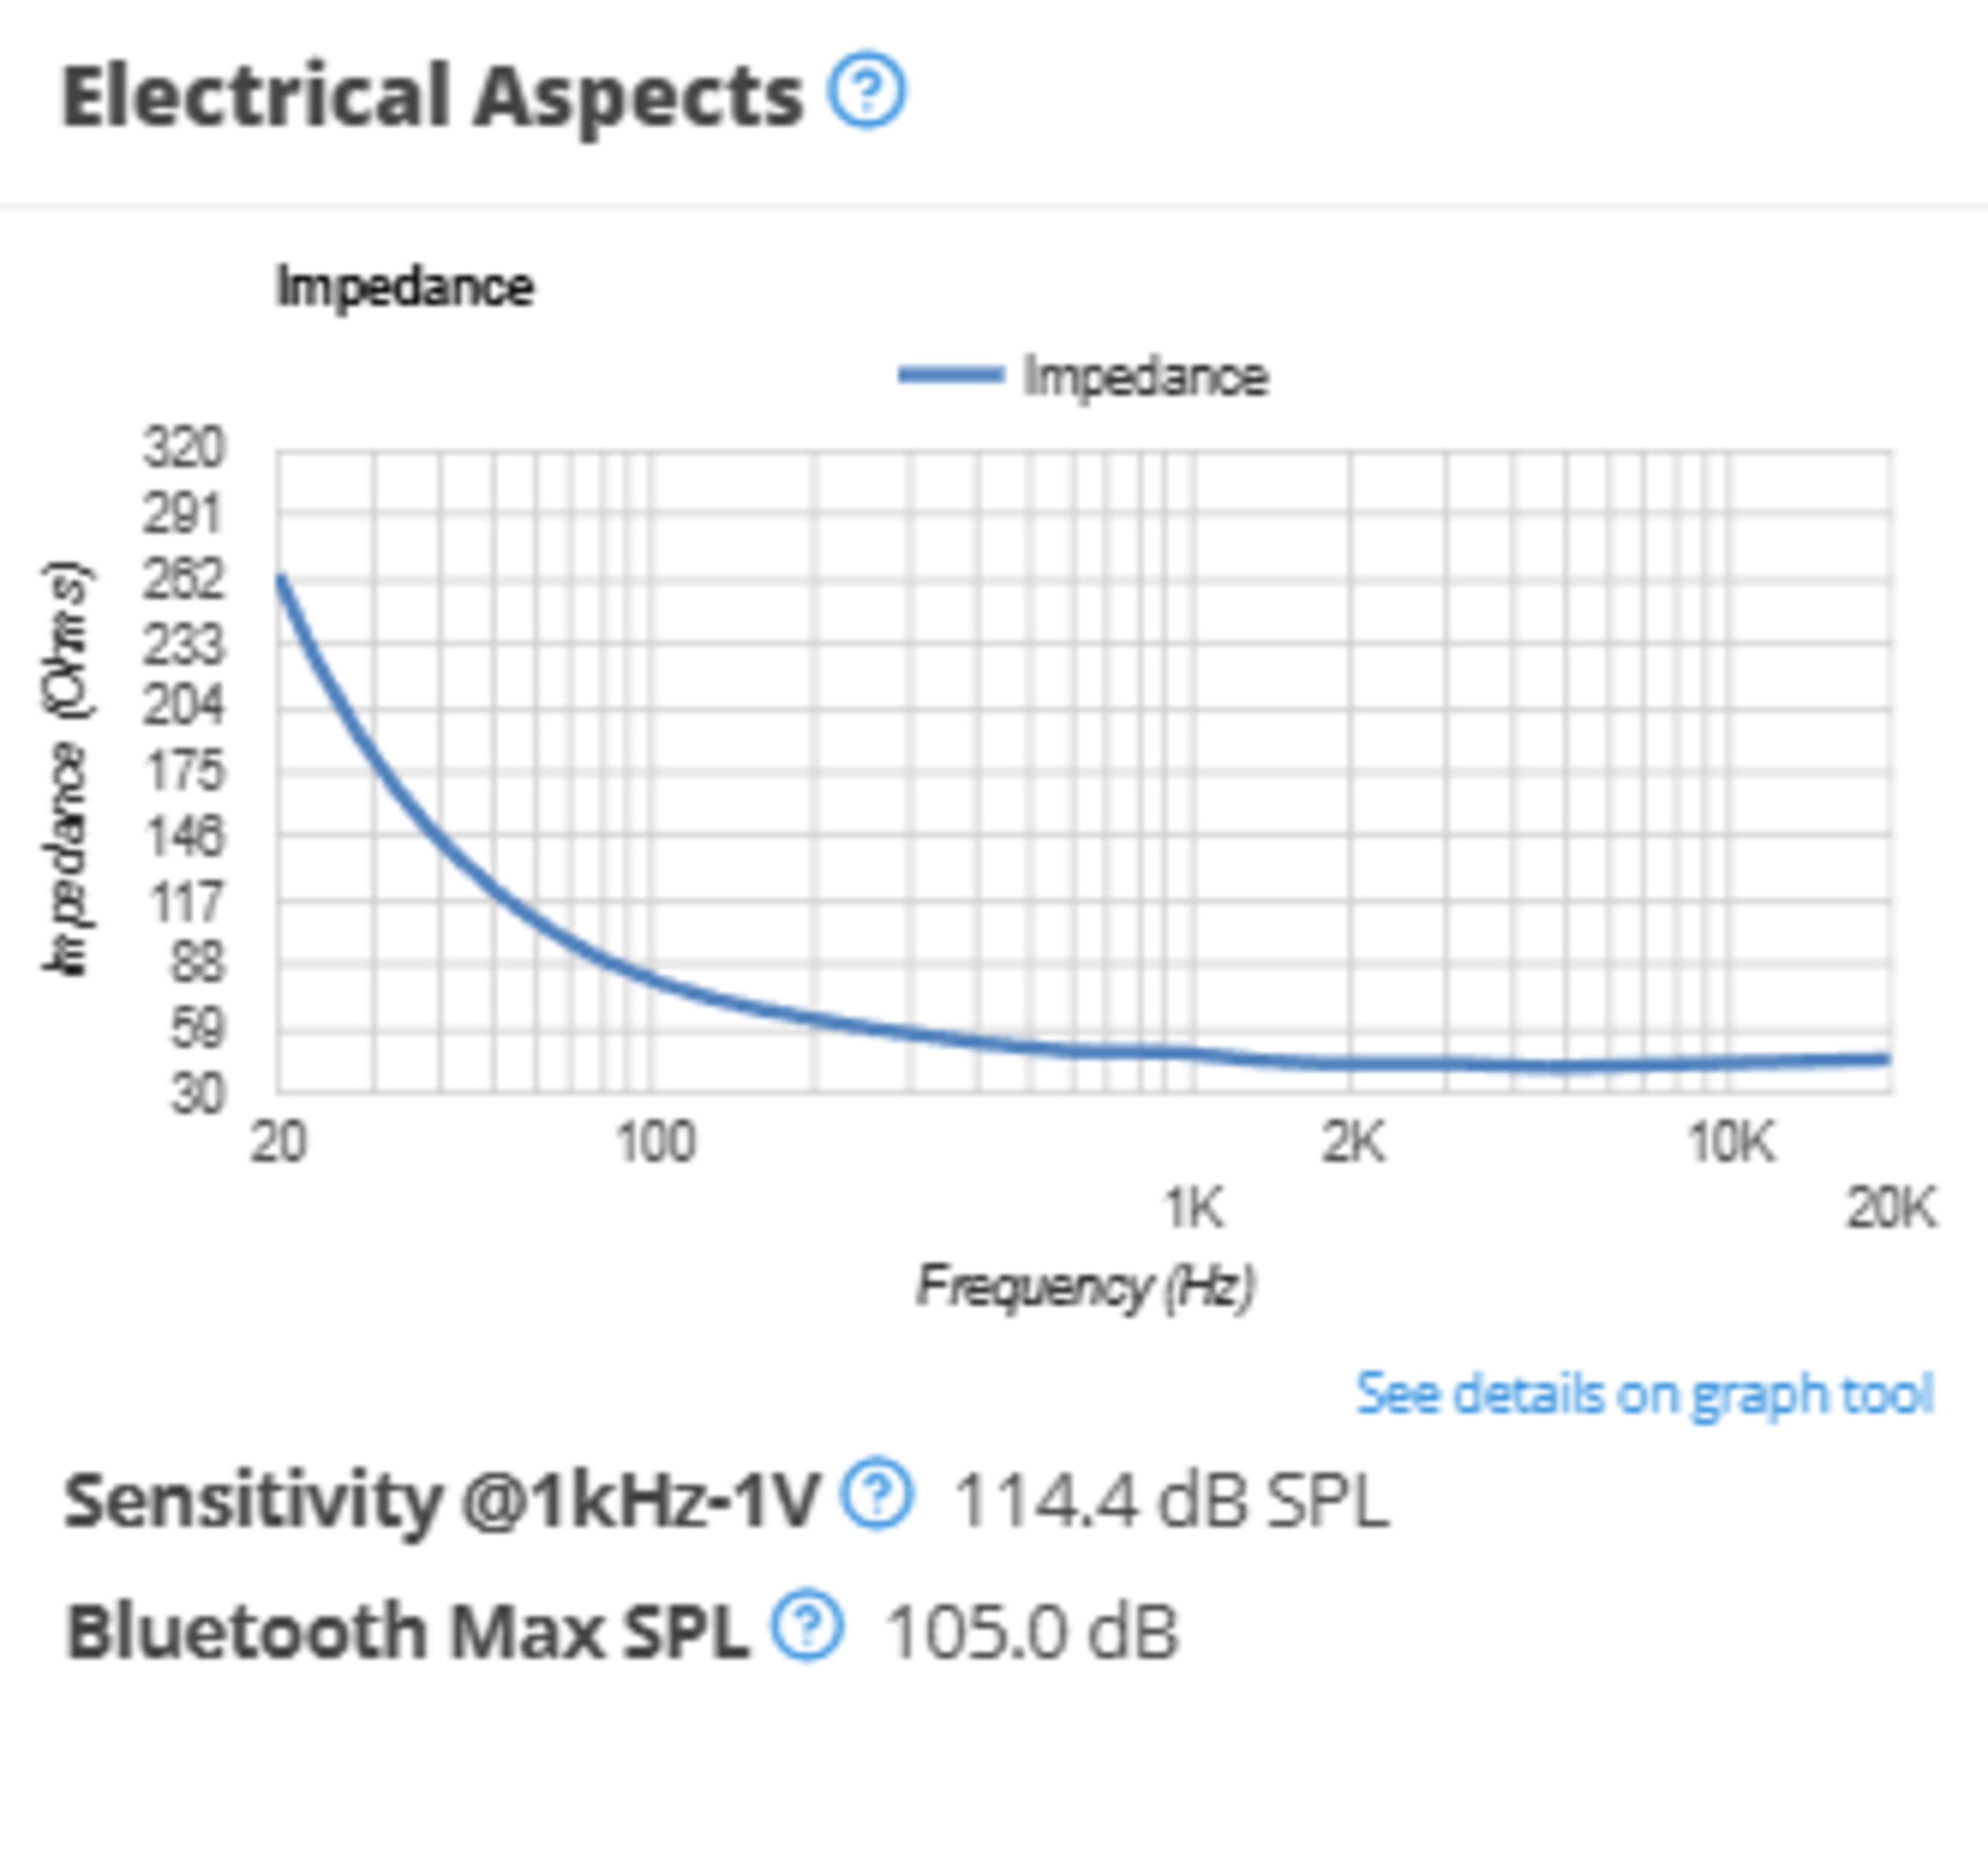
Finally, we decided to include a test box that groups together impedance, sensitivity, and Bluetooth max SPL. While sensitivity is listed in the ribbon, this box adds an impedance graph (for analog headphones), as well as a Max SPL value for Bluetooth headphones. This information can help you assess your amplification needs.
Release Plan
Over the next week or so, we'll be rewriting the reviews for our first batch of 40 headphones. We aim to publish these, as well as the R&D article, in mid-April. We'll follow up on this with further batches, gradually updating more headphones to our newest test bench. Going forward, we'll test all new headphones using the 2.0 methodology. Though we can't update every pair of headphones we've tested, we'll also update certain reviews on older test benches. We're also working on making the distinction between products tested on older test benches (using older methodologies and test fixtures) clearer and easier to identify. You can also expect changes to relevant test articles to be rolled out over the next few weeks, which provide more context for our changes.
Conclusion
This test bench results from many months of work from our audio team. But it wouldn't be possible without the many comments we've received over the years. Are there any tests you'd like to see in future test benches? Or do you have any opinions on our announced changes so far? We're always looking to incorporate input from the community to improve our testing methodologies, so please leave any feedback you have in the forums.
Comments
R&D Snapshot: Headphones 2.0 Preview: Main Discussion
What do you think of our article? Let us know below.
Want to learn more? Check out our complete list of articles and tests on the R&D page.
- 21010
I am happy that you brought back unweighted THD as some headphones have very high THD in the sub-bass region, and it is perceptible. Impedance is also a great addition as it would make it easy to figure out whether our smartphones can drive the headphones. CSD might be useful for reviewing new IEMs that come with piezoelectric and xMEMs drivers.
Glad to hear you agree with the changes! Looking forward to hearing your feedback on the whole test bench.
- 43230
I am happy that you brought back unweighted THD as some headphones have very high THD in the sub-bass region, and it is perceptible.
Impedance is also a great addition as it would make it easy to figure out whether our smartphones can drive the headphones.
CSD might be useful for reviewing new IEMs that come with piezoelectric and xMEMs drivers.
- 21010
Sounds good 🎉
- 21010
Will aptx lossless compatibility be in the new reviews?


