Since 2016, our team of testers, test developers, and writers has tested over 700 headphones! This allows us to create a comprehensive database of standardized measurements. Over time, we've also updated our test benches to improve our work. We recently launched Test Bench 2.0 for headphones, which features many of the improvements discussed in this article. Check out the Changelog to see exactly how we revamped our testing scores and methodologies.
Your feedback is at the core of how we think of and implement change. What we do isn't perfect, and while we test on a scale that few other reviewers match, we still have plenty of room to grow. We're just getting started, though! As we work on improving our headphones test bench, we want to openly discuss its future. Below are proposed solutions to issues raised by you, our community. This article focuses on sound, but let us know below if there are other things you'd like us to consider testing. Our solutions aren't set in stone, nor can we guarantee they'll work out. However, the best outcome comes from collaboration and feedback.

Sound: Measurements vs. Preferences
Sound is arguably the most important facet of headphones, but there are many ways to test it. We currently approach it from an objective perspective: we rely on our test rig to generate data. You can also see a more in-depth video of how we test sound here. This data is then measured against our hybrid curve based on Harman's research and is algorithmically scored in relation to what we consider are good values for most users. You may not find this target ideal for your usage or audio content, though.
Sound is highly preferential; our taste in audio genres, the kind of headphone design we like, the shape of our ears, and how we wear a pair of headphones all impact our preferences. While this is part of the direction we want to head towards, we recognize that it's hard to capture this nuance through data and measurements alone. Not everyone has the same level of knowledge when it comes to interpreting our results, and when the data doesn't align with your impression or expectations, it can hurt your trust in us. It also leads us to the core of this article: how can we change what we do to help you find the best product for your needs?
Our proposed changes:
-
Improving sound interpretation. Objective measurements are the bread and butter of what we do. However, it can be tricky to interpret this data and whether or not a pair of headphones will meet your needs. Additionally, the scale we're working on is quite large, and there's plenty to consider in ensuring our results are high-quality, trustworthy, and clear. That said, highlighting the role of preference and interpretation in certain sound tests is a good place to start.
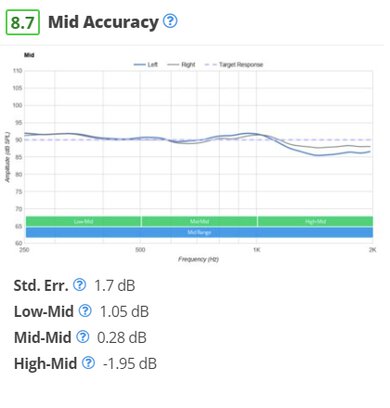
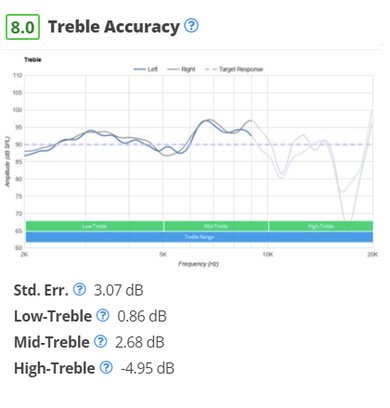
Tests related to the headphones' frequency response, like bass, mid, and treble accuracy, are based on (and scored against) our target curve. However, their current state may not give a good picture of whether you'll like their sound. We're not getting rid of objective measurements, though! Instead, we want to complement the data by clarifying the possibility of different interpretations depending on your preferences, which may or may not also align with our target. For example, if you like a more bass-heavy sound, our target curve framework may not make it easy to find what you're looking for.
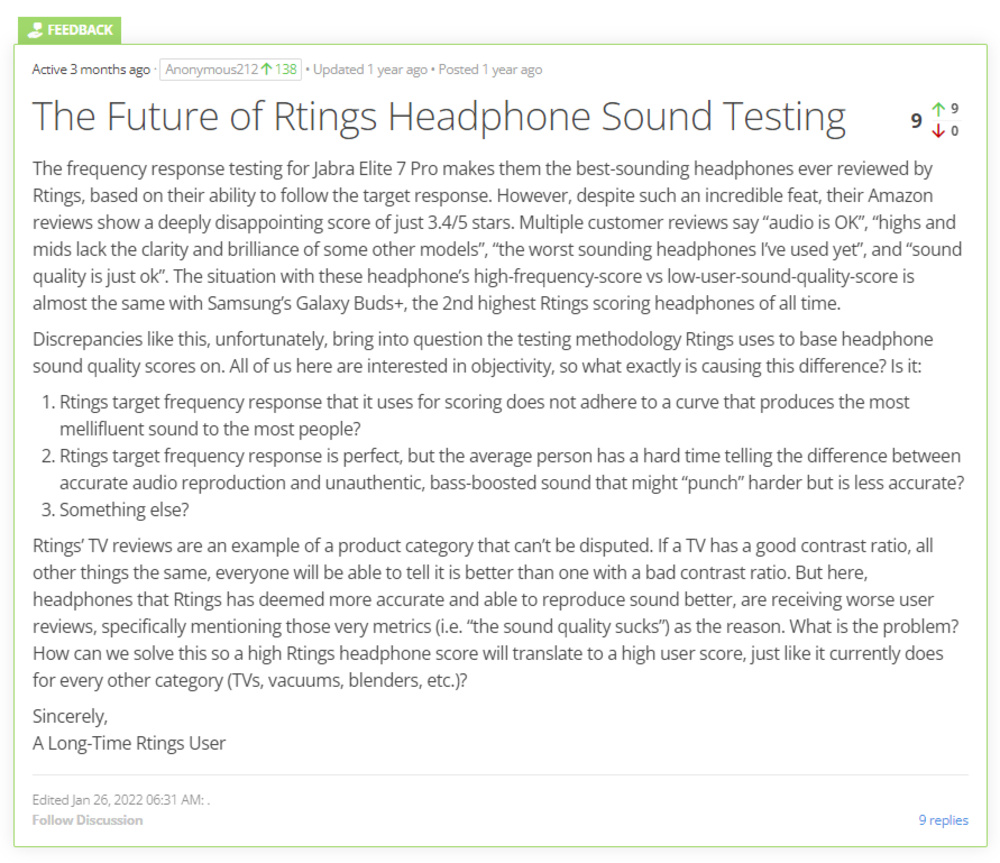
At the same time, preference-based tests factor into usage verdicts like 'Neutral Sound,' which are generally the first place users of all levels look to see if a product is right for them. Usages also let you quickly compare products against one another. However, some headphones can reach the same score by different means, which is a problem, especially when there are preference-based scores involved. For example, user griffinsilver216 notes that the top-scored 'Neutral Sound' headphones aren't 'tonally neutral' but are instead high performers in Passive Soundstage. This can lead to confusion over what are good-sounding 'neutral' headphones and make it difficult to trust our conclusions.
Example Bass Accuracy Mid Accuracy Treble Accuracy The HiFiMan Arya are audiophile headphones that match our target curve well. 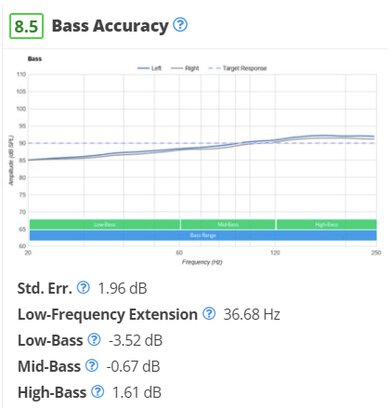
The JBL Endurance Peak 3 True Wireless are sports headphones with a bass-heavy sound profile. 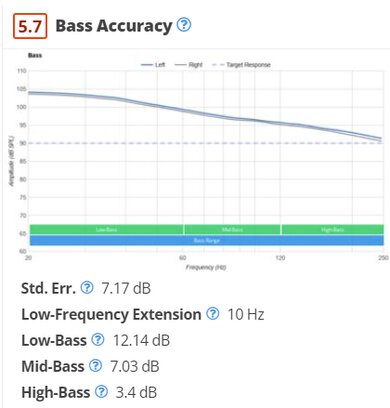
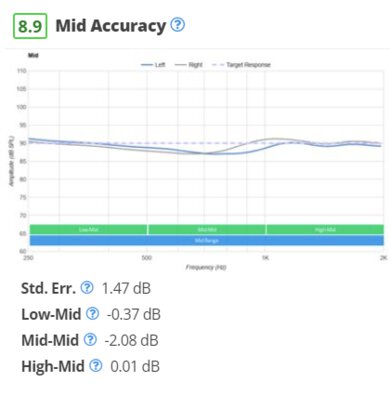
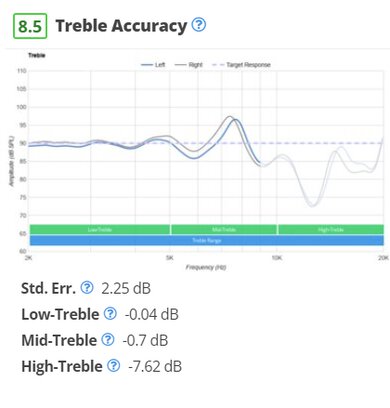
The Jabra Talk 45 Bluetooth Headset has a sound profile designed for vocal quality. 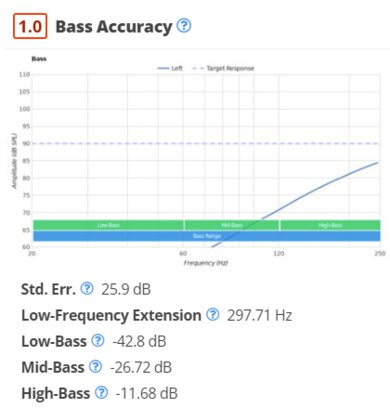
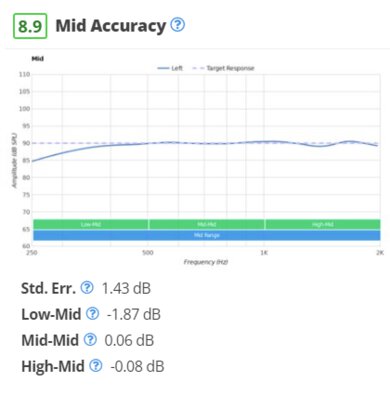
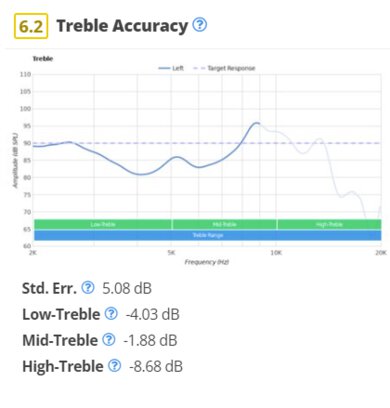 Although these three examples are just a couple of products from our entire inventory, you can also see the bass, mid, and treble accuracy responses of all of the headphones we've tested so far, sorted by 'Neutral Sound' here.
It's paramount to detangle our preference-based results from our scores. We can provide information on what most users like; however, it's also important to remember that sound quality is highly subjective and that there isn't a unanimous way to evaluate it. Removing scores from preference-based tests like bass accuracy can be one way to address the issue. However, understanding raw data may not be easy for everyone. We also recognize that our current resources, like graph tools and learn articles, may be inadequate for helping you make sense of the data.
We want to implement more robust tools to make sound interpretation simpler and more accessible. We're looking into equipping the raw frequency response test with more features, like selectable target curves and normalization adjustments, based on your preferences. There's also the possibility of selecting and comparing measurements done with different test rigs. Just like with the original raw frequency test, you'll be able to compare the graph of one pair of headphones to that of any other pair in our database. In addition, we also want to shift the emphasis to bass and treble amount, which can make it easier to see if a headphones' sound aligns with your own tastes. But more on that below!
Pros:
-
Improving sound interpretation by shifting attention away from target curve correlation and towards user preference allows you to judge for yourself whether a headphones' sound suits your tastes.
-
Improved usage weighting allows you to compare products with less emphasis on preferences.
-
New graph tool puts preference at the forefront of comparability between headphones.
Cons:
-
Can still be difficult for novice users to interpret/identify the best-sounding options for their tastes.
-
Verdicts with sound components would need to be reweighted to account for accuracy while considering variability in user preference.
-
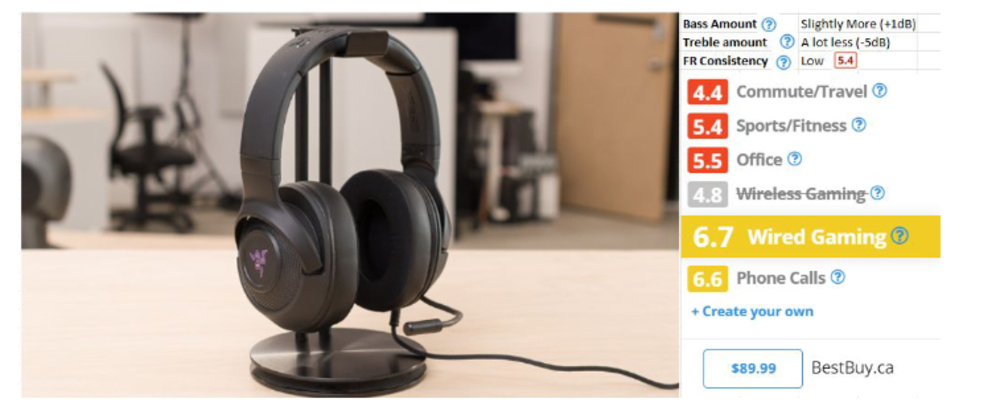
Make it easier and more accessible to find the right sound for your needs. Since it can be hard to sift through hundreds of reviews to find the right product, we're considering adding bass/treble amount and frequency response consistency to the top of our reviews. A word scale and concrete values (based on a target curve) let you immediately see if a product is worth considering based on sound. For example, if a pair of headphones have 0 dB of bass and treble, then this indicates that the sound follows a target that research shows most people will like.
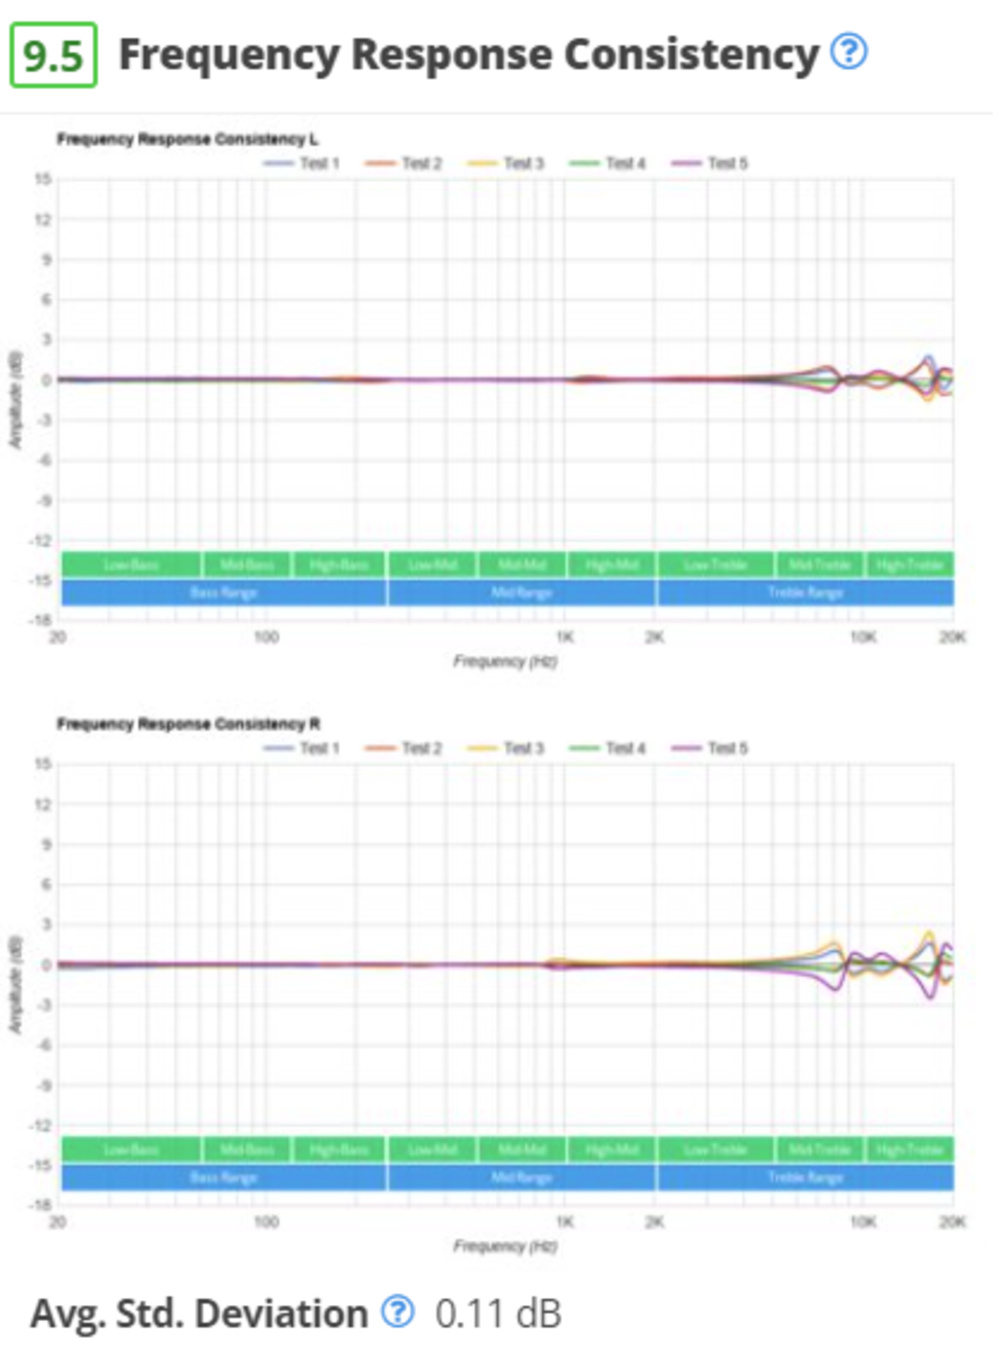
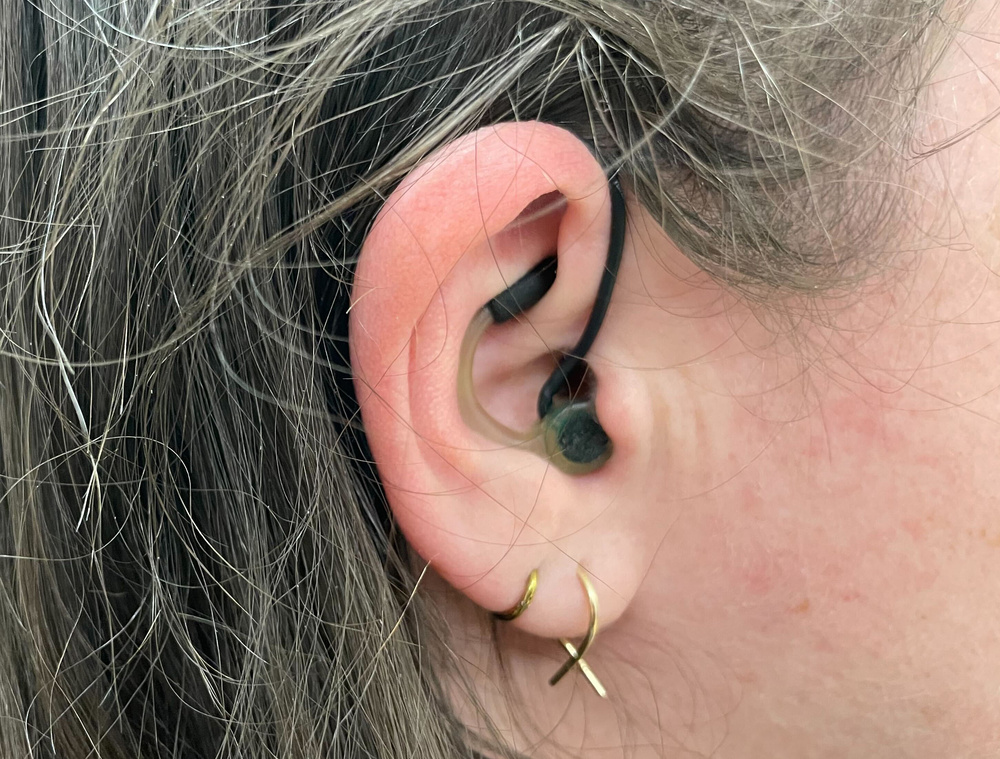
In addition, multiple reseats of the same headphones on the same person can result in different experiences. This is where frequency response consistency (FRC) comes in. FRC shows how sound deviates based on fit, positioning, and seal. Thick hair or wearing glasses can also disrupt the headphones' seal on your head and lower bass delivery. Color-coded FRC values can thus show whether a sound profile is (or isn't) representative of all users. A red score indicates that the consistency of our measurements is low and that our sound measurements can be different from your experience. Conversely, a green score indicates a consistent experience across reseats.
Example of the introduction to the Razer Kraken V3 X review.We don't want to dictate what 'good sound' is. However, we can make sound more accessible, simple, and transparent for users of all knowledge levels so you can see whether a pair of headphones' sound is right for you without diving deep into the data. That said, more advanced users can use these two stats to filter headphones based on the general overview of the sound profile and go further into more detailed results. This change allows you to compare multiple headphones with more control using a better graph tool.
Pros:
-
Adding bass/treble amount and FRC to the top of our reviews can be a simpler indication of a pair of headphones' sound in relation to preference.
-
Highlights the repercussions of FRC; can make it hard for us to recommend a pair of headphones, but it also ensures more transparency in our conclusions.
-
Can be used to make searching for ideal-sounding headphones easier.
Cons:
-
The bass and treble amount don't paint the full picture of a pair of headphones' sound.
-
Further highlight the role of performance-based tests. In addition to subjective, interpretive components of sound, there are concrete aspects worth showcasing that impact your buying decision. Performance-based tests like Frequency Response Consistency, Imaging, or Peaks/Dips aren't as subjective as preference-based tests like Bass Accuracy. Instead, they're more indicative of a pair of headphones' overall sound performance, and the desired outcome is more consistently agreed upon across users. Another way to see this is that bad results in a performance-based test can be a deal-breaker for most people when buying a pair of headphones. If we reduce the emphasis on our interpretation of preference-based tests, we should also reinforce the value of our current performance-based tests on user experience.
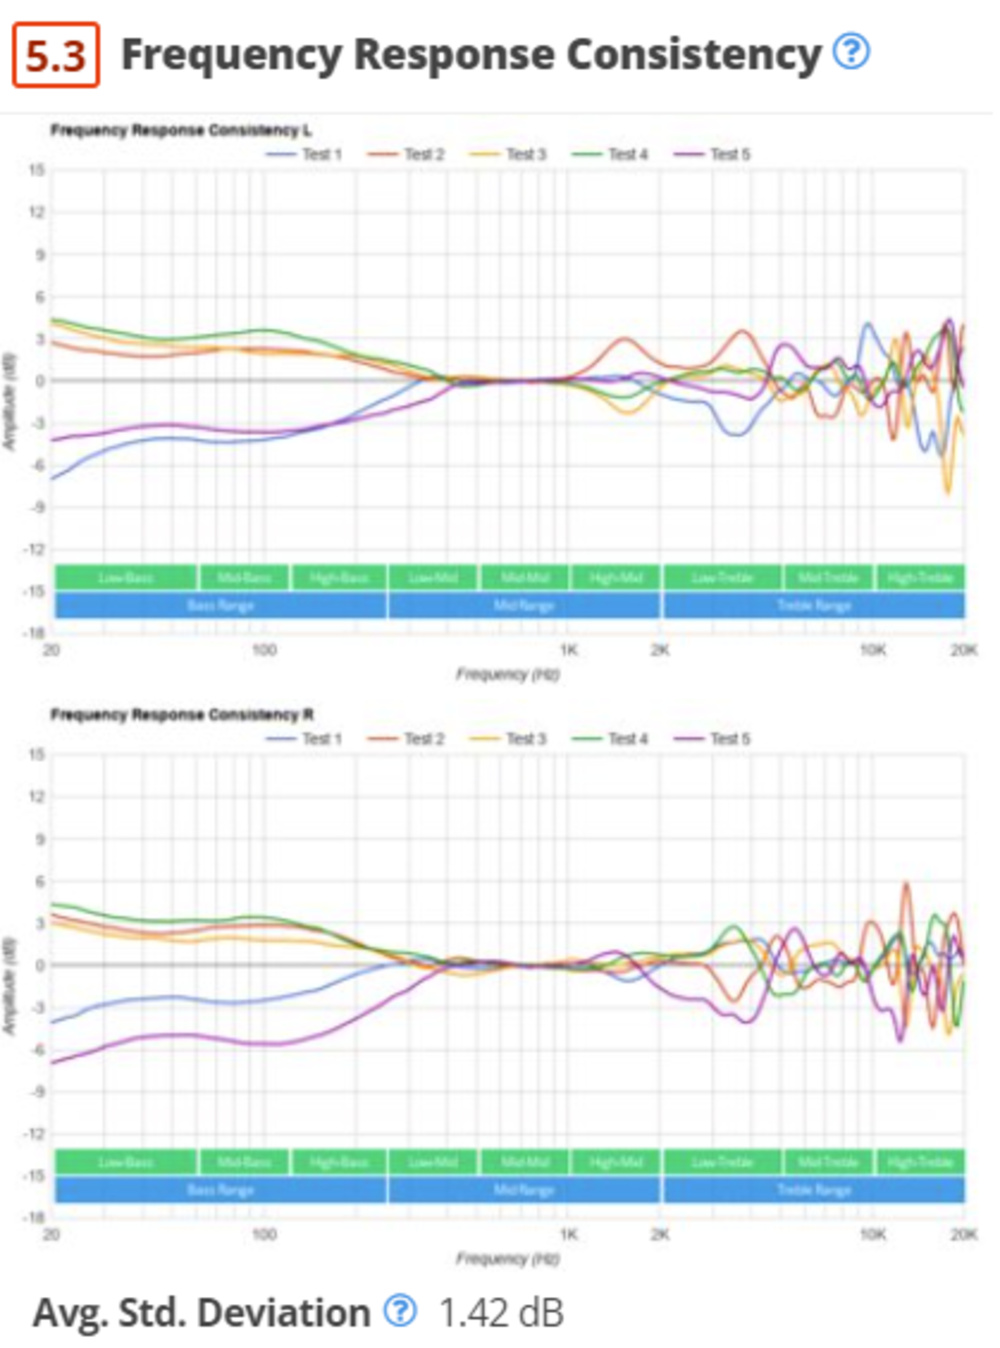 The FRC of the SteelSeries Arctis Nova 7 Wireless is sub-par. They're prone to a lot of inconsistencies in bass and treble delivery and are sensitive to fit, positioning, and seal.The FRC of the Jabra Elite 7 Active True Wireless is outstanding. They're in-ear headphones, and once you get a good fit and seal, you'll experience consistent sound delivery.
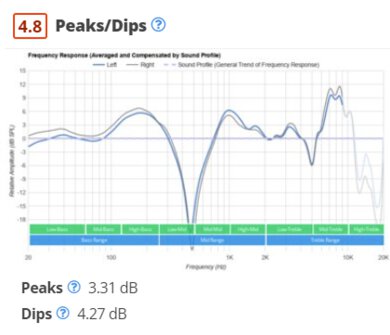
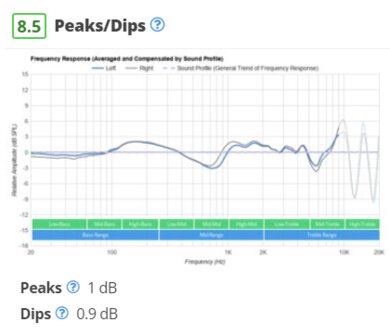
For example, Peaks/Dips tells us how well a pair of headphones follows its own sound profile. We flatten the general trend of the sound profile into a straight line and then compensate the headphones' frequency response against it, revealing peaks and dips. A good pair of headphones have a fairly flat response, but if there are a lot of peaks and dips, the headphones struggle to control their sound profile. Most people don't like large deviations in their headphones' sound profile, so a highly variable sound is a significant drawback. Peaks/Dips is only one example of a performance-based test, but another example is Frequency Response Consistency. Although we've already covered its importance above, ensuring that users understand the impact of these tests is beneficial in trusting our results and making buying decisions.
The Avantree HT5900 with poor peaks and dips.The MOONDROP KATO with excellent peaks and dips.
Pros:
-
Highlighting performance-based tests (like FRC) helps expose their impact on your own experience.
- Recommendations are more focused on performance-based sound tests—which users more consistently agree upon—and less stress is placed on preference-based tests, which are more subjective.
Cons:
- Some performance-based tests aren't easily understandable or clear for novice users.
What do you think?
-
What's your current impression of our sound testing? Where can we improve?
-
Should tests that utilize our target curve (like bass, mid, and treble accuracy) be scored?
-
How would you like to see a pair of headphones' sound reflected throughout a review?
-
What kind of tools/features would you like to see to help improve sound interpretation?
-
Are there usages you'd like to see (new usages or reworked ones)?
Test Equipment
In addition to fine-tuning our sound interpretations, we're also reassessing our equipment. Generating accurate and reliable data is the basis of our work, and we want to ensure that our data is of high quality. That said, we have to keep our measurements up to standard and strive to improve our test accuracy. Updating our methodology coincides with the opportunity to switch out our rig.
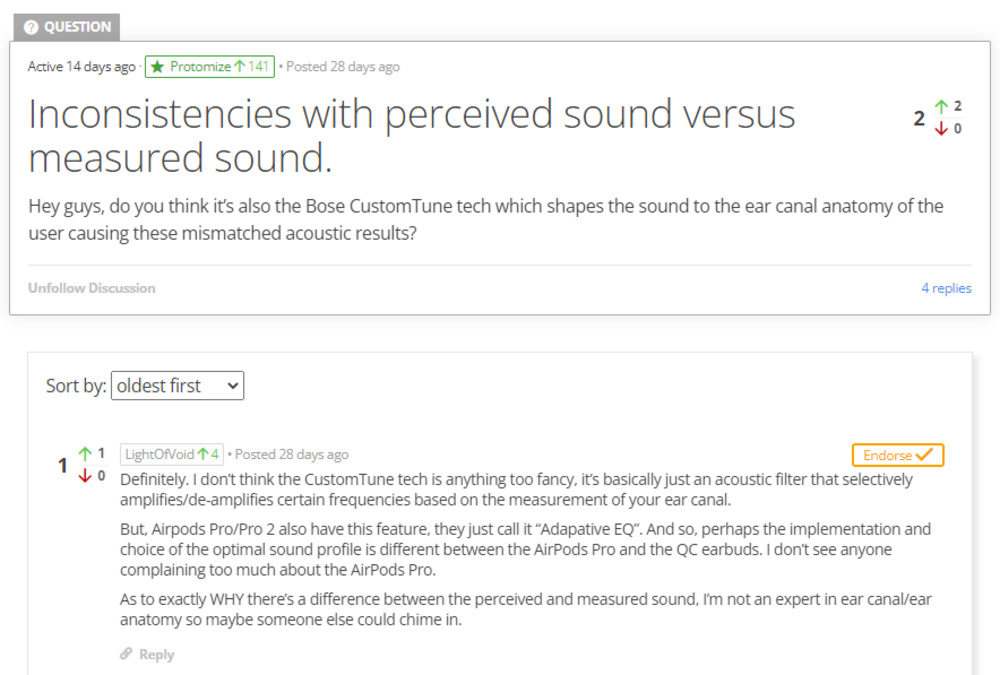
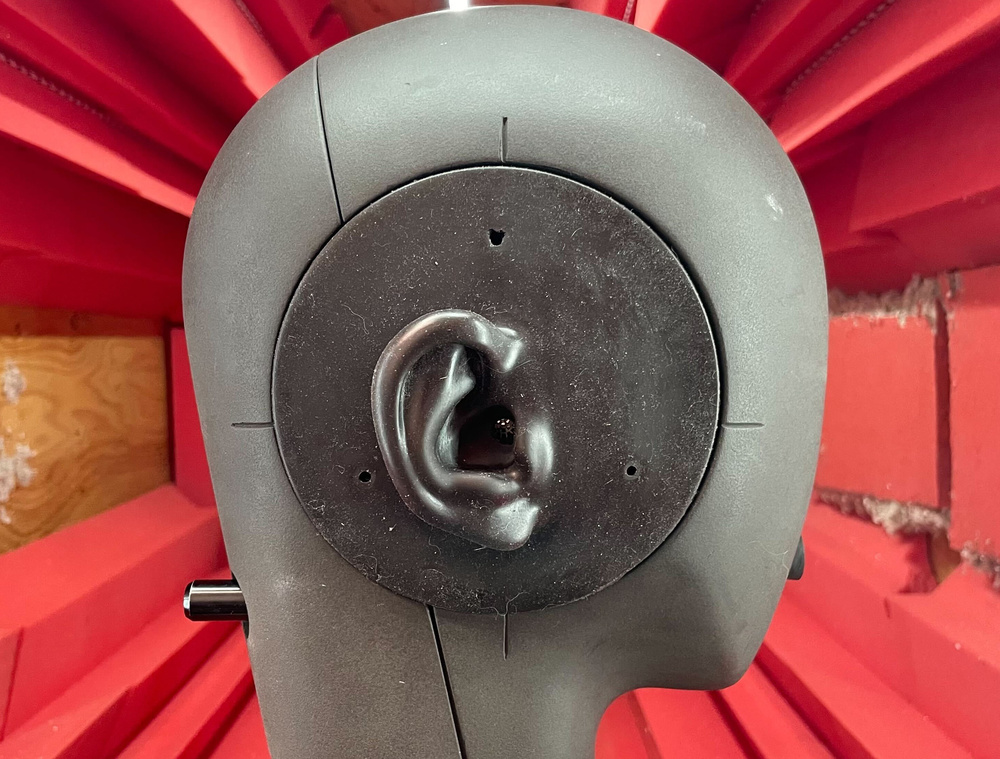
Up until recently, we exclusively used the HMS II.3, which produces reliable and comparable results. Our rig's ear canals are small, though, and aren't very human-like, making it tricky for earbuds and in-ears to form a proper seal. For example, the Bose QuietComfort Earbuds II Truly Wireless and Google Pixel Buds Pro Truly Wireless are bulky buds, affecting their fit. They can also shift in position and even rupture their seal through testing, lowering bass delivery. As a result, the quality of in-ear measurements is affected as both headphones sound like they have more bass than we measured.
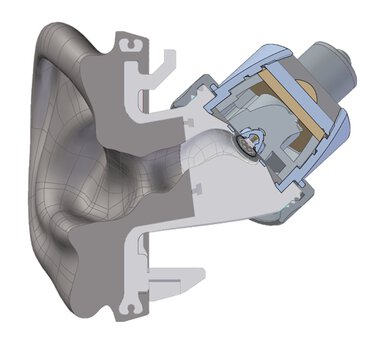
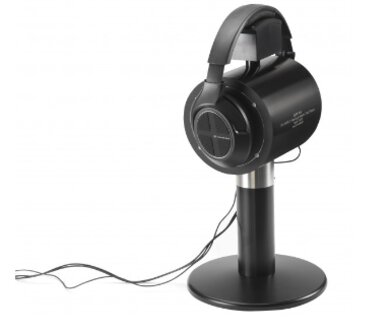
We've investigated several different audio fixtures, and in the end, we've purchased the Brüel & Kjær (B&K) 5128-B, though consideration was also given to the GRAS 45CA-10. Although other reviewers have used these rigs for years, we're not quite playing catch-up to them. Throughout time, we've amassed a large database of headphones tested with a standardized method, allowing you to directly compare two headphones with accurate data. That said, new rigs can help us further improve our tests, which you can then compare on a scale, unlike most other reviewers. Ultimately, we determined that the B&K head was able to provide the high-quality data needed, thanks to its more accurate ear canal and head representation.
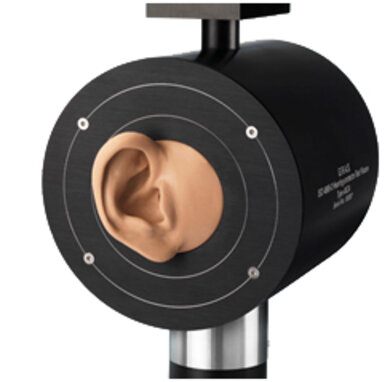
The B&K 5128-B
Pros:
-
The B&K 5128-B has more human-like ear canals; this can help us improve bud fitting and avoid rupturing the seal.
-
A more modern coupler that offers an improved representation of high-frequency ranges.
-
Better mouth speaker.
Cons:
-
Only one type of ear model is available to us. Although this ear model is realistic, more attention is needed when placing over-ear headphones on the head to ensure a correct seal.
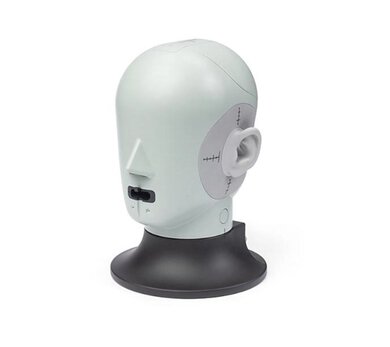
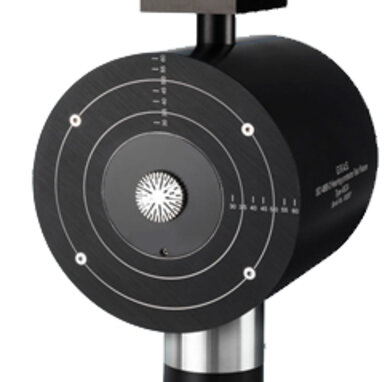
The GRAS 45CA-10
Pros:
-
The GRAS 45CA-10 was used to derive the Harman target.
-
Has a flat plate design, making it easier to ensure a good seal for measuring over-ears.
-
GRAS offers two different ear designs (with a small or a large pinna); it can help us see more differences when measuring the sound of over-ears across users.
-
A more modern coupler that offers an improved representation of high-frequency ranges.
Cons:
-
Isn't the best choice for in-ear measurements; lacks human-like ear canals.
-
Isn't shaped like a normal human head.
Each rig offers different pros and cons, though, and there isn't one rig that's better than the other. However, a collective system can help account for the difference in philosophies and approaches between fixtures. Each rig helps us improve our tests, some of which are unique to us. Once we get them in, we look forward to sharing more about them with you!
Noise Isolation and Adaptive ANC Technology
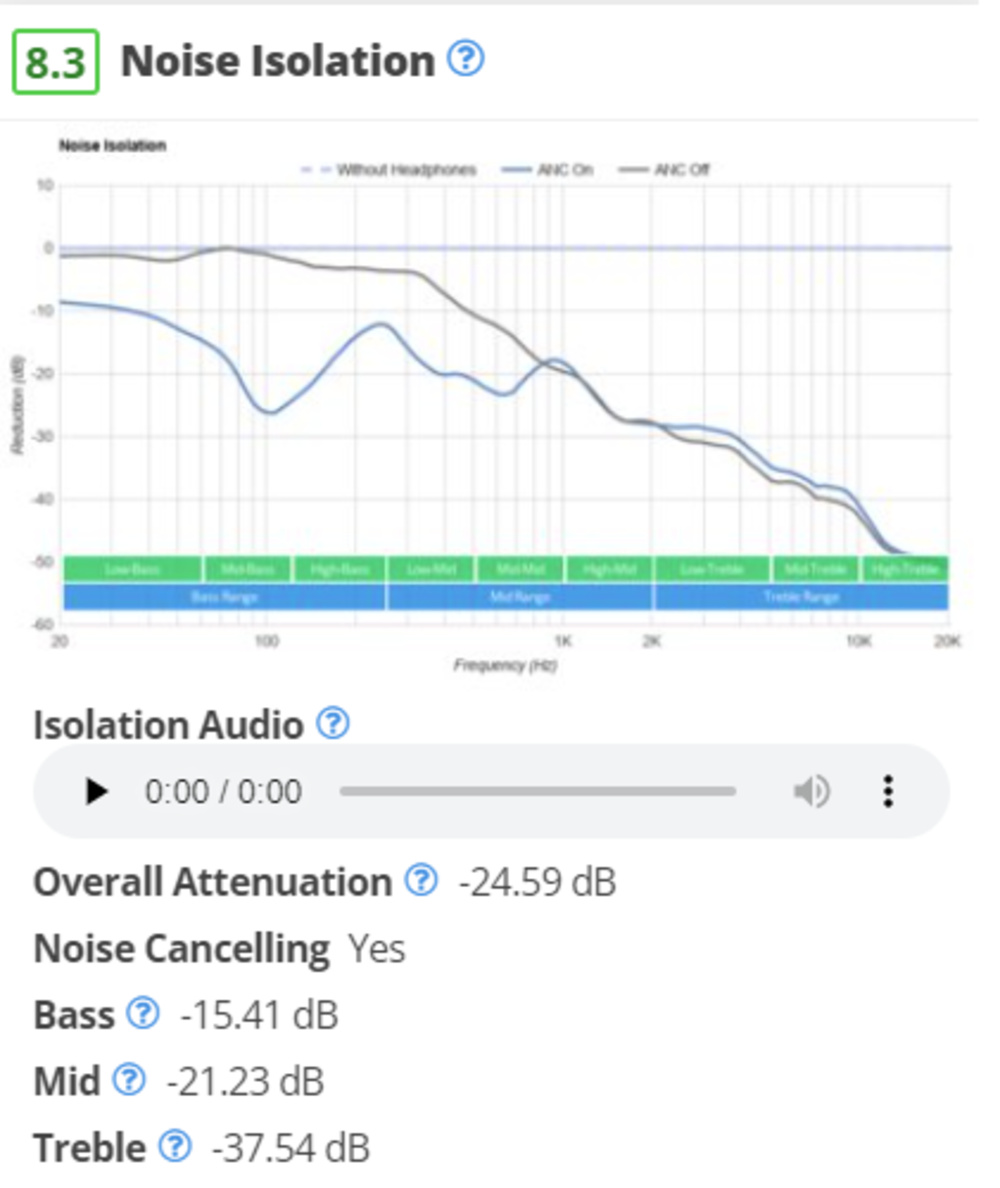
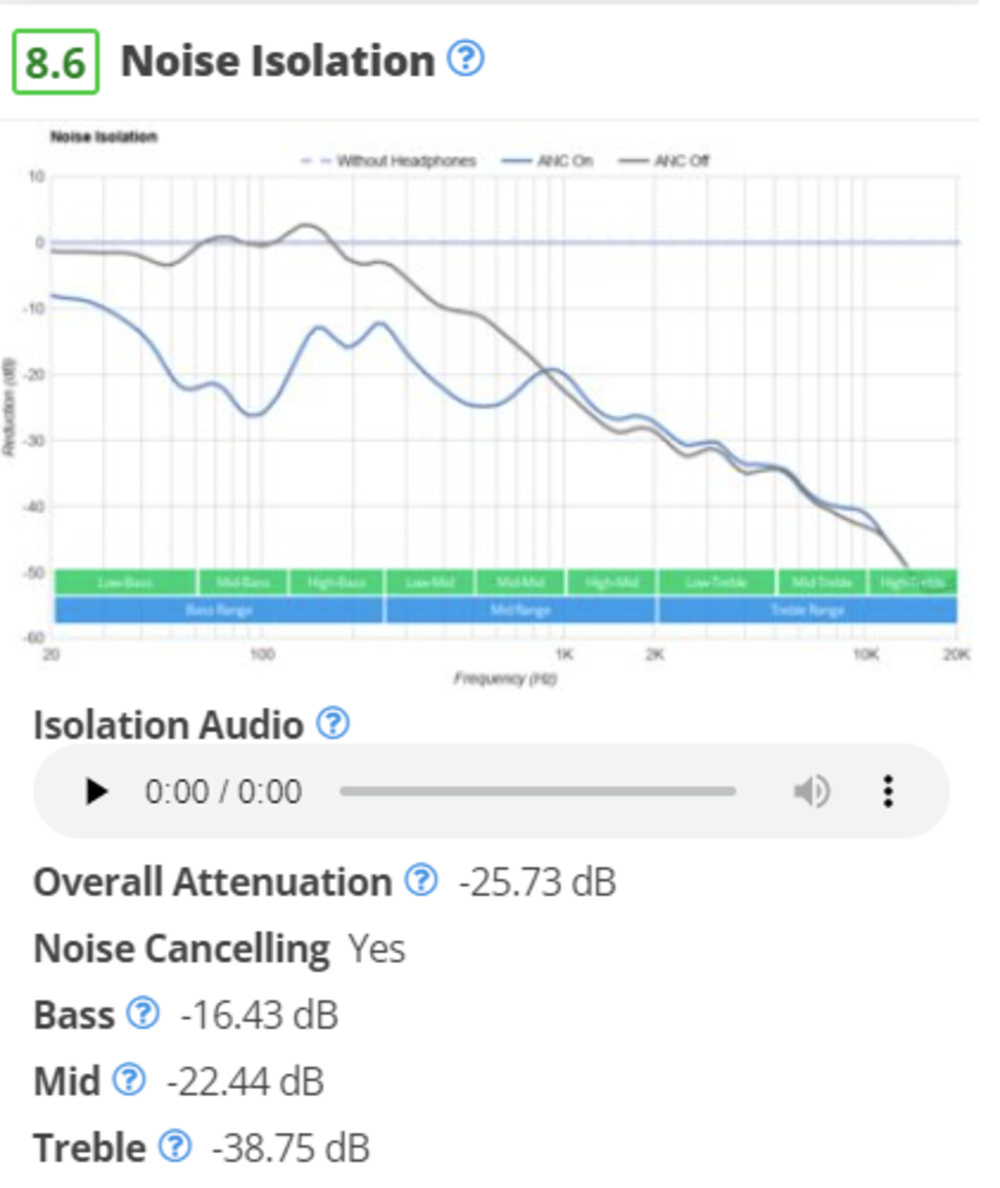
Adaptive active noise cancelling (ANC), like on the Apple AirPods Max Wireless, is becoming more common. This smart technology automatically adapts to your environment in a short period, and it varies in level depending on the noise around you. Our current methodology is becoming inadequate for tackling dynamic and constant noises commonly found in real life. Although our approach uses a signal sine sweep, this has its limitations.
As user thomasmusic55 also describes, these ANC systems can take time to adapt to a particular sound. Isolating single-frequency bands may not give the adaptive ANC enough time to adapt either, which can result in a worse performance. While the results are comparable between headphones, we need to do a better job of representing the product's actual performance. In response, we've tried lengthening our sweeps to see if there's a change over time. Some headphones, like the AKG N700NC M2 Wireless, perform better with a longer sweep as the ANC system has more time to adapt. However, the adjustment occurs incrementally by small frequency ranges. In real life, the ANC would be exposed to multiple frequencies at once and for longer periods. To account for this, we've tried testing a couple of headphones subjectively in dynamic environments like a subway station to check whether these impressions and measurements line up. However, these methods aren't perfect and are temporary solutions to a larger issue.
Our proposed changes:
-
Use real-life examples. It's worthwhile to refresh our current audio samples and examine new ways of capturing noise isolation. Sounds like plane noise or the noise of AC units, for example, are constant and predictable (in frequency, amplitude, and duration) and are more representative of day-to-day life than a sine sweep.
Pros:
-
New noise isolation audio samples help us better represent and test adaptive ANC.
Cons:
-
Not all real-life examples will be applicable to users.
What do you think?
-
How can we improve this test?
-
Are there real-life sounds you'd like us to consider using?
What's Next?
This framework is the first step toward change. While these processes take a long time, we've already purchased new test rigs, which allow us to generate reliable as well as more current data closer to the human experience. That said, there are even more things to consider when improving our methodology—like adding LC3 codec latency or testing transparency mode. We can't do this alone, though. We want to hear from you: how can we improve our testing and methodology? Are there things we haven't covered here that you want to see in a new test bench? Please write to us below and let us know your thoughts!
Recent Updates
September 25, 2024 We've updated the article to clarify that we purchased the B&K 5128-B.
April 24, 2023 Added the 'Recent Updates' section and clarified how improving sound interpretation complements our objective measurements.
Comments
Improving Headphone Testing: Measurements vs. Preferences and More!: Main Discussion
What do you think of our article? Let us know below.
Want to learn more? Check out our complete list of articles and tests on the R&D page.