See the previous 1.8 changelog.
Headphones 2.0 introduces an array of changes to both usages and tests to improve the usefulness of our test suite. This changelog looks different from our usual changelogs as it features commentary from our test designer, Pierre, explaining some of the rationale behind our decisions to help give you greater insight into the changes. We've also published an R&D article, specifically explaining our Cumulative Spectral Decay (CSD) measurements in greater detail.
What's Changed?
| Test Group | Description |
| Sound Profile/Raw FR |
|
| Frequency Response Consistency |
|
| Stereo Mismatch |
|
| Group Delay |
|
| Cumulative Spectral Decay |
|
| PRTF |
|
| Harmonic Distortion |
|
| Electrical Aspects |
|
| Breathability |
|
| Usages/Performance Usages |
|
| Ribbon |
|
You'll notice that we've rearranged the order in which our tests appear within each review. We wanted to ensure that our revamped sound tests had better visibility, so we moved these to the top of the review.
New Features
Multi-Target Graph Tool
We've added an interactive graph tool that can compensate a response to a range of targets. You'll notice that if you click on the Sound Profile, Raw FR, or Bass, Mid, and Treble compliance graphs to enlarge them, you can now view comparisons with other target curves validated on the B&K Type 5128 HATS, such as the Harman IEM target, the SoundGuys.com headphone target response curve, the SoundGuys.com studio curve, and a diffuse field response, among others.

Test Designer Pierre's Notes: First, regarding the Multi-Target Interactive Graph tool, we want to credit our fellow headphone researchers and technical reviewers who contributed to this. It's a real collaborative effort. Knowledge is meant to be shared, and everybody wins if we all work together. We couldn't be more thankful. Here's a breakdown of those targets:
1. RTINGS.com Target Curve: Our in-house curve is designed to reflect what we believe offers the most balanced listening experience for a general audience. You can learn more about it in our previous headphone R&D article.
2. Harman IEM Target Curve: Developed based on extensive research into listener preferences, the Harman target curve is the most widely accepted reference for IEM measurements.
3. SoundGuys Curves: We feature both of the SoundGuys target curves: their Studio Curve and the Headphones Preference Curve. Their approach is to derive an ideal response based on a number of earbuds and headphones that have reference status and a high preference rating.
4. SenseLab/Aizu Target Curve: This curve was developed through research involving both Danish and Japanese listeners. Thirty-two headphones' sound signatures and documented targets were evaluated. The final target curve was derived as the average of the five highest-rated curves by 56 participants.
5. B&K 5128 Diffused Field Response: This one shouldn't be considered a target. It's the head-related transfer function of the Type 5128 head simulator when placed in a flat diffuse field. Although the ITU-R BS.708 standard proposed in 1990 stated that studio monitor headphones should be voiced according to a diffuse field HRTF, it has been since essentially disqualified, as most people wouldn't find this a desirable frequency response.
We chose these targets as they're researched and validated preference targets. While we recognize some other targets, most are essentially reviewer-specific preferences on a Tilt Value of the Diffuse Field response of the 5128, which has value, too. Dr. Sean Olive from Harman also conducted some studies on various target curves for the 5128 and presented a seminar on his findings at the latest edition of CanJam NYC. The conference was titled: 'New Headphone Target Curves Defined on the B&K 5128: How Different Do They Sound and Which One is Most Preferred?'
Harman happened to share our view in terms of validated target curves. In Harman's terms, validated means validated in controlled listening tests.
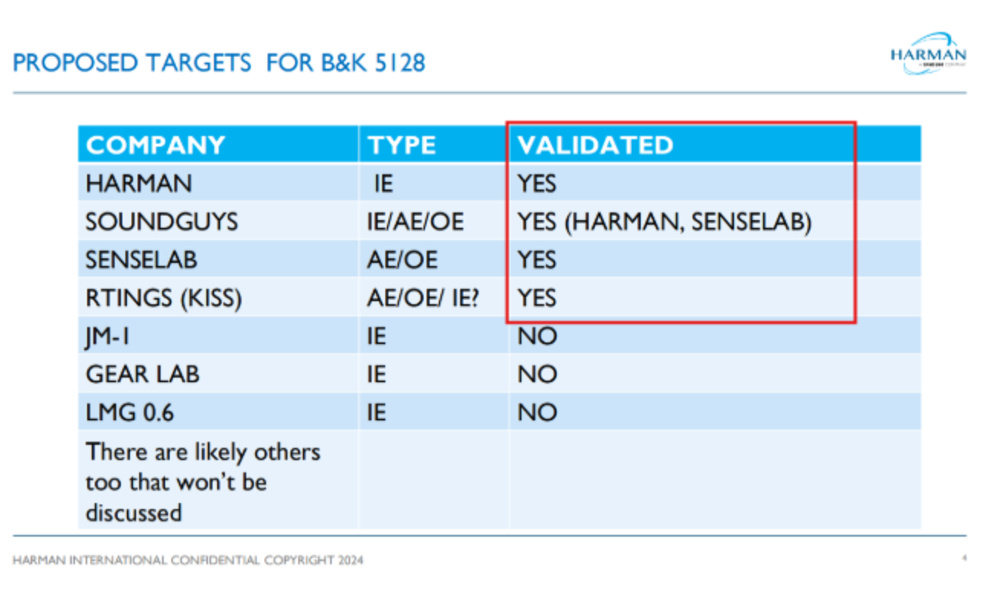
Test Designer Pierre's Notes: We've also followed the target used by Headphones.com in their reviews with great interest. Like us, they've been forerunners of measurements on the 5128 platform and have performed significant research. The way they present "preference bounds" calibrated to a diffuse field 5128 HRTF in the case of headphones and their JM-1 baseline for IEMs makes them incompatible with our graph tool. However, it certainly aligns with our approach that a balanced sound profile isn't just one single exact curve. Here's an overlay of our tool's curve selection and the Headphones.com preference target for headphones.
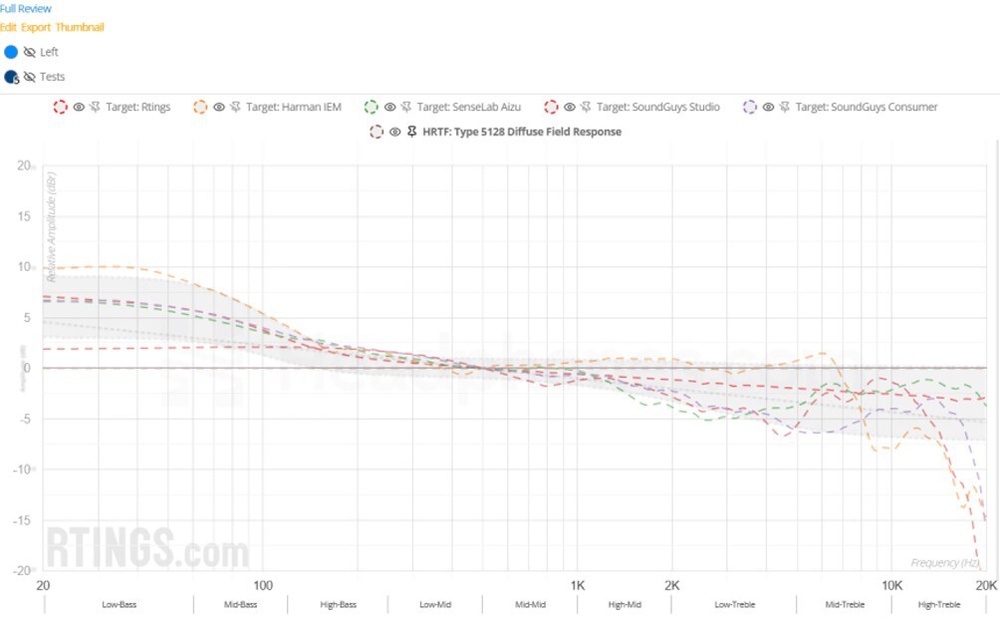
Test Designer Pierre's Notes: As you can see, there's some convergence between technical reviewers' view of a balanced sound profile. The last Harman listening test and AES study on target curves for the B&K5128 also had more than one statistically equal preference target. These curves aren't all the same; they're audibly different, you can prefer one over the other, and we give you that choice. However, at this stage in headphone research, there isn't one that can be deemed universally preferred.
New Tests
Sound Profile
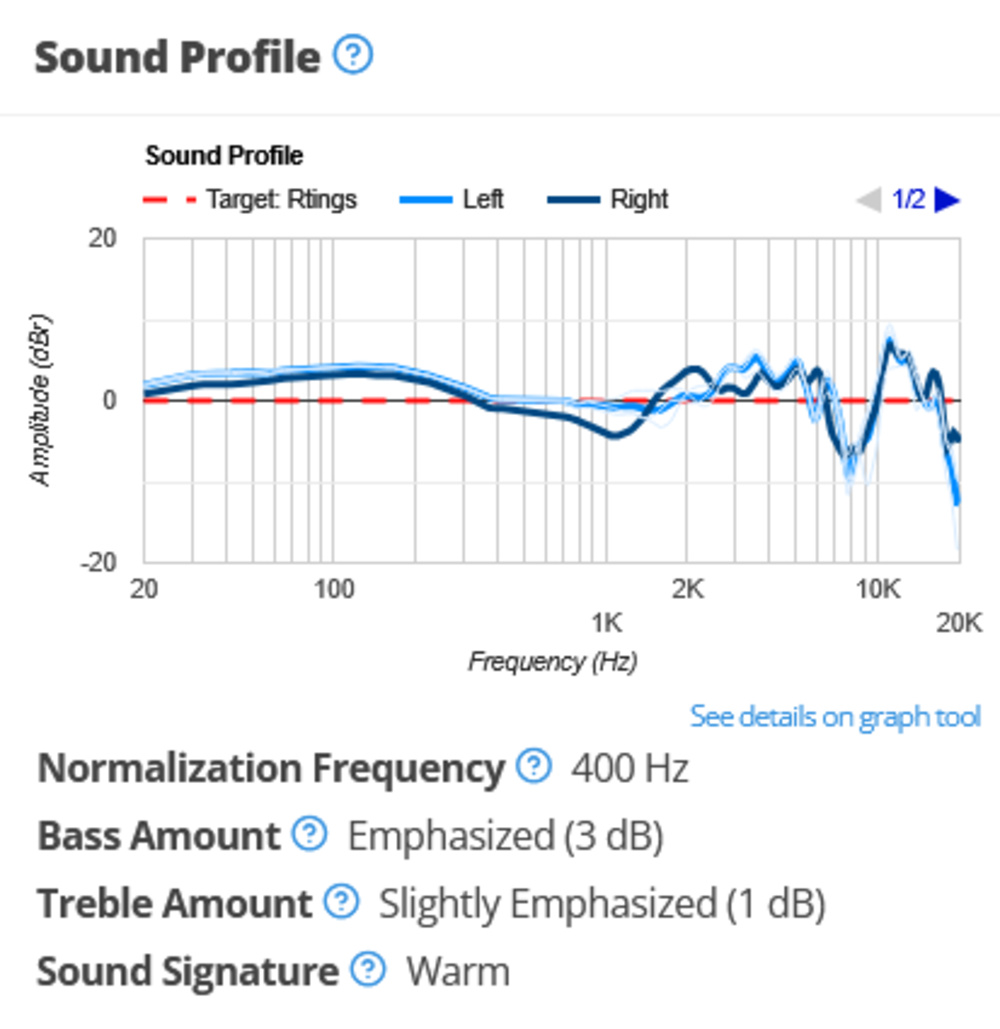 |  |
While the sound profile tests are mostly unchanged, we've added Sound Signatures to make it easier to sort headphones according to your preferences.
| Sound Signature | Characteristics |
| Boosted Bass | Bass-forward sound with a de-emphasized treble range |
| V-Shaped | Excited sound, with prominent bass and treble |
| Warm | Emphasized bass and low-mids with rolled-off highs for a smoother sound |
| Flat | Follows a diffuse field sound target in the bass and treble |
| Balanced | Follows our target curve in the bass and treble |
| Bright | Emphasized and sharp treble, with a more recessed bass response |
| Elevated Mid-Range | Under-emphasized treble and bass response, prominent mids |
Test Designer Pierre's Notes: Sound signature comparisons were designed to help you quickly assess whether a pair of headphones' sound profile will agree with your preferences. Those signatures are considered the general families of tonal balance. There's no good or bad here; rather, we're looking at the general bias of the sound profile. We're not trying to describe all the subtleties of the sonic palette. Think wide band, not band-specific colorations.
Some of you may wonder about the difference between 'Flat' and 'Balanced.' We consider a Balanced sound signature to be when headphones' frequency response generally follows researched preference headphone targets. Flat generally refers to a non-elevated and extended bass region and a balanced treble response.
Frequency Response Consistency
We've expanded the scope and accuracy of our Frequency Response Consistency test. We now use the B&K Type 5128 testing head for our baseline measurements. For IEMs, we collect the frequency response after three re-seats. For on-ears and over-ears, we perform five passes on the testing head, but the bass and mid regions are also measured with a canal-blocking in-ear microphone on humans with various physical features: long-haired individuals, glasses wearers, and small, medium, and large heads. We gray out our measurements above 2k due to the increased variance and difference in human hearing perception in this range.
 |  |
Enlarging the graph allows you to see an averaged response for each human subject, as well as the individual passes. This can provide valuable insight for users on a more personalized basis. For example, users with glasses can see how consistently their headphones can deliver audio between multiple re-seats, so you can better understand the deviations from the overall average of all measurements.
Test Designer Pierre's notes: We wanted to portray a key element in headphones' frequency response measurements with this updated test. We already know that the frequency response of headphones measured on different artificial heads will look slightly different. However, it goes further: the nice, lightly-smoothed frequency response curve that you use to evaluate headphones' tonal characteristics is, in fact, an average and, to some extent, an approximation.
For earbuds, the insertion depth will cause discrepancies, mainly in the treble, and the coupling of the IEM tip with the silicone artificial ear will also cause discrepancies. For over-ears and on-ears, the seal is the main source of deviations, but any small differences in placement will interact with the artificial pinnae differently.
What you hear is slightly different than what someone else might hear and is different from what is captured by the ear simulator of our test rig. We felt that the old approach of merging the average responses of the human passes in the bass and using only the HATS for the mid and treble regions wasn't giving you the full picture. For over-ears and on-ears, you get a total of 20 measurements and five averages for both stereo channels. That's a whopping 50 curves to look at. Unfortunately, we can't capture frequency response on human subjects for IEMs and earbuds since it requires in-ear microphones.
You will also note that we only publish the human-measured response below 2000Hz. It's not that the results above that range aren't valid for a canal-blocking microphone, but they can't be coherently compared on the same graph as our HATS measurements that don't have the blocked canal.
Looking at this variability reinforces our belief that finding a single exact "perfect" target curve is a fruitless endeavor to some extent, as the differences we get from the same headphones are in the same order of magnitude as the difference in those published and researched targets.
Stereo Mismatch
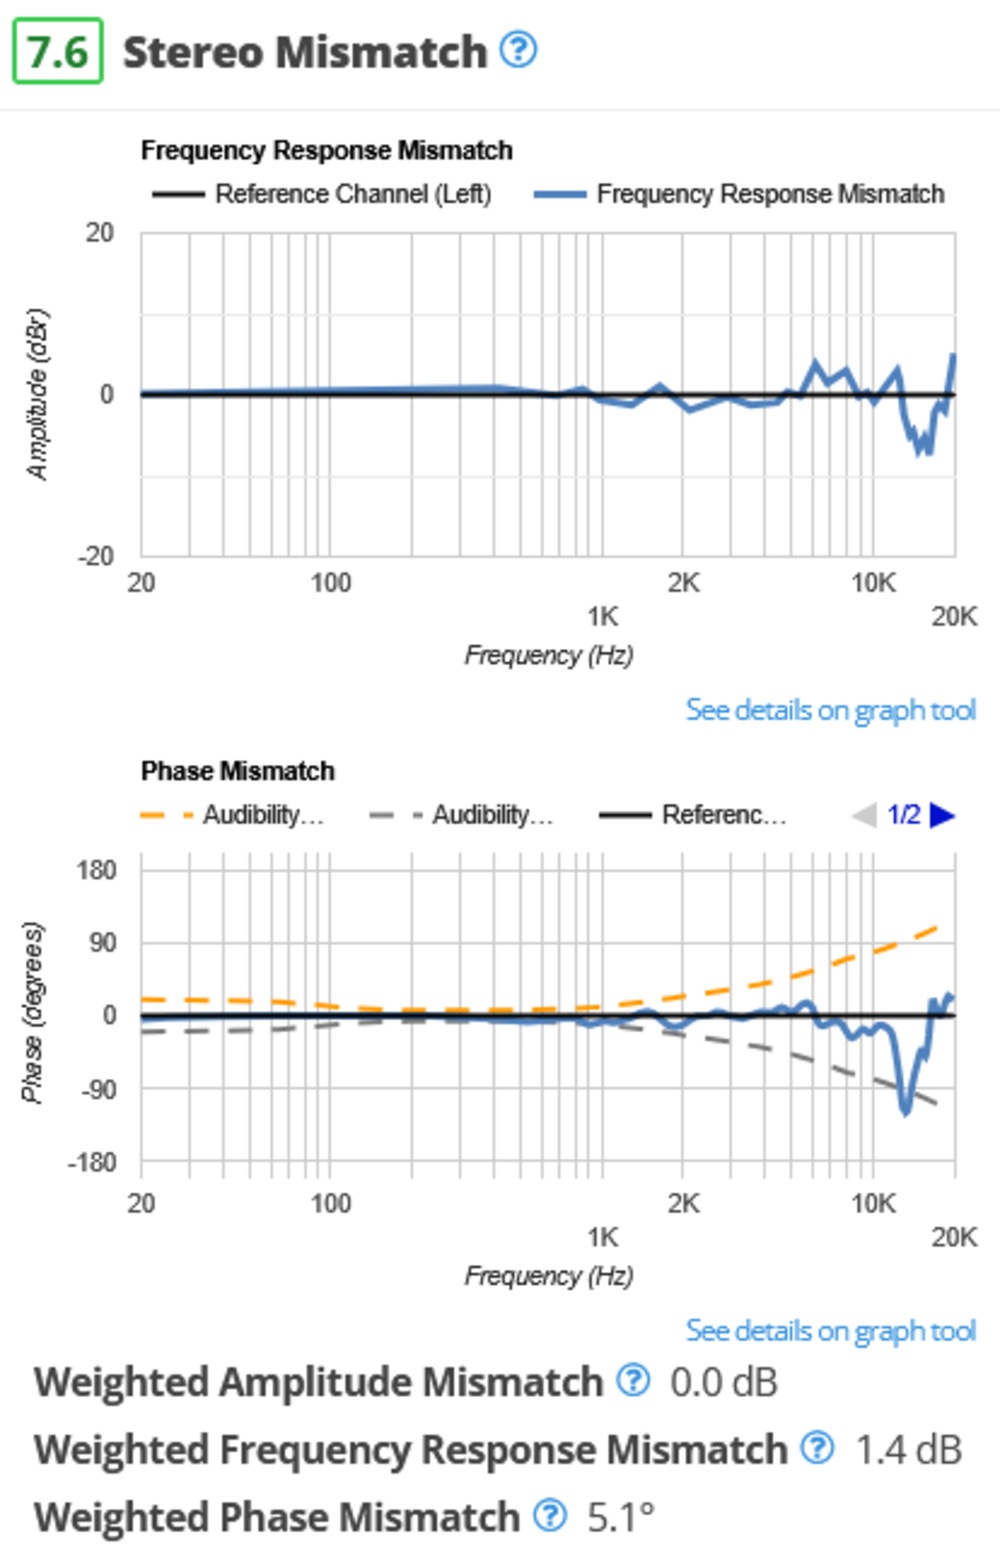
While this test isn't entirely new, it represents a new formulation of the tests previously displayed in the Imaging box. We wanted to group all mismatches between L/R drivers within one test box, and this now includes a separate graph for frequency mismatch. We also measure phase shift in both directions and represent this on the graph tool.
Group Delay
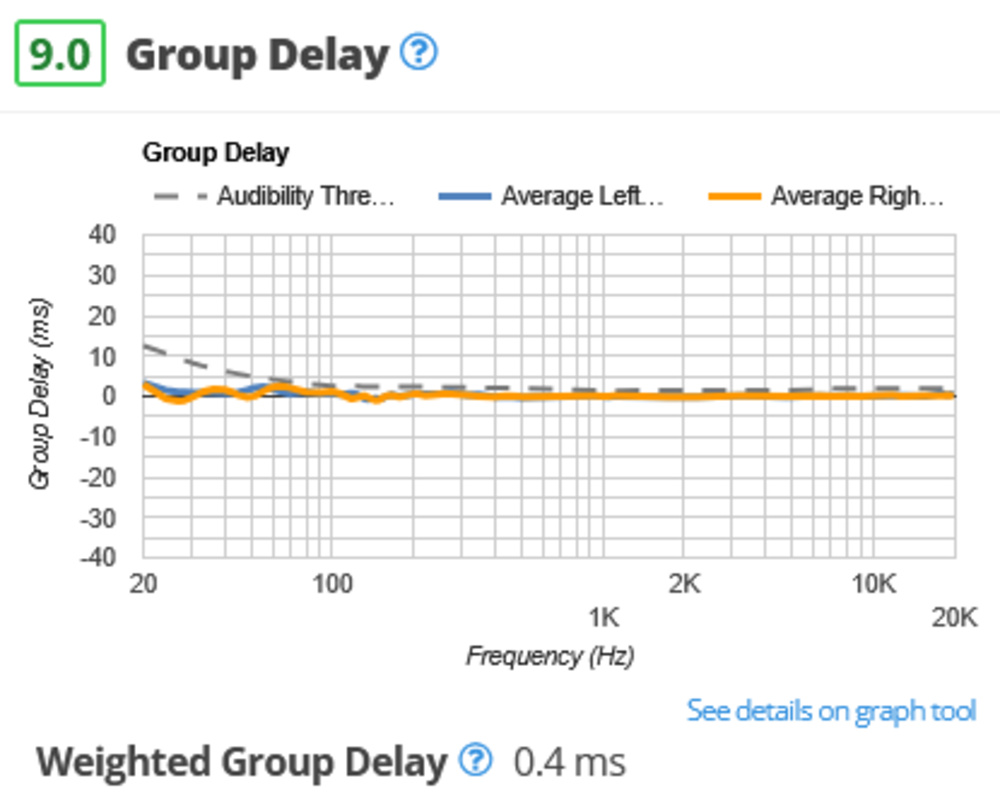
Group delay has now been given its own test box, too, with a measurement for the weighted group delay value given in milliseconds.
Cumulative Spectral Decay
We're introducing an unscored CSD graph that plots frequency response against both amplitude and time. We derive this waterfall plot from the impulse response function in Audio Precision, using a time window that allows us to test Bluetooth headphones, as well as traditional analog headphones, using the same methodology.
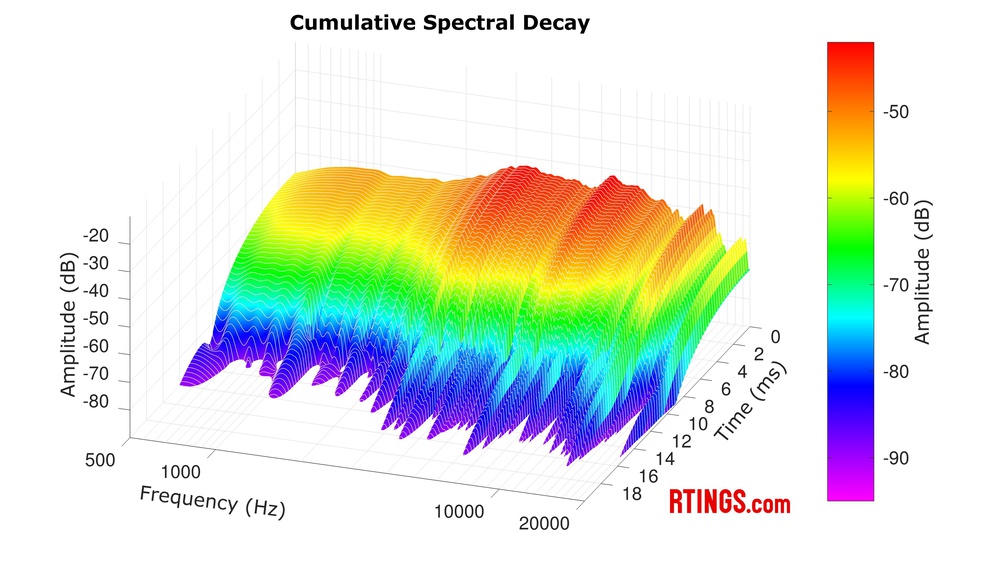
Test Designer Pierre's notes: Cumulative Spectral Decay for headphones is a polarizing subject, and its relevance can rightfully be questioned. Not only can the way it's derived vary wildly from one published source to the next, but it can also be argued that the sole addition of a time axis on the acoustic space that represents the coupling of headphones to a human head is peculiar to a certain degree. There's no real relationship between the time decay in milliseconds and the actual acoustical sustain time. It's purely a function of the observation window. In our case, 512 samples at 44.1 kHz.
Many of you requested this addition. We'll share our results for now, but we'd love your feedback! We're publishing them to get the pulse of our community on these three-dimensional representations of the impulse response for headphones. Are CSD graphs useful for you? Are they misleading? Do you believe that sustained resonances viewed on a CSD graph can be audible in everyday content? Read more about our CSD measurements in our R&D Article and let us know in the comments.
PRTF
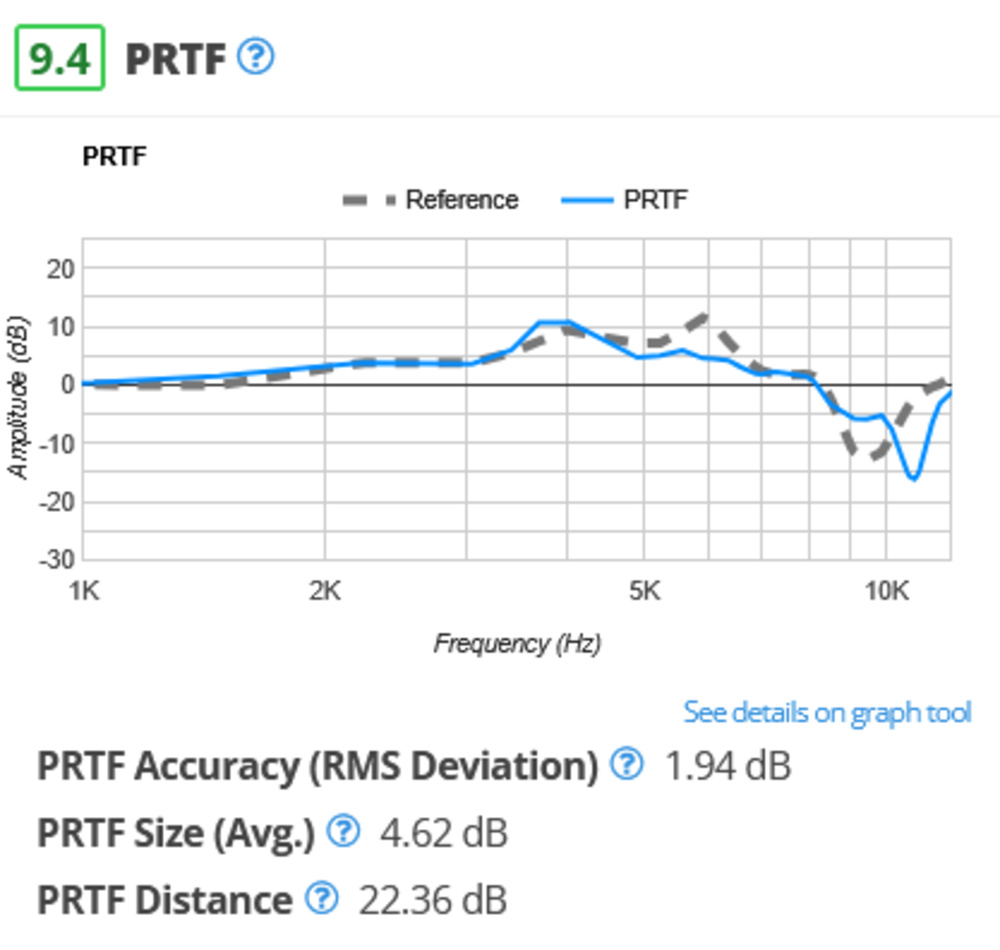
Like Stereo Mismatch, this test isn't entirely new but was re-formulated as we felt it didn't represent a complete assessment of what constitutes soundstage. While our method of comparing the pinna-related transfer function of headphones with that of an angled reference speaker allowed us to draw some correlations with headphones' spatial qualities, we're aware of its limitations and shortcomings in this regard. That said, we've decided to keep the test in the form of PRTF while removing Openness and Acoustic Space Excitation, as we still feel that it can offer partial insight into the spaciousness of the headphones' soundstage.
Harmonic Distortion
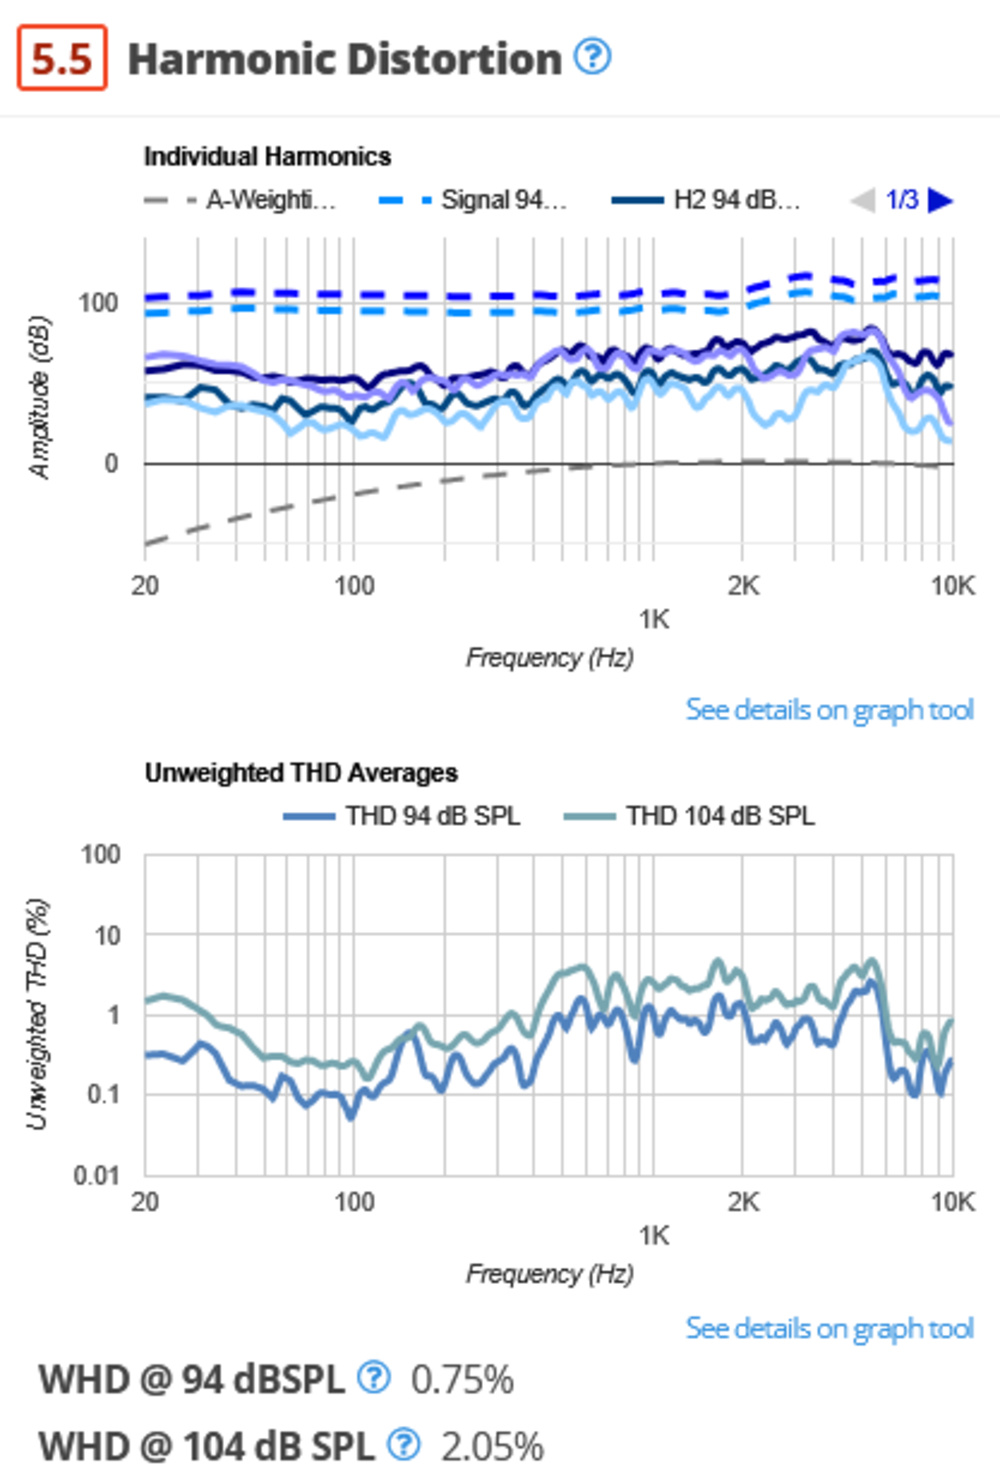
We've revised our testing methodologies and the way we showcase our data. Using the B&K 5128 connected to our Audio Precision AP517b Analyzer, we now take distortion measurements at both 94dBSPL and 104dBSPL to match current industry standards.
We display our data as an unweighted THD graph, as well as in the form of weighted values at both 94 and 104dBSPL. For our weighted values, higher harmonics are given more weight using the weighting coefficient -n²/4. These harmonics are then A-weighted against frequency to account for the relative loudness perceived by the human ear before an average is found.
Finally, for those who'd prefer to see an extra step between the unweighted THD and the weighted values, we also provide a graph illustrating the second and third harmonics at 94BSPL and 104dBSPL. We include the A-weighting curve to further demonstrate how headphones' distortion performance translates to the weighted averages.
Electrical Aspects
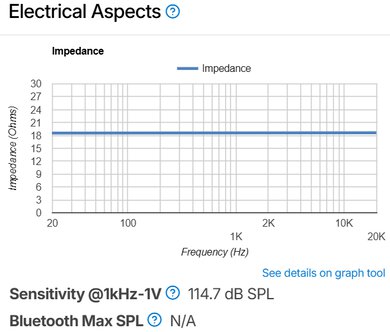
This test groups together passive impedance, sensitivity, and Bluetooth max SPL. There's also an impedance graph (for analog headphones). This information can help you assess your amplification needs.
 |  |  |
Breathability
We've removed Breathability results from our reviews. A degree of variation between the left and right ears of our breathability rig produced results that we felt weren't representative of the headphones' actual performance.
Verdicts and Usages
We've removed and/or updated all of our verdicts. You'll likely immediately notice that Neutral Sound has also been removed. While some aspects of it live on within the Audio Reproduction Accuracy performance usage, we decided we wanted to place greater emphasis on user preference, given the difficulty in defining neutral sound and the inability of multiple studies to arrive upon a single target curve that represents the preferences of the average listener. There have also been changes to the composition of the Travel, Sports And Fitness, Office Work, and Wired/Wireless Gaming (In Development) usages, with Noise Isolation and Microphone (In Development) added as performance usages alongside Audio Reproduction Accuracy and Frequency Response Consistency. The usages marked as 'In Development' are largely unchanged from 1.8 in their composition, as we're looking to reformulate them soon.
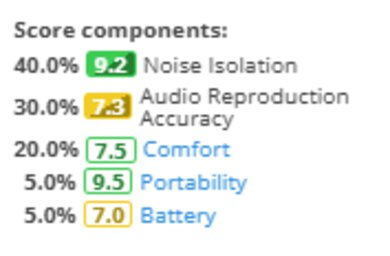
Audio Reproduction Accuracy: This usage replaces Neutral Sound and indicates fidelity in audio reproduction.
 |  |
Test Designer Pierre's Notes: Regarding the removal of the neutral sound score in favor of Audio Reproduction Accuracy, as mentioned above, we're now focusing more strongly on objective metrics in headphones' audio reproduction. You can have your own preferred bias on the tonality of headphones, and that's totally valid. However, there's no debating that headphones with significant resonances or valleys in the response, or with audible discrepancies between both sides of the stereo image, perform worse and will degrade the overall listening experience more than headphones with a smooth response and a perfect balance between left and right.
Peaks And Dips and Stereo Mismatch take the lion's share of our Audio Reproduction Accuracy score. Since the statistics and research are validated, we still chose to include our compliance to target evaluations. The body of research can demonstrate that a balanced sound signature is, of course, more likely to sound good to the average person. We still see that as a measure of performance. Distortion and Group delay are also included, but as these performance metrics are often difficult to hear, they're given a comparatively modest weight.
Noise Isolation: This usage gives immediate insight into a pair of headphones' ability to attenuate environmental noises from the listening experience. In our evaluation, we also factor in how well the headphones minimize leakage.
Microphone (In Development): This indicates how well the microphone reproduces your voice in any environment. We're currently in the process of improving our evaluation of integrated microphones, but we recognize that microphone performance is an important aspect of various headphones' usages.
Test Designer Pierre's Notes: Revamping microphone testing is at the very top of our pile of to-dos. Stay tuned! A revamped suite of tests for microphone evaluation is coming.
Frequency Response Consistency: We wanted to further highlight the importance of Frequency Response Consistency as much as possible and to demonstrate the impact it can have on our frequency response measurements. This usage gives an overview of how factors like your physical features or the headphones' design can affect the frequency response.
There have also been smaller changes to other usages. We've tweaked the weighting of some of the tests that make up our Sports And Fitness, Travel, Office Work, Wired Gaming, and Wireless Gaming usages, as well as some of the verbiage. As with the Microphone performance usage, we've flagged the two gaming usages as 'In Development'; we're still working on a formulation that encompasses everything users will want from a wired or wireless gaming headset. If you have feedback on how to shape these, comment below!
Changes To The Ribbon
We've reshaped the ribbon found at the top of the review so you can quickly identify important specifications and technical details that can assist you in making a buying decision. You can also filter according to these specifications with the table tool. We added the following information to the ribbon:
- Bass and Treble Amount
- Sound Signature

Let Us Know What You Think!
There's a lot of information to take in here. If there's something you want us to consider, investigate, or add to our test benches, let us know in the comments or ask us a question at our Discord AMA on May 1st.
41 Headphones Updated So Far
We are retesting popular models first. So far, the test results for the following models have been converted to the new testing methodology. However, the text might be inconsistent with the new results.
- AIAIAI TMA-2 DJ
- Anker Soundcore Liberty 4 NC Truly Wireless
- Anker Soundcore P40i
- Apple AirPods Max
- Apple AirPods Pro (2nd generation)
- Astro A50 X
- Audeze MM-100
- Audeze Maxwell Wireless
- Audio-Technica ATH-M50x
- Beats Studio Pro Wireless
- Beyerdynamic DT 770 PRO
- Beyerdynamic DT 990 PRO
- Beyerdynamic MMX 300 (2nd Generation)
- Bose QuietComfort 45/QC45 Wireless
- Bose QuietComfort Ultra Earbuds Truly Wireless
- Bose QuietComfort Ultra Headphones Wireless
- Bose Ultra Open Earbuds
- Focal Bathys Wireless
- HiFiMan Edition XS
- HiFiMan Sundara 2020
- HyperX Cloud III Wireless
- Logitech G PRO X 2 LIGHTSPEED Wireless
- Nothing Ear
- Samsung Galaxy Buds FE
- Samsung Galaxy Buds3 Pro
- Sennheiser HD 25
- Sennheiser HD 490 PRO
- Sennheiser HD 560S
- Sennheiser HD 600
- Sennheiser HD 800 S
- Sony PULSE Elite
- Sony ULT WEAR
- Sony WF-1000XM5 Truly Wireless
- Sony WH-1000XM5 Wireless
- Sony WH-XB910N Wireless
- SteelSeries Arctis Nova 7 Wireless [7, 7P, 7X]
- SteelSeries Arctis Nova Pro Wireless [PC, PS, Xbox]
- TRUTHEAR HEXA
- TRUTHEAR x Crinacle ZERO: RED
- Technics EAH-AZ100
- V-MODA Crossfade 3
74 Headphones Planned To Be Updated
We are also planning to retest the following products over the course of the next few weeks:
- AKG K361
- ASUS ROG Cetra True Wireless SpeedNova
- Anker Soundcore C30i
- Anker Soundcore Life Q30 Wireless
- Anker Soundcore P25i
- Anker Soundcore Space A40 Truly Wireless
- Anker Soundcore Space Q45 Wireless
- Apple AirPods (3rd generation)
- Apple AirPods 4
- Apple AirPods 4 with Active Noise Cancellation
- Astro A40 TR Headset + MixAmp Pro 2019
- Astro A50 Gen 4
- Audio-Technica ATH-ADX3000
- Bang & Olufsen Beoplay H95
- Beats Solo 4
- Beats Solo Buds
- Beyerdynamic DT 1990 PRO MKII
- Bose 700 Headphones Wireless
- Bose QuietComfort Earbuds II Truly Wireless
- Bose QuietComfort Headphones Wireless
- Bowers & Wilkins Px7 S2 Wireless
- Bowers & Wilkins Px8 Wireless
- CMF Buds Pro 2
- Corsair VIRTUOSO PRO
- Devialet Gemini II True Wireless
- Drop + Sennheiser/EPOS PC38X
- Dyson OnTrac
- Fairphone Fairbuds
- Google Pixel Buds Pro
- Google Pixel Buds Pro 2
- HiFiMan Arya Stealth Magnet Version
- JBL Live 670NC
- JBL Live 770NC
- JBL Tune 520BT
- JBL Tune 760NC
- JBL Tune 770NC
- JBL Tune Buds True Wireless
- JBL Vibe Beam True Wireless
- JBL Vibe Buds True Wireless
- Jabra Elite 10
- Jabra Elite 10 Gen 2
- Jabra Elite 8 Active
- Jabra Elite 8 Active Gen 2
- Logitech G535 LIGHTSPEED Wireless
- MOONDROP x Crinacle DUSK
- Nothing Ear (a)
- OnePlus Buds 3
- Razer BlackShark V2 HyperSpeed Wireless
- Samsung Galaxy Buds2 Pro
- Samsung Galaxy Buds3
- Sennheiser ACCENTUM Plus
- Sennheiser ACCENTUM Wireless
- Sennheiser HD 620S
- Sennheiser IE 200
- Sennheiser MOMENTUM 4 Wireless
- Sennheiser MOMENTUM True Wireless 4
- Shokz OpenFit Air
- Shokz OpenRun Pro 2 Bone Conduction
- Skullcandy Dime 3 True Wireless
- Sonos Ace
- Sony INZONE Buds Truly Wireless
- Sony LinkBuds S Truly Wireless
- Sony PULSE Explore Truly Wireless
- Sony WH-1000XM4 Wireless
- Sony WH-CH720N Wireless
- SteelSeries Arctis Nova 5
- SteelSeries Arctis Nova Pro
- SteelSeries Arctis Pro Wireless
- THIEAUDIO Monarch MKIII
- TRUTHEAR x Crinacle ZERO
- Technics EAH-AZ80
- Turtle Beach Atlas Air
- Turtle Beach Stealth 500
- Turtle Beach Stealth 600 (Gen 3)




Comments
Test Bench: Improvement to sound tests: Main Discussion
What do you think of our article? Let us know below.
Want to learn more? Check out our complete list of articles and tests on the R&D page.