See the previous 1.7 changelog.
What's Changed?
Since getting the Brüel & Kjær (B&K) 5128-B, we've begun updating our sound methodology. Starting with the fundamentals, we've updated our target curve for use with the B&K and made a couple of adjustments to frequency-response-related tests to better reflect the role of sound preference. All in all, these changes are somewhat small, but they set the basis for larger changes we plan to make to our sound methodology in a future update.
| Test Group | Description |
| Sound Profile |
|
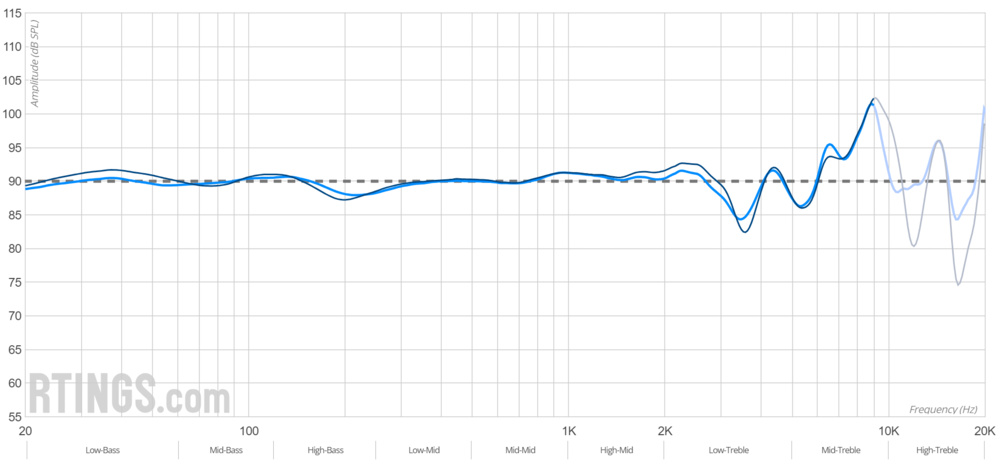
| Raw Frequency Response |
|
| Bass/Mid-Range/Treble Profile: Target Compliance (Previously called 'Bass/Mid/Treble Accuracy') |
|
| Peaks/Dips |
|
| Neutral Sound |
|
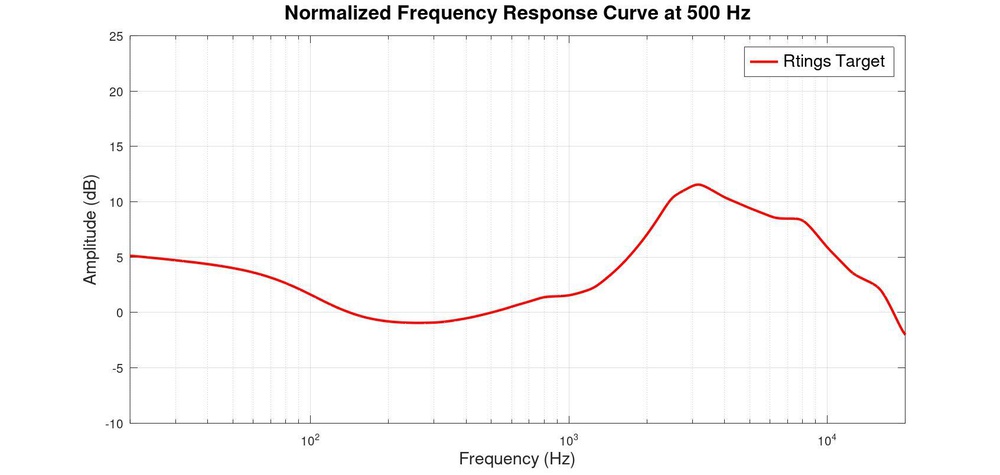
Our target curve
Our updated target curve is similar to our previous target and still resembles Harman's target, but we've made a few adjustments that correspond to our test rig (which is different than the one Harman used for their study):
- Added the diffuse field response of the B&K
- Tilted the response 6 dB
- Added 4.3 dB bass shelf (@105Hz, Q .707)
- Applied 1/6th octave smoothing
If you want to get into the weeds, we've got a whole R&D article outlining our process for defining a target curve. In this abridged article, however, we want to stress that this target approximates a sound that most people will find balanced in a pair of headphones, not the absolute measure of good sound quality. There's always an element of preference involved in interpreting frequency response.
In addition to the update to our target curve, there have been a couple of interrelated changes:
- We've merged our two targets (one for over/on-ears and another for IEMs) into one target for all headphones. While we originally had an IEM target with a 5dB bass boost, informed by studies published in Audio Engineering Society1,2, the differences in bass response between different ear simulators are still not well understood. As a result, there isn't strong enough evidence to suggest that an IEM target should be more v-shaped.
- No more human passes for over-ear headphones when it comes to raw frequency response measurements. This is because most people won't move their headphones in an extreme way that would create a significant drop in bass. As a result, there's no longer a human crossfade in the bass range in our raw frequency response and sound profile measurements. We reseat over-ears on our rig's head five times to capture small variations. For in-ears, we reseat the buds three times. However, we still do human passes when it comes to the Frequency Response Consistency test to showcase the effect of hair, glasses, or head shape on the results.
- Frequency response measurements are now made at 94 dB instead of 90 and 100 dB to align more with industry standards.
- All measurements are now taken on the Brüel & Kjær (B&K) 5128-B.
Sound Profile
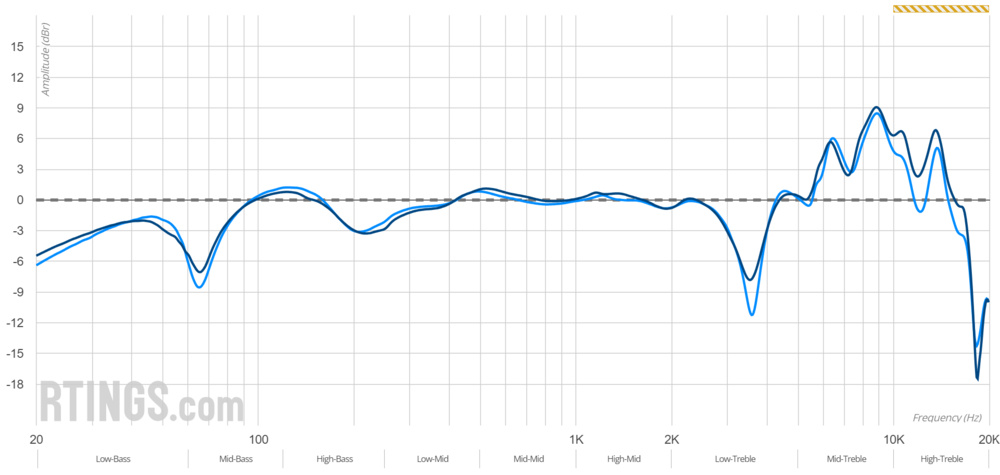
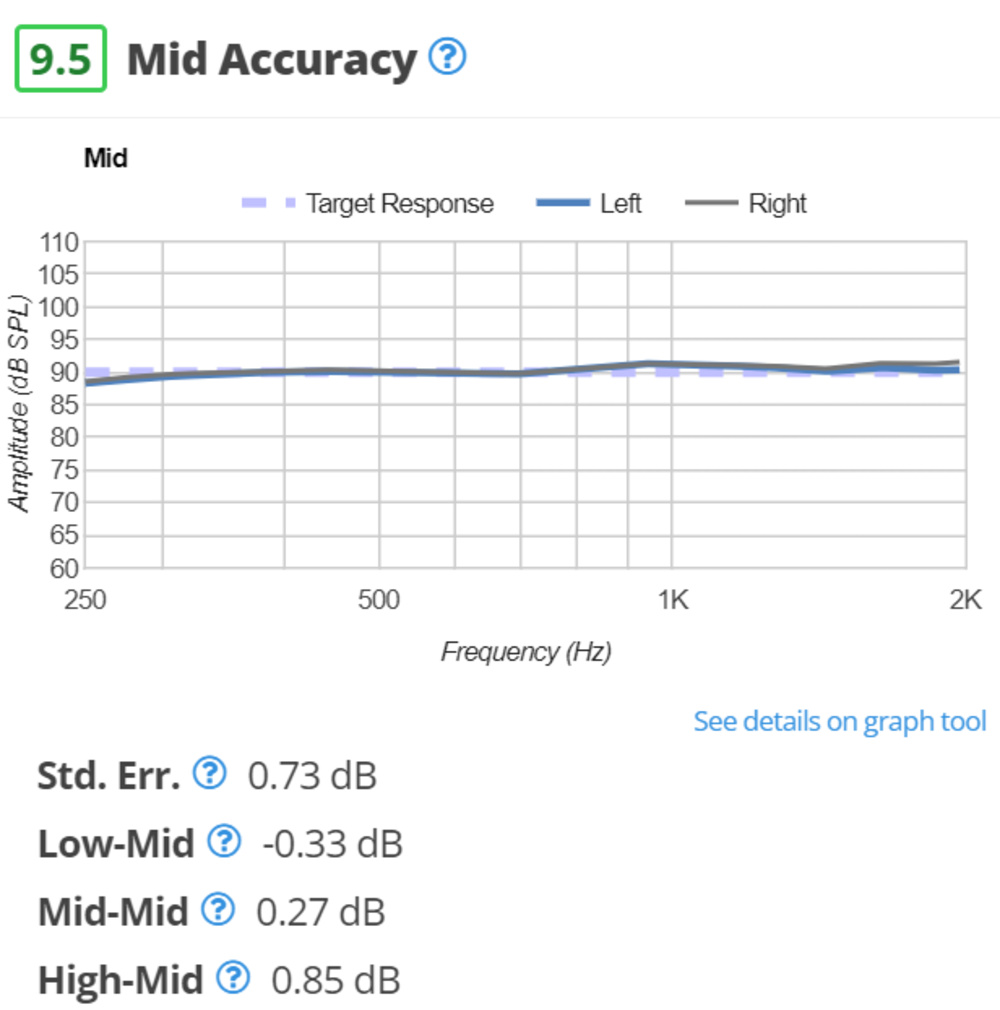
To give headphones the best chance to score well, we have a 'Normalization Frequency' value, which allows us to better level the frequency response to our target.
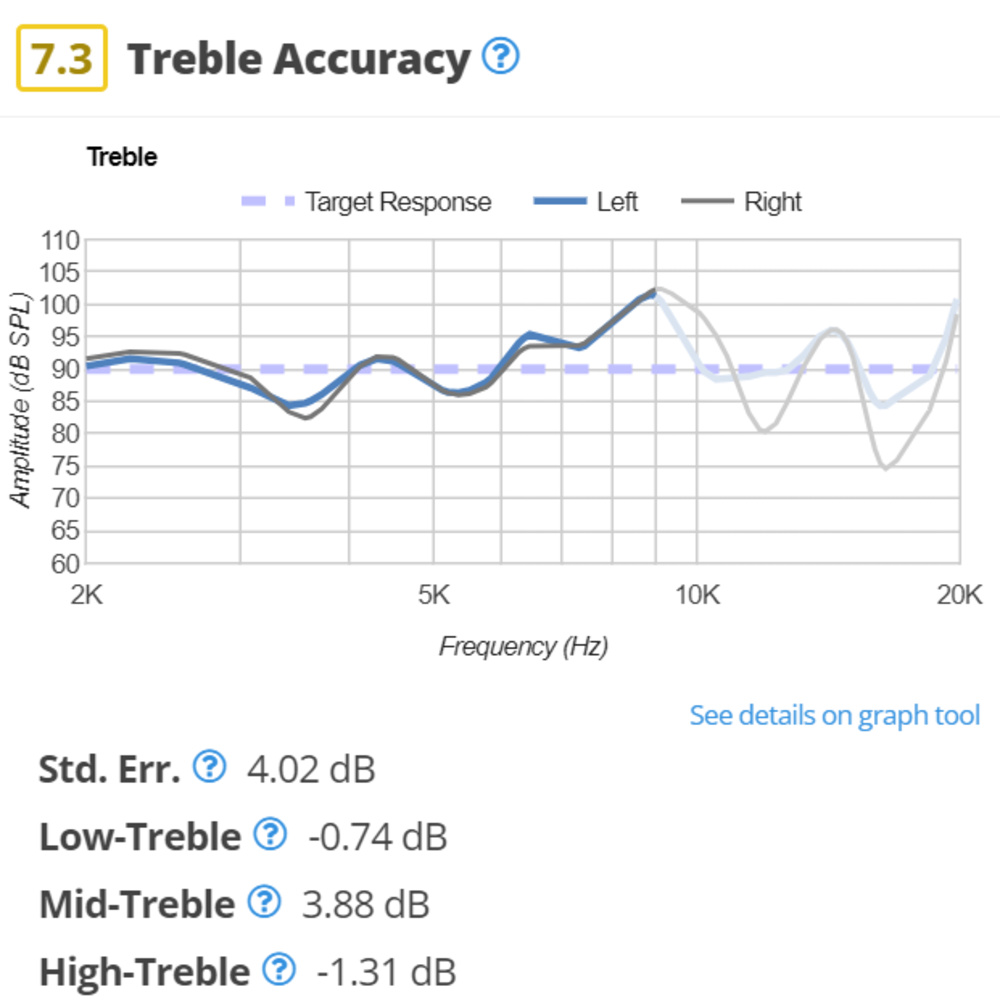
If you're using the graph tool, you'll also notice a yellow bar in the high-treble range. This bar highlights the range when you hover over the top of it and lets you know that the highlighted measurements are more precarious. This is because the human ear's morphology varies, which affects the treble response.
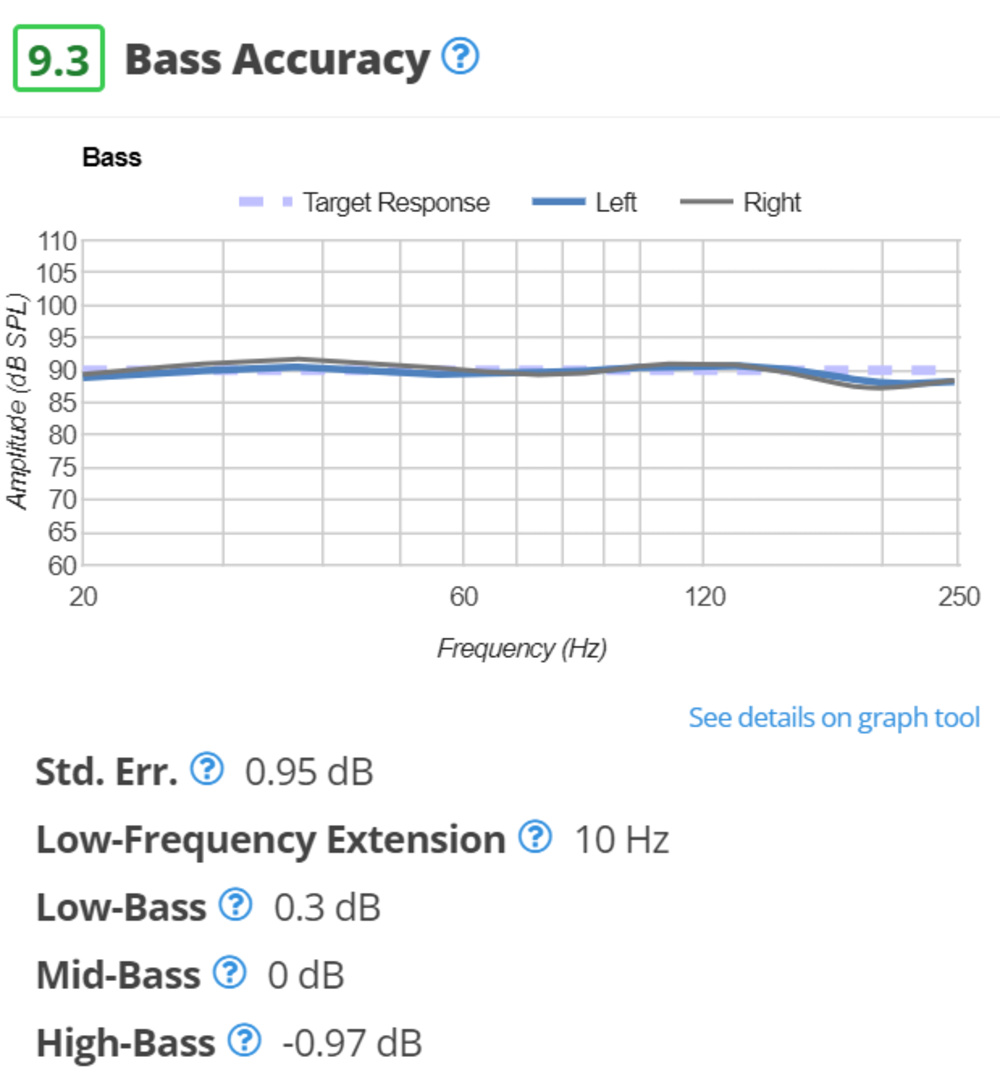
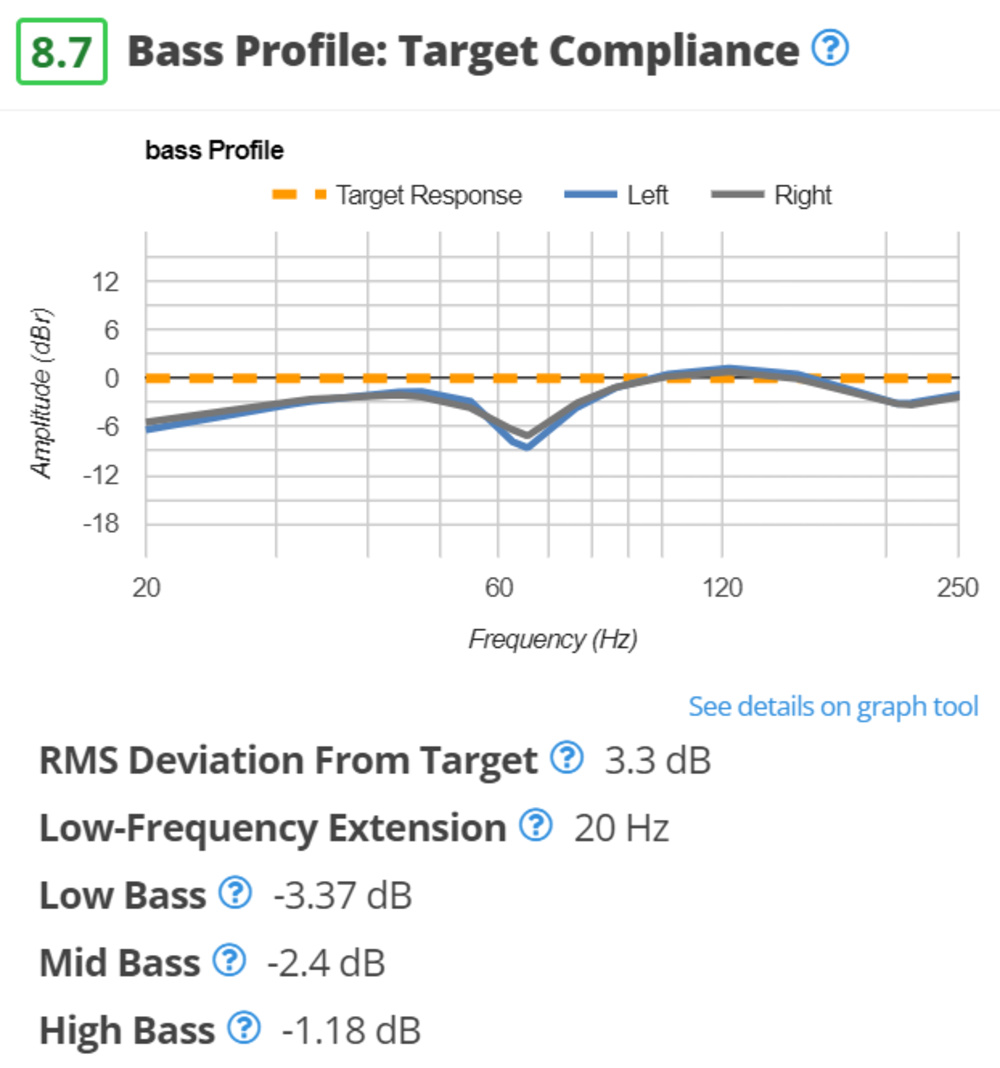
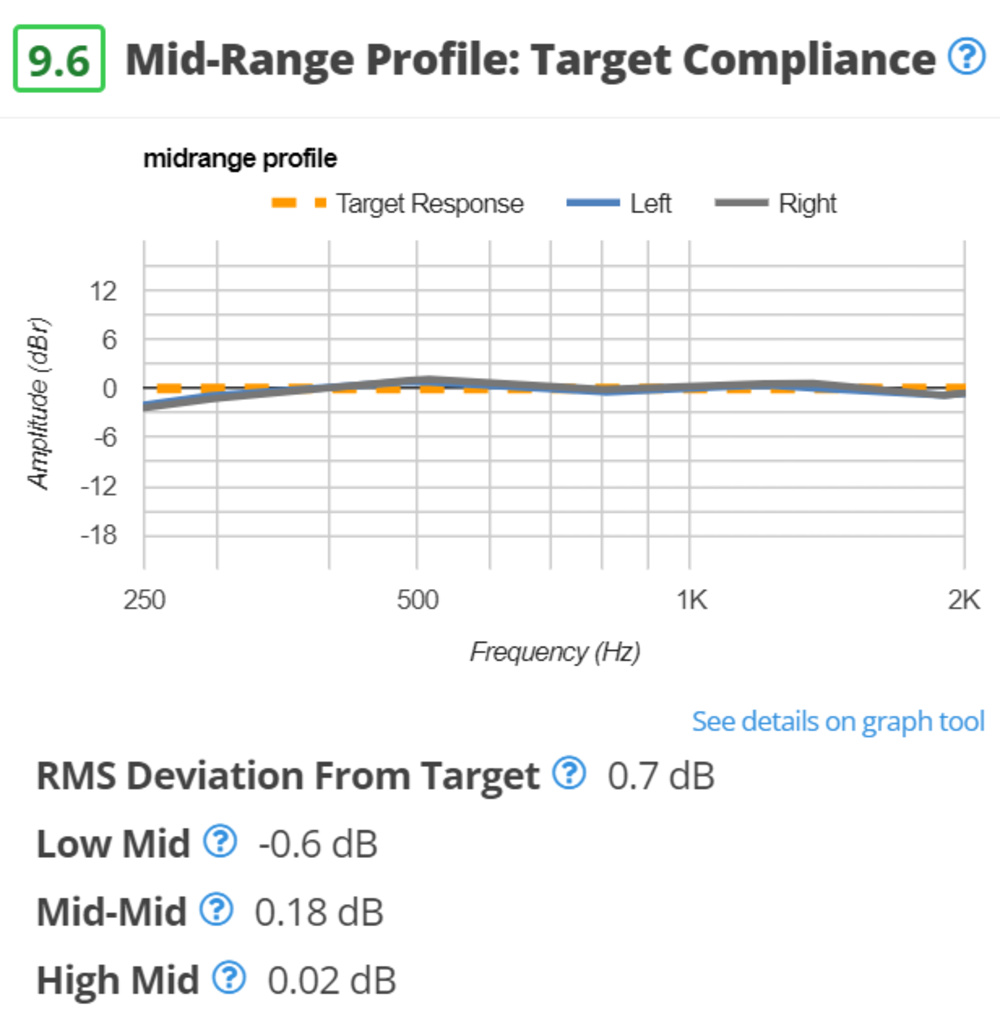
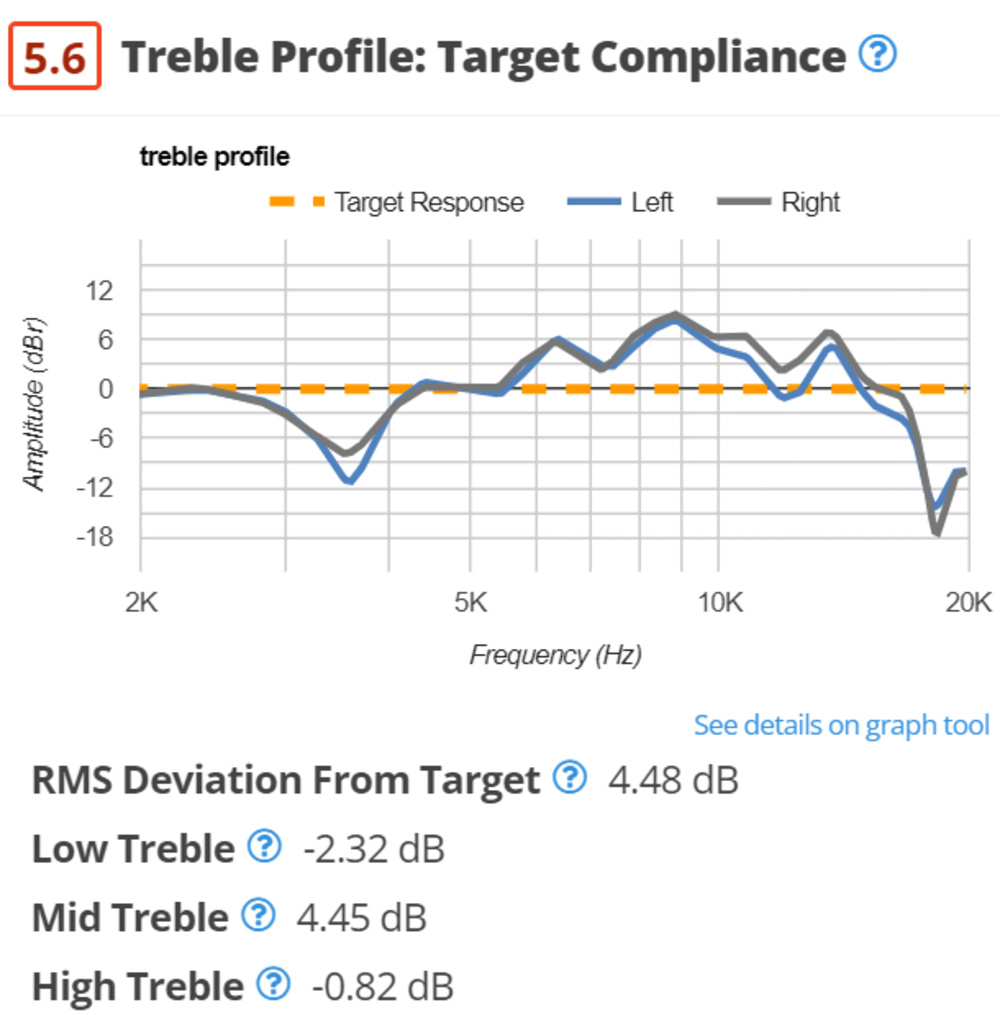
Bass/Mid-Range/Treble Profile: Target Compliance
Although they're three different tests, they represent an exploded view of the sound profile as it progresses through each range. We've updated the name of these tests so that it's clearer that we're measuring the response's deviation from our target rather than accuracy to a perceived 'neutrality.'
We've also renamed 'STD Error' to 'RMS Deviation from Target' for the same reason. The test is still the same, though. RMS is short for root mean square or quadratic mean. The scoring for 'RMS Deviation from Target' is more favorable to small deviations to reflect a range of values that are still near perfect.
Peaks/Dips
Since we've made changes to our sound methodology, we also need to update tests that use a pair of headphones' frequency response as a baseline. In Peaks/Dips, the resulting one octave smoothed frequency response becomes the new baseline. As a result, there's more leniency for frequency response variations that are considered by design. At the same time, it allows us to be more discriminant about what is considered a peak or dip.
Neutral Sound
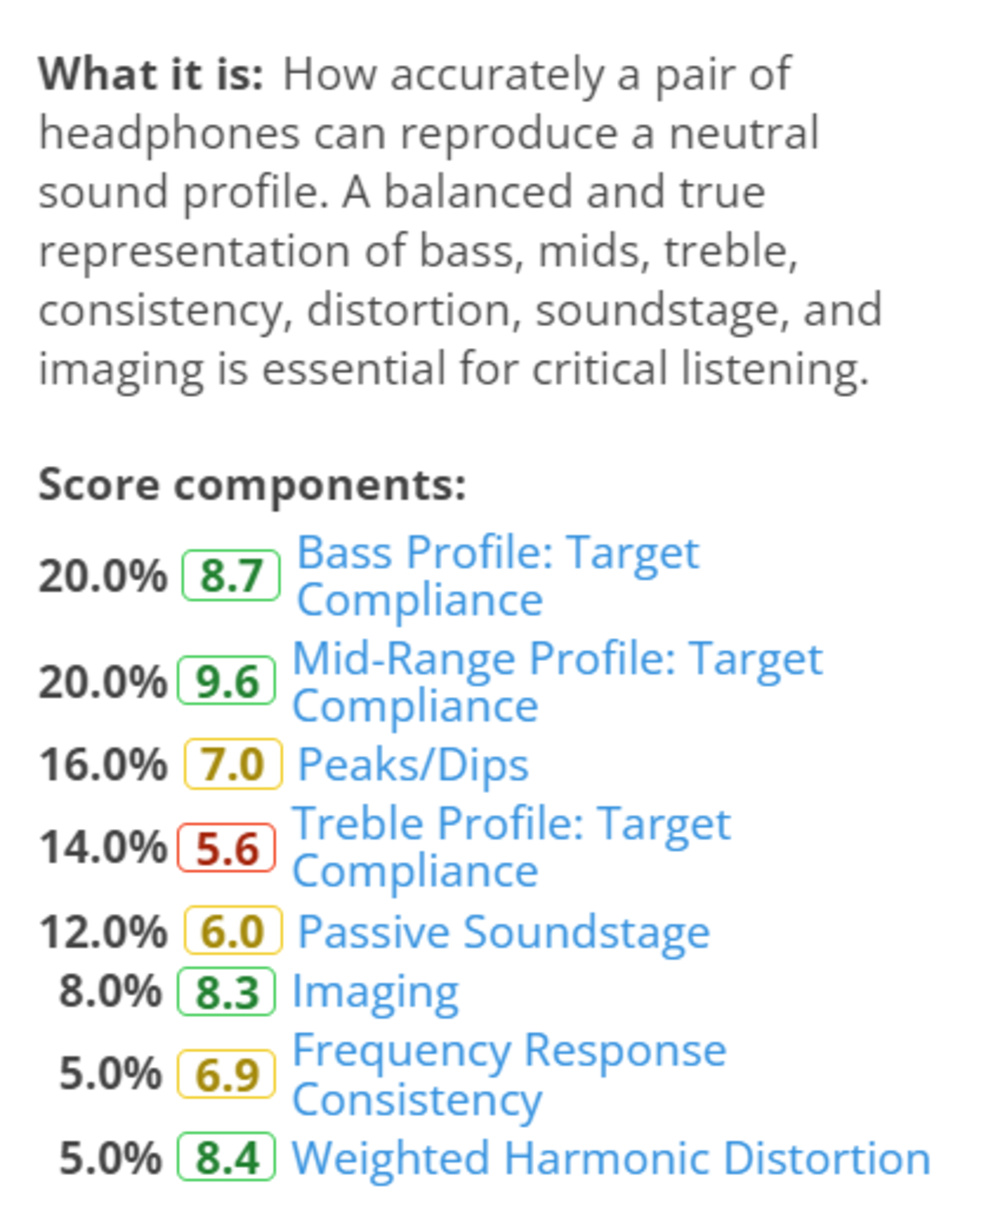
We've added Peaks/Dips to the score components of this usage. Peaks/Dips is a performance-based test; regardless of your sound preference, a bad performance in this test will negatively affect sound quality across all users.
Let Us Know What You Think!
We're just getting started with our updates to sound. If there's something you want us to consider, investigate, or add to our test benches, let us know!
Recent Changes
01/10/2024: We've added some text clarifying the removal of the human crossfade in the bass range and confirming that all our measurements are now taken with the B&K 5128B
10/24/2024: We've added a section regarding smoothing the Peaks/Dips baseline.
115 Headphones Updated
We have retested popular models. The test results for the following models have been converted to the new testing methodology. However, the text might be inconsistent with the new results.
- 7HZ Timeless
- AIAIAI TMA-2 DJ
- AKG K371
- AKG K702
- Anker Soundcore Liberty 4 NC Truly Wireless
- Anker Soundcore Life Q30 Wireless
- Anker Soundcore P25i
- Anker Soundcore P40i
- Anker Soundcore Space A40 Truly Wireless
- Anker Soundcore Space Q45 Wireless
- Apple AirPods (3rd generation)
- Apple AirPods Max
- Apple AirPods Pro (2nd generation)
- Astro A40 TR Headset + MixAmp Pro 2019
- Astro A50 Gen 4
- Astro A50 X
- ASUS ROG Cetra True Wireless SpeedNova
- Audeze Maxwell Wireless
- Audeze MM-100
- Audio-Technica ATH-M50x
- Bang & Olufsen Beoplay H95
- Beats Solo 4
- Beats Solo Buds
- Beats Studio Pro Wireless
- Beyerdynamic DT 770 PRO
- Beyerdynamic DT 990 PRO
- Beyerdynamic MMX 300 (2nd Generation)
- Bose 700 Headphones Wireless
- Bose QuietComfort 45/QC45 Wireless
- Bose QuietComfort Earbuds II Truly Wireless
- Bose QuietComfort Headphones Wireless
- Bose QuietComfort Ultra Earbuds Truly Wireless
- Bose QuietComfort Ultra Headphones Wireless
- Bose Ultra Open Earbuds
- Bowers & Wilkins Px7 S2 Wireless
- Bowers & Wilkins Px8 Wireless
- Corsair VIRTUOSO PRO
- Devialet Gemini II True Wireless
- Drop + Sennheiser/EPOS PC38X
- Fairphone Fairbuds
- Focal Bathys Wireless
- Google Pixel Buds Pro
- HiFiMan Arya
- HiFiMan Arya Stealth Magnet Version
- HiFiMan Edition XS
- HiFiMan HE400se
- HiFiMan Sundara 2020
- HyperX Cloud III Wireless
- Jabra Elite 10
- Jabra Elite 10 Gen 2
- Jabra Elite 8 Active
- Jabra Elite 8 Active Gen 2
- JBL Live 670NC
- JBL Live 770NC
- JBL Tune 520BT
- JBL Tune 760NC
- JBL Tune 770NC
- JBL Tune Buds True Wireless
- JBL Vibe Beam True Wireless
- JBL Vibe Buds True Wireless
- Logitech G PRO X 2 LIGHTSPEED Wireless
- Logitech G535 LIGHTSPEED Wireless
- MOONDROP Blessing 3
- Nothing Ear
- Nothing Ear (a)
- OnePlus Buds 3
- Philips Fidelio X2HR
- Philips SHP9500
- Philips SHP9600
- Razer BlackShark V2 HyperSpeed Wireless
- Samsung Galaxy Buds FE
- Samsung Galaxy Buds2 Pro
- Samsung Galaxy Buds3
- Sennheiser ACCENTUM Plus
- Sennheiser ACCENTUM Wireless
- Sennheiser HD 25
- Sennheiser HD 490 PRO
- Sennheiser HD 560S
- Sennheiser HD 600
- Sennheiser HD 620S
- Sennheiser HD 660S2
- Sennheiser HD 6XX
- Sennheiser HD 800 S
- Sennheiser IE 200
- Sennheiser MOMENTUM 4 Wireless
- Sennheiser MOMENTUM Sport
- Sennheiser MOMENTUM True Wireless 4
- Skullcandy Dime 3 True Wireless
- Sonos Ace
- Sony INZONE Buds Truly Wireless
- Sony LinkBuds S Truly Wireless
- Sony MDR-7506
- Sony PULSE Elite
- Sony PULSE Explore Truly Wireless
- Sony ULT WEAR
- Sony WF-1000XM5 Truly Wireless
- Sony WH-1000XM4 Wireless
- Sony WH-1000XM5 Wireless
- Sony WH-CH720N Wireless
- Sony WH-XB910N Wireless
- SteelSeries Arctis Nova 5
- SteelSeries Arctis Nova 7 Wireless [7, 7P, 7X]
- SteelSeries Arctis Nova Pro
- SteelSeries Arctis Nova Pro Wireless [PC, PS, Xbox]
- SteelSeries Arctis Pro Wireless
- Superlux HD 681
- Technics EAH-AZ80
- THIEAUDIO Monarch MKIII
- TRUTHEAR HEXA
- TRUTHEAR x Crinacle ZERO
- TRUTHEAR x Crinacle ZERO: RED
- Turtle Beach Atlas Air
- Turtle Beach Stealth 500
- Turtle Beach Stealth 600 (Gen 3)
- V-MODA Crossfade 3
Comments
Test Bench: Frequency Response: Main Discussion
What do you think of our article? Let us know below.
Want to learn more? Check out our complete list of articles and tests on the R&D page.
Hi kyliexd,
Thank you for your feedback. When it comes to the TB update, we have to evaluate the time it takes to perform the retest and its impact on new reviews. In this case, the Philips Fidelio X2HR are two test benches behind at TB 1.5, so it is unlikely we will bring them to the latest TB 1.8. That said, we will discuss this with the team and re-evaluate the possibility of bringing them to our latest TB.
Cheers, Dagobiet.
Unfortunately we don’t currently have a way of doing this due to the difference in target curves. However, you can still use the compare tool to compare the raw frequency response of two headphones, as well as the bass and treble amount seen below this graph. We find this can still give an accurate point of comparison between two headphones!
Yes, we’ll be updating peaks/dips writing and scores as needed for headphones retested on TB 1.8.
The same can be said for other headphones such as the AKG K371
While I understand, i do think the philips x2 should be added, since it scores so well
Will you be updating the peak/dip chapter notes?
Ok thanks, is there a way to compare 2 headphones and select the older measurements so that I can do an apples to apples comparison? It is difficult to compare if the 2 targets are different.
Unfortunately not, no. We don’t anticipate updating more than those 86 reviews to our newest methodology. Sorry about that!