Notice: Your browser is not supported or outdated so some features of the site might not be available.
- Table of Contents
- Top
- Main Differences
- Brightness
- Black Level
- Color
- Processing
- Game Mode Responsiveness
- Motion Handling
- Reflections
- Panel
- Inputs
- Design
- Market Context
- Smart Features
- Sound Quality
- Picture Quality
- Motion
- Comments
Sony X90L/X90CL vs Samsung Q7FN/Q7/Q7F QLED 2018
Side-by-Side Comparison
Products
Sony X90L/X90CL
Samsung Q7FN/Q7/Q7F QLED 2018
Tested using Methodology v2.0.1
Updated May 07, 2025 04:48 PM
SEE PRICE
BestBuy.comTested using Methodology v1.5
Updated Feb 22, 2024 02:29 PM
SEE PRICE
Amazon.com

Resolution4k
Native Refresh Rate120Hz
TypeLED
Sub-TypeVA
Dolby VisionYes
Screen FinishGlossy
Resolution4k
Native Refresh Rate120 Hz
TypeLED
Sub-TypeVA
Dolby VisionNo
Screen FinishGlossy
Variants
- XR-55X90L (55")
- XR-65X90L (65")
- XR-75X90L (75")
- XR-85X90L (85")
- XR-98X90L (98")
- QN55Q7FN (55")
- QN65Q7FN (65")
- QN75Q7FN (75")
Our Verdict
Sony X90L/X90CL
Samsung Q7FN/Q7/Q7F QLED 2018
Full comparison details regarding individual product score sets can be found in the section below
Check Price
55"
XR-55X90L
SEE PRICE
BestBuy.com55"
QN55Q7FN
SEE PRICE
Amazon.com65"
XR-65X90L
SEE PRICE
BestBuy.com65"
QN65Q7FN
SEE PRICE
Amazon.com75"
XR-75X90L
SEE PRICE
BestBuy.com75"
QN75Q7FN
SEE PRICE
Amazon.com85"
XR-85X90L
SEE PRICE
BestBuy.com85"
98"
XR-98X90L
SEE PRICE
BestBuy.com98"
Main Differences forMixed Usage
Mixed Usage
Threshold
Mixed Usage
7.6
7.9
Direct Reflections
5.4
9.2
Contrast
6.8
9.0
HDR Brightness
7.5
8.1
Black Uniformity
6.2
8.9
Gray Uniformity
6.3
7.7
Full Comparison
Brightness
HDR Brightness
7.5
8.1
HDR Hallway Photo

HDR Cityscape Photo

HDR Landscape Photo

Hallway Lights (~1950 cd/m²)
581 cd/m²
Yellow Skyscraper (~700 cd/m²)
474 cd/m²
Landscape Pool (~300 cd/m²)
216 cd/m²
Peak 2% Window
1,141 cd/m²
941 cd/m²
Peak 10% Window
1,254 cd/m²
2,270 cd/m²
Peak 25% Window
952 cd/m²
834 cd/m²
Peak 50% Window
765 cd/m²
799 cd/m²
Peak 100% Window
715 cd/m²
778 cd/m²
Sustained 2% Window
1,106 cd/m²
931 cd/m²
Sustained 10% Window
1,212 cd/m²
744 cd/m²
Sustained 25% Window
948 cd/m²
827 cd/m²
Sustained 50% Window
763 cd/m²
795 cd/m²
Sustained 100% Window
714 cd/m²
773 cd/m²
Automatic Brightness Limiting (ABL)
0.030
0.011
HDR Brightness In Game Mode
7.5
HDR Hallway Photo

HDR Cityscape Photo

HDR Landscape Photo

Hallway Lights (~1950 cd/m²)
564 cd/m²
Yellow Skyscraper (~700 cd/m²)
504 cd/m²
Landscape Pool (~300 cd/m²)
212 cd/m²
Peak 2% Window
1,123 cd/m²
Peak 10% Window
1,262 cd/m²
Peak 25% Window
944 cd/m²
Peak 50% Window
757 cd/m²
Peak 100% Window
712 cd/m²
Sustained 2% Window
1,091 cd/m²
Sustained 10% Window
1,220 cd/m²
Sustained 25% Window
941 cd/m²
Sustained 50% Window
756 cd/m²
Sustained 100% Window
711 cd/m²
Automatic Brightness Limiting (ABL)
0.030
SDR Brightness
8.9
8.9
Real Scene Peak Brightness
775 cd/m²
682 cd/m²
Peak 2% Window
1,129 cd/m²
1,117 cd/m²
Peak 10% Window
1,261 cd/m²
2,240 cd/m²
Peak 25% Window
905 cd/m²
802 cd/m²
Peak 50% Window
728 cd/m²
747 cd/m²
Peak 100% Window
720 cd/m²
768 cd/m²
Sustained 2% Window
1,111 cd/m²
1,104 cd/m²
Sustained 10% Window
1,219 cd/m²
744 cd/m²
Sustained 25% Window
901 cd/m²
799 cd/m²
Sustained 50% Window
726 cd/m²
746 cd/m²
Sustained 100% Window
718 cd/m²
767 cd/m²
Automatic Brightness Limiting (ABL)
0.032
0.021
Black Level
Contrast
6.8
9.0
Contrast Picture


Contrast
49,776 : 1
5,611 : 1
Native Contrast
4,163 : 1
5,607 : 1
Lighting Zone Precision
7.5
Lighting Zone Precision Picture

Lighting Zone Transitions
6.0
Preferred LD Video, Moving Object
Local Dimming
Yes
Yes
Backlight
Full-Array
Edge
Dimming Zone Count Of The Tested TV
88
Contrast And Dark Details In Game Mode
7.0
Lighting Zone Precision Photo In Game Mode

Preferred LD Video, Moving Object In Game Mode
Game Transitions With VRR And Preferred LD
Black Uniformity
6.2
8.9
Black Uniformity Picture With Preferred Local Dimming


Std. Dev.
1.391%
0.955%
Native Black Uniformity Picture


Native Std. Dev.
0.946%
0.567%
Color
SDR Color Volume
7.7
DCI-P3 Gamut Rings

CIELAB DCI-P3 Coverage
89.46%
BT.2020 Gamut Rings

CIELAB BT.2020 Coverage
69.38%
HDR Color Volume
8.3
8.6
P3 Color Volume ITP Picture


1,000 cd/m² DCI P3 Coverage ITP
86.2%
55.0%
2020 Color Volume ITP Picture


10,000 cd/m² BT.2020 Coverage ITP
42.8%
44.8%
White Luminance
1,154 cd/m²
Red Luminance
272 cd/m²
Green Luminance
778 cd/m²
Blue Luminance
91 cd/m²
Cyan Luminance
869 cd/m²
Magenta Luminance
364 cd/m²
Yellow Luminance
1,046 cd/m²
SDR Pre-Calibration Color Accuracy
8.5
7.7
Pre White Balance Picture


Pre Gamma Curve Picture


Pre Color Picture


White Balance dE 2000
3.14
2.80
Color dE 2000
1.52
2.80
Gamma
2.60
2.24
Color Temperature
6,506 K
6,106 K
Picture Mode
Custom
Movie
Color Temp Setting
Expert 1
Warm 2
Gamma Setting
0
BT.1886 +2, Brightness +2
SDR Post-Calibration Color Accuracy
9.6
9.3
Post White Balance Picture


Post Gamma Curve Picture


Post Color Picture


White Balance dE 2000
0.17
0.27
Color dE 2000
0.98
1.66
Gamma
2.20
2.20
Color Temperature
6,503 K
6,573 K
White Balance Calibration
10 point
20 point
Color Calibration
Yes
Yes
HDR Pre-Calibration Color Accuracy
9.3
HDR Pre White Balance Picture

HDR Pre Color Picture
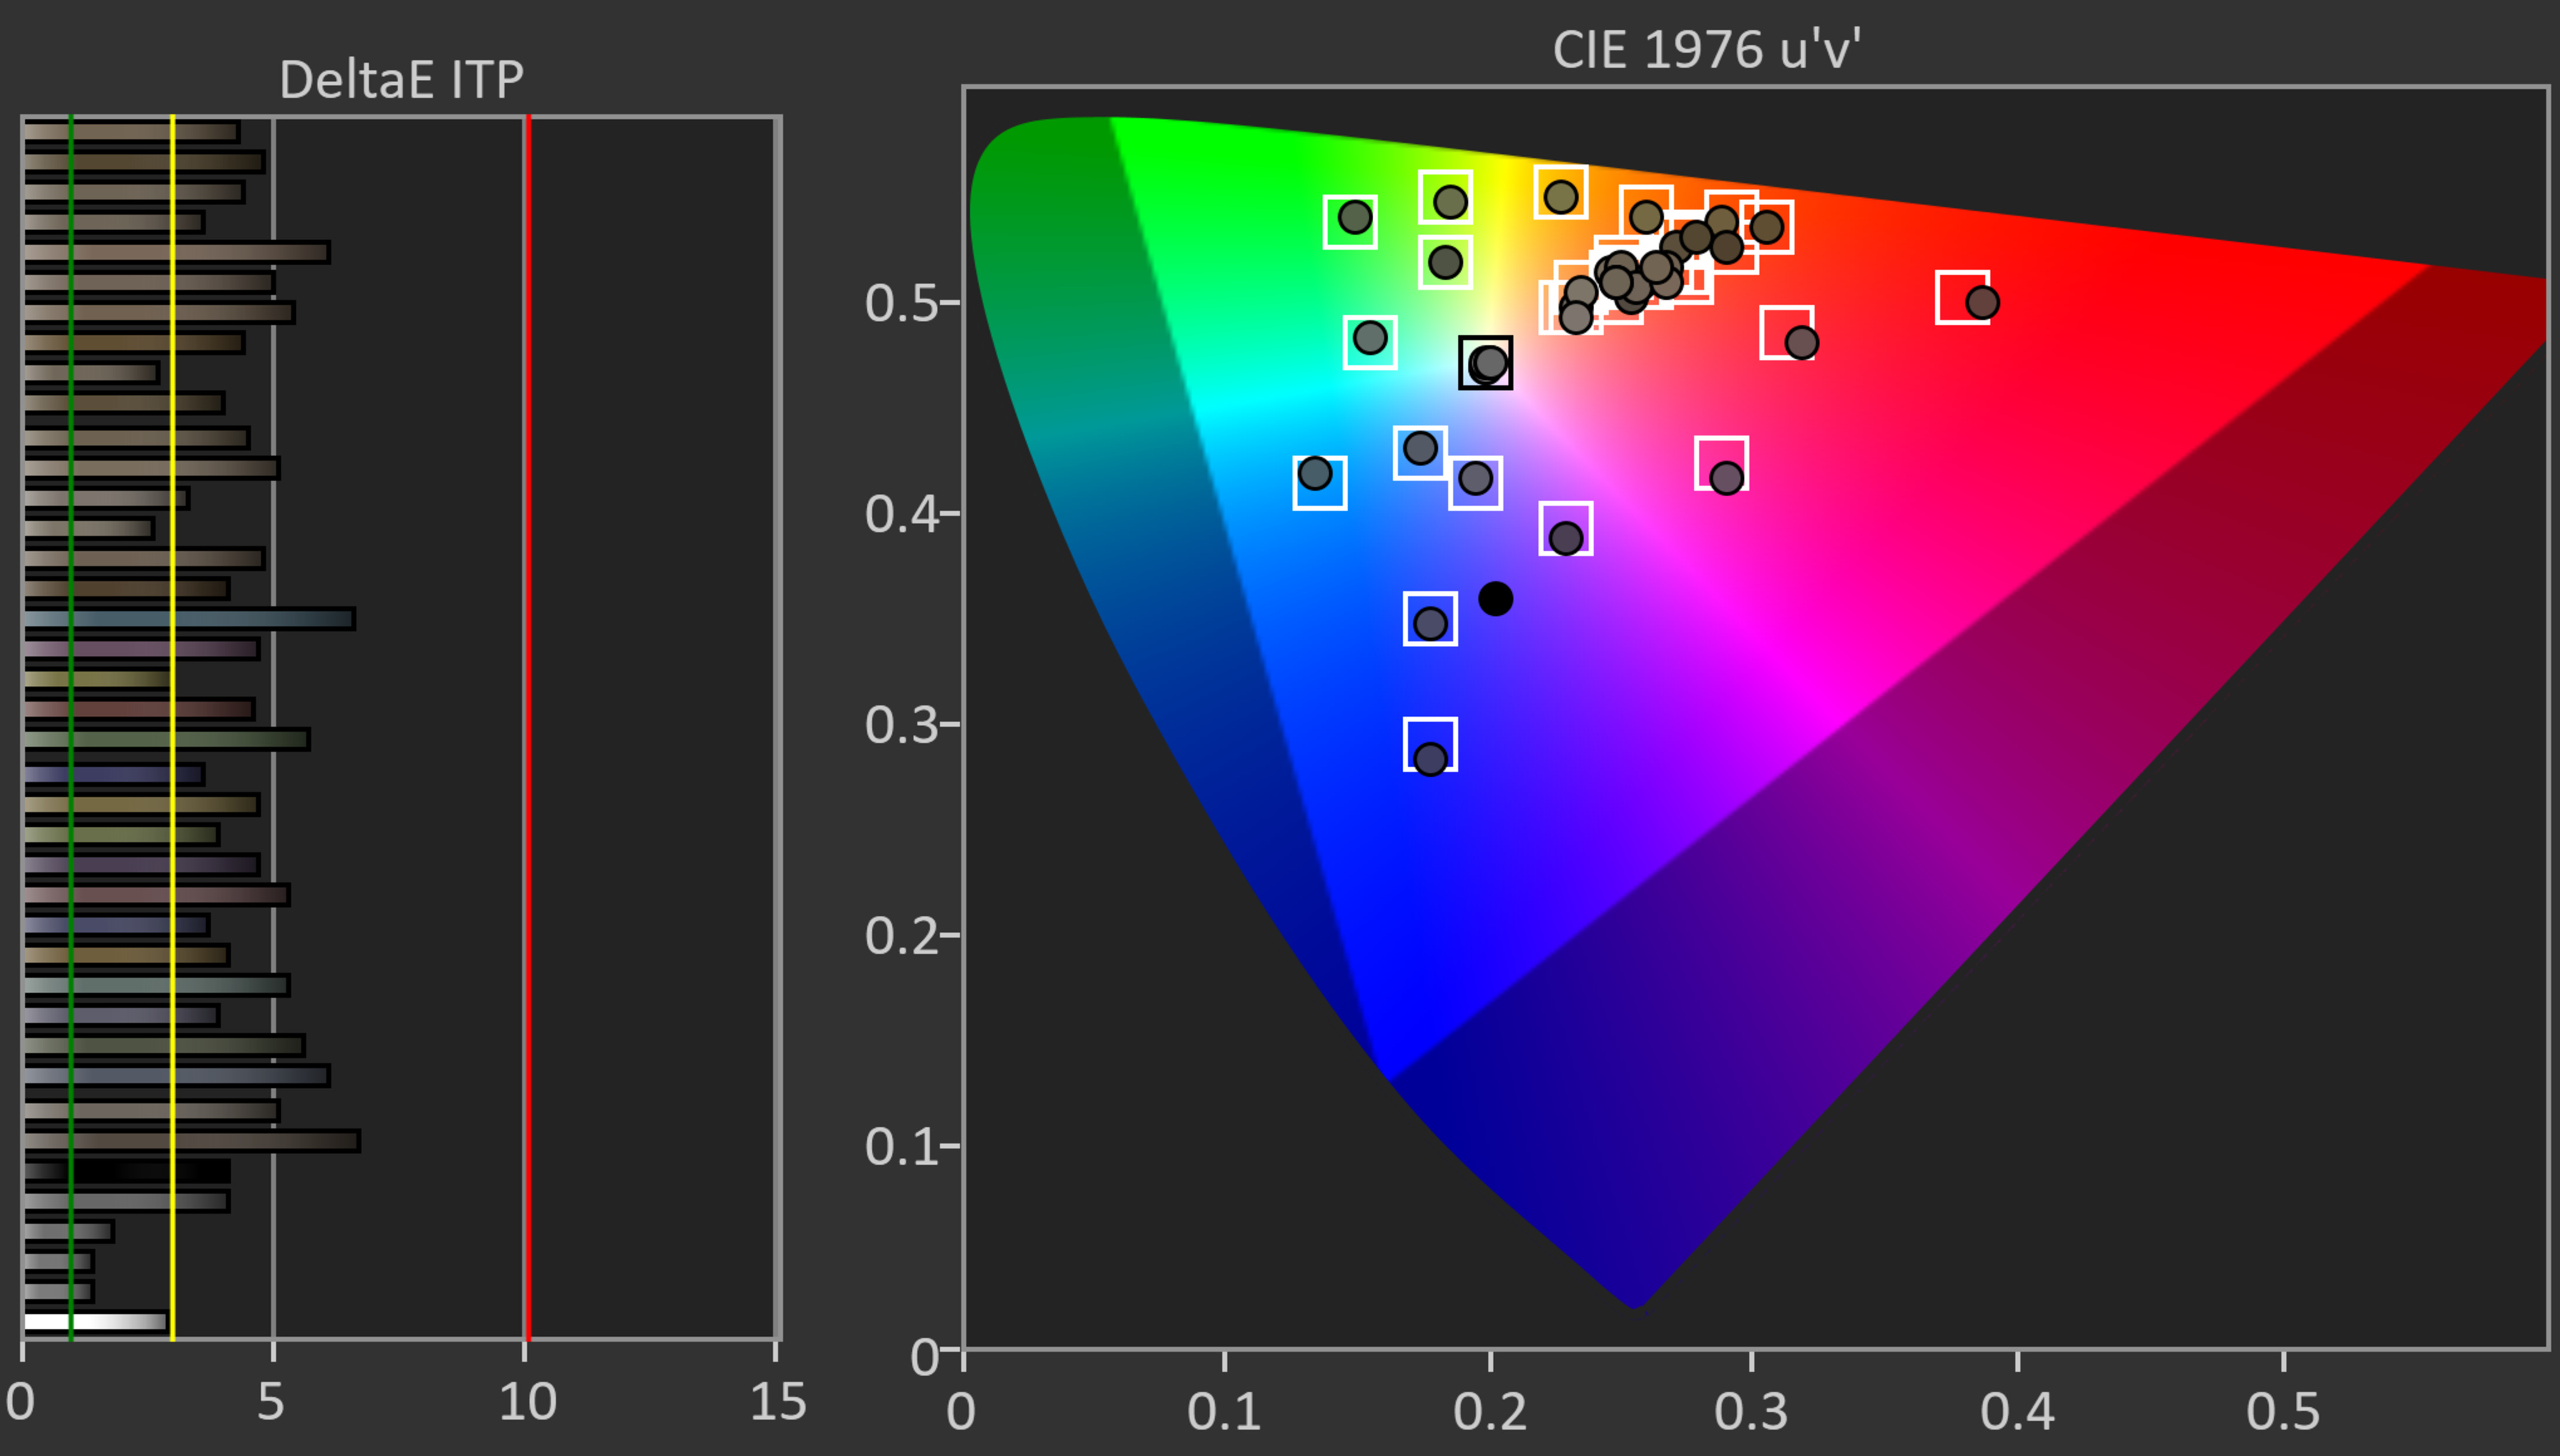
White Balance dE ITP
3.91
Color dE ITP
4.3
Color Temperature
6,601 K
Picture Mode
Professional
HDR Post-Calibration Color Accuracy
9.5
HDR Post White Balance Picture

HDR Post Color Picture

White Balance dE ITP
3.03
Color dE ITP
4.00
Color Temperature
6,461 K
Processing
PQ EOTF Tracking
8.3
PQ EOTF Graph
600 Nit Tracking Delta
0.0043
1000 Nit Tracking Delta
0.0043
4000 Nit Tracking Delta
0.0043
Low-Quality Content Smoothing
8.0
Low-Quality Content Smoothing Picture

Smoothing
8.0
Detail Preservation
8.0
Upscaling: Sharpness Processing
9.0
8.0
Sharpness Picture - 480p


HDR Native Gradient
8.0
7.2
HDR Gradient Picture


100% Black To 50% Gray
8.0
50% Gray To 100% White
8.0
100% Black To 50% Red
8.0
50% Red To 100% Red
10
100% Black To 50% Green
8.0
50% Green To 100% Green
6.0
100% Black To 50% Blue
10
50% Blue To 100% Blue
6.0
Game Mode Responsiveness
Input Lag
7.5
8.3
1080p @ 60Hz
18.0 ms
19.6 ms
1080p @ 60Hz Outside Game Mode
161.3 ms
71.4 ms
1080p @ 120Hz
9.4 ms
10.9 ms
1080p @ Max Refresh Rate
9.4 ms
4k @ 60Hz
17.8 ms
16.0 ms
4k @ 60Hz @ 4:4:4
17.8 ms
16.0 ms
4k @ 60Hz Outside Game Mode
144.5 ms
71.3 ms
4k @ 60Hz With Interpolation
137.2 ms
21.7 ms
4k @ 120Hz
9.5 ms
N/A
4k @ Max Refresh Rate
9.5 ms
8k @ 60Hz
N/A
N/A
Supported Resolutions
9.1
8.8
Resolution
4k
4k
480p @ 59.94Hz (Widescreen)
Yes
720p @ 59.94Hz
Yes
1080p @ 60Hz @ 4:4:4
Yes
Yes
1080p @ 120Hz
Yes
Yes (native support)
1080p Maximum Refresh Rate
120 Hz
4k @ 60Hz
Yes
Yes
4k @ 60Hz @ 4:4:4
Yes
Yes
4k @ 120Hz
Yes
No
4k @ 120Hz @ 4:4:4
Yes
4k Maximum Refresh Rate
120 Hz
8k @ 30Hz Or 24Hz
No
No
8k @ 60Hz
No
No
Variable Refresh Rate
7.5
8.2
Native Refresh Rate
120Hz
120 Hz
Variable Refresh Rate
Yes
Yes
HDMI Forum VRR
Yes
Yes
FreeSync
No
Yes
G-SYNC Compatible
Yes
No
4k VRR Maximum
120 Hz
60 Hz
4k VRR Minimum
< 20 Hz
48 Hz
1080p VRR Maximum
120 Hz
120 Hz
1080p VRR Minimum
< 20 Hz
< 20 Hz
VRR + Local Dimming
Yes
CAD In Game Mode @ Max Refresh Rate
5.6
Pursuit Photo Max Refresh

CAD Heatmap Max Refresh

Transition At Max Refresh

0 to 31

Avg. CAD
323
Best 10% CAD
140
Worst 10% CAD
514
CAD In Game Mode @ 120Hz
5.6
Pursuit Photo 120Hz

CAD Heatmap 120Hz

Transition At 120Hz

0 to 31
Avg. CAD
323
Best 10% CAD
140
Worst 10% CAD
514
CAD In Game Mode @ 60Hz
5.4
Pursuit Photo 60Hz

CAD Heatmap 60Hz

Transition 60Hz

0 to 31
Avg. CAD
331
Best 10% CAD
145
Worst 10% CAD
580
PS5 Compatibility
PS5 Screenshot

Auto Low Latency Mode (ALLM)
Yes
Yes
4k @ 120Hz
Yes
1440p @ 120Hz
No
1080p @ 120Hz
Yes
HDR
Yes
VRR
Yes
Xbox Series X|S Compatibility
Xbox Series X Screenshot

Auto Low Latency Mode (ALLM)
Yes
4k @ 120Hz
Yes
1440p @ 120Hz
No
1080p @ 120Hz
Yes
HDR
Yes
VRR
Yes
Motion Handling
Stutter
6.3
7.2
Frame Hold Time @ 24 fps
35.6 ms
29.1 ms
Frame Hold Time @ 60 fps
10.6 ms
4.1 ms
24p Judder
10
8.9
Judder-Free 24p
Yes
Yes
Judder-Free 24p via 60p
Yes
Yes
Judder-Free 24p via 60i
Yes
No
Judder-Free 24p via Native Apps
Yes
Yes
Response Time
7.9
8.1
Pursuit Photo 60Hz


Response Time Heatmap 60Hz

Transition At 60Hz

0 to 31
First Response Time
6.1 ms
Total Response Time
11.0 ms
Worst 10% Response Time
23.5 ms
Flicker
Backlight chart


Flicker-Free
No
No
PWM Dimming Frequency
720 Hz
240 Hz
Black Frame Insertion (BFI)
BFI Picture


BFI Frequency Picture


Optional BFI
Yes
Yes
Min Flicker For 60 fps
120 Hz
60 Hz
60Hz For 60 fps
No
Yes
120Hz For 120 fps
Yes
Yes
Min Flicker For 60 fps In Game Mode
120 Hz
60 Hz
Motion Interpolation
Motion Interpolation (30 fps) Picture


Motion Interpolation (30 fps)
Yes
Yes
Motion Interpolation (60 fps) Picture


Motion Interpolation (60 fps)
Yes
Yes
Reflections
Direct Reflections
5.4
9.2
Ring Light Picture

Direct Reflections Graph
Peak Direct Reflection Intensity
65.1%
Screen Finish
Glossy
Glossy
Ambient Black Level Raise
9.0
Black Level Raise Picture

Bright Room Black Level Raise Graph
Black Luminance @ 0 lx
0.00 cd/m²
Black Luminance @ 1000 lx
0.39 cd/m²
Total Reflected Light
5.5
Bright Room Off Picture


Ring Picture Total Reflection

Total Reflected Light Intensity
31,489% ⋅ pixel
Diffraction Artifacts
Yes
Ambient Color Saturation
7.9
Bright Room Color Volume Graph
Low-Luminance Colors @ 1000 lx
66.54%
Mid-Luminance Colors @ 1000 lx
66.91%
High-Luminance Colors @ 1000 lx
60.50%
Panel
Viewing Angle
6.3
5.4
Viewing Angle Video
Chroma Graph


Color Washout
24°
23°
Hue Graph


Color Shift
70°
20°
Lightness Graph


Brightness Loss
33°
32°
Black Level Raise
14°
26°
Gamma Shift
14°
19°
Gray Uniformity
6.3
7.7
50% Uniformity Picture


50% Std. Dev.
2.991%
3.217%
50% DSE
0.196%
0.165%
5% Uniformity Picture


5% Std. Dev.
1.090%
0.868%
5% DSE
0.108%
0.103%
Panel Technology
Spectral Power Distribution

Pixels Picture
Type
LED
LED
Sub-Type
VA
VA
Subpixel Layout
BGR
Inputs
Input Specifications
Side Inputs Picture


Rear Inputs Picture


HDMI
4 (2x HDMI 2.0, 2x HDMI 2.1)
4
HDMI 2.1 Rated Speed
48 Gbps
No
ATSC Tuner
3.0 (NEXTGEN TV)
USB Ports
2
3
HDR10
Yes
Yes
USB 3.0
Yes (1)
No
Audio Out 3.5mm
0
0
HDR10+
No
Yes
Wi-Fi
Yes (2.4 GHz, 5 GHz)
Yes (2.4 GHz, 5 GHz)
Ethernet Speed
100 Mbps
1
Composite In
1 (Adapter Required, Not Incl.)
0
Dolby Vision
Yes
No
Digital Optical Audio Out
1
1
HLG
Yes
Yes
3D
No
HDMI 2.0 Full Bandwidth
Yes (HDMI 1,2,3,4)
CEC
Yes
HDCP 2.2
Yes (HDMI 1,2,3,4)
Variable Analog Audio Out
No
Input Lag
7.5
8.3
1080p @ 60 Hz
18.0 ms
19.6 ms
1080p @ 60 Hz Outside Game Mode
161.3 ms
71.4 ms
1440p @ 60 Hz
N/A
4k @ 60 Hz
17.8 ms
16.0 ms
4k @ 60 Hz + 10 bit HDR
19.4 ms
4k @ 60 Hz @ 4:4:4
17.8 ms
16.0 ms
4k @ 60 Hz Outside Game Mode
144.5 ms
71.3 ms
4k @ 60 Hz With Interpolation
137.2 ms
21.7 ms
8k @ 60 Hz
N/A
N/A
1080p @ 120 Hz
9.4 ms
10.9 ms
1440p @ 120 Hz
10.0 ms
4k @ 120 Hz
9.5 ms
N/A
1080p with Variable Refresh Rate
6.2 ms
1440p with VRR
6.4 ms
4k with VRR
15.5 ms
8k with VRR
N/A
Auto Low Latency Mode (ALLM)
Yes
Yes
Audio Passthrough
ARC/eARC Port
eARC
No
eARC: Dolby Atmos Over Dolby Digital Plus
Yes
No
eARC: Dolby Digital Plus 7.1
Yes
eARC: LPCM 7.1 Over Dolby MAT
Yes
eARC: Dolby TrueHD 7.1
Yes
ARC
Yes (HDMI 4)
eARC: DTS:X Over DTS-HD MA
Yes
No
eARC: DTS-HD Master Audio 7.1
Yes
eARC: LPCM Channels (Bitstream)
7.1
ARC: Dolby Digital 5.1
Yes
Yes
ARC: DTS 5.1
Yes
No
Optical: Dolby Digital 5.1
Yes
Yes
Optical: DTS 5.1
Yes
No
HDR Format Support
HDR10
Yes
Yes
HDR10+
No
Yes
Dolby Vision
Yes
No
HLG
Yes
Yes
Supported Resolutions
9.1
8.8
Resolution
4k
4k
1080p @ 60 Hz @ 4:4:4
Yes
Yes
1080p @ 120 Hz
Yes
Yes (native support)
1440p @ 60 Hz
No
1440p @ 120 Hz
Yes (native support)
4k @ 60 Hz
Yes
Yes
4k @ 60 Hz @ 4:4:4
Yes
Yes
4k @ 120 Hz
Yes
No
8k @ 30 Hz or 24 Hz
No
No
8k @ 60 Hz
No
No
Input Photos
Side Inputs Picture
Rear Inputs Picture
Total Inputs
HDMI
4 (2x HDMI 2.0, 2x HDMI 2.1)
4
USB
2
3
Digital Optical Audio Out
1
1
Analog Audio Out 3.5mm
0
0
Analog Audio Out RCA
0
Component In
0
Composite In
1 (Adapter Required, Not Incl.)
0
Tuner (Cable/Ant)
1
Ethernet
100 Mbps
1
DisplayPort
0
IR In
0
SD/SDHC
0
Design
Style
Design Picture
Curved
No
No
Stand
Stand Picture


Back
Back Picture


Wall Mount
VESA 300x300
VESA 200x200
Borders
Borders Picture


Borders
0.30" (0.8 cm)
0.35" (0.9 cm)
Thickness
Thickness Picture


Max Thickness
2.24" (5.7 cm)
2.05" (5.2 cm)
Build Quality
8.5
8.0
Build quality picture


Market Context
Smart Features
Interface
Smart TV Picture


Smart OS
Google TV
Tizen
Version
10
2018
Ease of Use
Easy
Smoothness
Not Smooth
Time Taken to Select YouTube
2 s
Time Taken to Change Backlight
8 s
Advanced Options
Many
Ad-Free
0.0
0.0
Ads Picture


Ads
Yes
Yes
Opt-out
No
No
Suggested Content in Home
Yes
Yes
Opt-out of Suggested Content
No
No
Apps and Features
8.5
Apps Picture

App Selection
Great
App Smoothness
Average
Cast Capable
Yes
USB Drive Playback
Yes
USB Drive HDR Playback
Yes
HDR in Netflix
Yes
HDR in YouTube
Yes
Remote
Remote Picture


Size
Small
Voice Control
Yes
Many Features
CEC Menu Control
Yes
Other Smart Features
Yes
Remote App
Samsung SmartThings
TV Controls
Controls Picture


Mute Switch
Yes
In The Box
In The Box Picture


Misc
Power Consumption
69 W
59 W
Power Consumption (Max)
206 W
166 W
Firmware
PKG6.7240.0826NAA
1057
Sound Quality
Frequency Response
7.1
6.8
Frequency Response
Low-Frequency Extension
95.14 Hz
71.27 Hz
Std. Dev. @ 70
2.66 dB
3.45 dB
Std. Dev. @ 80
2.96 dB
3.66 dB
Std. Dev. @ Max
4.81 dB
5.49 dB
Max
90.6 dB SPL
85.0 dB SPL
Dynamic Range Compression
4.64 dB
3.96 dB
Digital Room Correction
Yes
Distortion
7.6
Total Harmonic Distortion
Weighted THD @ 80
0.407
Weighted THD @ Max
0.519
IMD @ 80
0.45%
IMD @ Max
1.25%
Picture Quality
Contrast
6.8
9.0
Checkerboard Picture
Native Contrast
4,163 : 1
5,607 : 1
Contrast with local dimming
49,776 : 1
5,611 : 1
Local Dimming
1.8
Local Dimming Video
Local Dimming
Yes
Yes
Backlight
Full-Array
Edge
SDR Peak Brightness
8.9
8.9
SDR Real Scene Peak Brightness
775 cd/m²
682 cd/m²
SDR Peak 2% Window
1,129 cd/m²
1,117 cd/m²
SDR Peak 10% Window
1,261 cd/m²
2,240 cd/m²
SDR Peak 25% Window
905 cd/m²
802 cd/m²
SDR Peak 50% Window
728 cd/m²
747 cd/m²
SDR Peak 100% Window
720 cd/m²
768 cd/m²
SDR Sustained 2% Window
1,111 cd/m²
1,104 cd/m²
SDR Sustained 10% Window
1,219 cd/m²
744 cd/m²
SDR Sustained 25% Window
901 cd/m²
799 cd/m²
SDR Sustained 50% Window
726 cd/m²
746 cd/m²
SDR Sustained 100% Window
718 cd/m²
767 cd/m²
SDR ABL
0.032
0.021
HDR Peak Brightness
7.5
8.1
HDR Real Scene Peak Brightness
717 cd/m²
HDR Peak 2% Window
1,141 cd/m²
941 cd/m²
HDR Peak 10% Window
1,254 cd/m²
2,270 cd/m²
HDR Peak 25% Window
952 cd/m²
834 cd/m²
HDR Peak 50% Window
765 cd/m²
799 cd/m²
HDR Peak 100% Window
715 cd/m²
778 cd/m²
HDR Sustained 2% Window
1,106 cd/m²
931 cd/m²
HDR Sustained 10% Window
1,212 cd/m²
744 cd/m²
HDR Sustained 25% Window
948 cd/m²
827 cd/m²
HDR Sustained 50% Window
763 cd/m²
795 cd/m²
HDR Sustained 100% Window
714 cd/m²
773 cd/m²
HDR ABL
0.030
0.011
Gray Uniformity
6.3
7.7
50% Uniformity Picture
50% Std. Dev.
2.991%
3.217%
50% DSE
0.196%
0.165%
5% Uniformity Picture
5% Std. Dev.
1.090%
0.868%
5% DSE
0.108%
0.103%
Viewing Angle
6.3
5.4
Viewing Angle Video
Chroma Graph
Color Washout
24°
23°
Hue Graph
Color Shift
70°
20°
Lightness Graph
Brightness Loss
33°
32°
Black Level Raise
14°
26°
Gamma Shift
14°
19°
Black Uniformity
6.2
8.9
Native Black Uniformity Picture
Native Std. Dev.
0.946%
0.567%
Black Uniformity Picture with Local Dimming
Std. Dev. w/ L.D.
1.391%
0.955%
Reflections
5.4
9.2
Reflections Picture

Average Room Off Picture

Bright Room Off Picture
Screen Finish
Glossy
Glossy
Total Reflections
1.5%
Indirect Reflections
0.4%
Calculated Direct Reflections
1.1%
Pre Calibration
8.5
7.7
Pre White Balance Picture
Pre Gamma Curve Picture
Pre Color Picture
White Balance dE
3.14
2.80
Color dE
1.52
2.80
Gamma
2.60
2.24
Color Temperature
6,506 K
6,106 K
Picture Mode
Custom
Movie
Color Temp Setting
Expert 1
Warm 2
Gamma Setting
0
BT.1886 +2, Brightness +2
Post Calibration
9.6
9.3
Post White Balance Picture
Post Gamma Curve Picture
Post Color Picture
White Balance dE
0.17
0.27
Color dE
0.98
1.66
Gamma
2.20
2.20
Color Temperature
6,503 K
6,573 K
White Balance Calibration
10 point
20 point
Color Calibration
Yes
Yes
Auto-Calibration Function
Yes
480p Input
9.0
8.0
480p Picture
720p Input
8.0
720p Picture

1080p Input
9.0
1080p Picture

4k Input
10
4k Picture

8k Input
0.0
8k Picture
Pixels
Pixels Picture
Type
LED
LED
Sub-Type
VA
VA
Color Gamut
9.0
Wide Color Gamut
Yes
Color Gamut DCI-P3 Picture

DCI P3 xy
99.67%
DCI P3 uv
99.57%
Color Gamut Rec.2020 Picture

Rec 2020 xy
76.66%
Rec 2020 uv
83.43%
EOTF

Color Volume
8.3
8.6
P3 Color Volume ITP Picture
Normalized DCI P3 Coverage ITP
94.0%
10,000 cd/m² DCI P3 Coverage ITP
86.2%
55.0%
2020 Color Volume ITP Picture
Normalized Rec 2020 Coverage ITP
76.7%
10,000 cd/m² Rec 2020 Coverage ITP
42.8%
44.8%
Gradient
8.0
7.2
Gradient Picture
Color Depth
10 Bit
Red (Std. Dev.)
0.138
Green (Std. Dev.)
0.149
Blue (Std. Dev.)
0.131
Gray (Std. Dev.)
0.116
Temporary Image Retention
10
Image Retention Picture

IR after 0 min recovery
0.00%
IR after 2 min recovery
0.00%
IR after 4 min recovery
0.00%
IR after 6 min recovery
0.00%
IR after 8 min recovery
0.00%
IR after 10 min recovery
0.00%
Permanent Burn-In Risk
10
Permanent Burn-In Risk
No
Motion
Response Time
7.9
8.1
Motion Blur Picture
Response Time Chart

80% Response Time
4.2 ms
100% Response Time
12.6 ms
Flicker-Free
0.0
6.0
Backlight chart
Flicker-Free
No
No
PWM Dimming Frequency
720 Hz
240 Hz
Black Frame Insertion (BFI)
0.0
10
BFI Picture
BFI Frequency Picture
Optional BFI
Yes
Yes
Min Flicker for 60 fps
120 Hz
60 Hz
60 Hz for 60 fps
No
Yes
120 Hz for 120 fps
Yes
Yes
Min Flicker for 60 fps in Game Mode
120 Hz
60 Hz
Motion Interpolation
Motion Interpolation (30 fps) Picture
Motion Interpolation (30 fps)
Yes
Yes
Motion Interpolation (60 fps) Picture
Motion Interpolation (60 fps)
Yes
Yes
Stutter
6.3
7.2
Frame Hold Time @ 24 fps
35.6 ms
29.1 ms
Frame Hold Time @ 60 fps
10.6 ms
4.1 ms
24p Judder
10
8.9
Judder-Free 24p
Yes
Yes
Judder-Free 24p via 60p
Yes
Yes
Judder-Free 24p via 60i
Yes
No
Judder-Free 24p via Native Apps
Yes
Yes
Variable Refresh Rate
7.5
8.2
Native Refresh Rate
120Hz
120 Hz
Variable Refresh Rate
Yes
Yes
HDMI Forum VRR
Yes
Yes
FreeSync
No
Yes
G-SYNC Compatible
Yes
No
4k VRR Maximum
120 Hz
60 Hz
4k VRR Minimum
< 20 Hz
48 Hz
1080p VRR Maximum
120 Hz
120 Hz
1080p VRR Minimum
< 20 Hz
< 20 Hz
1440p VRR Maximum
120 Hz
1440p VRR Minimum
< 20 Hz
VRR Supported Connectors
HDMI
Check Price
55"
XR-55X90L
SEE PRICE
BestBuy.com55"
QN55Q7FN
SEE PRICE
Amazon.com65"
XR-65X90L
SEE PRICE
BestBuy.com65"
QN65Q7FN
SEE PRICE
Amazon.com75"
XR-75X90L
SEE PRICE
BestBuy.com75"
QN75Q7FN
SEE PRICE
Amazon.com85"
XR-85X90L
SEE PRICE
BestBuy.com85"
98"
XR-98X90L
SEE PRICE
BestBuy.com98"
Sony X90L/X90CL
Samsung Q7FN/Q7/Q7F QLED 2018
Comments
Sony X90L/X90CL vs Samsung Q7FN/Q7/Q7F QLED 2018: Main Discussion
What do you think of our picks? Let us know below by starting a discussion.
Looking for a personalized buying advice from the RTINGS.com experts? Insiders have direct access to buying advice on our insider forum.