Notice: Your browser is not supported or outdated so some features of the site might not be available.
Notice: TV 2.0 is finally here! With this massive update, we've completely revamped the way we test and score TVs, with an emphasis on how a TV performs in a bright room. You can read about all the changes in our 2.0 changelog.
Notice: Improving our reviews takes a huge amount of time and effort. We're hiring writers and testers. Apply now!
- Table of Contents
- Top
- Main Differences
- Brightness
- Black Level
- Picture Quality
- Color
- Motion
- Processing
- Game Mode Responsiveness
- Motion Handling
- Reflections
- Panel
- Inputs
- Design
- Smart Features
- Sound Quality
- Comments
Samsung S85D OLED vs LG C1 OLED
Side-by-Side Comparison
Products
Samsung S85D OLED
LG C1 OLED
Tested using Methodology v2.0
Updated Apr 23, 2025 07:56 PM
SEE PRICE
Amazon.comTested using Methodology v1.11
Updated Apr 16, 2025 03:53 PM
SEE PRICE
Amazon.com

Resolution4k
Native Refresh Rate120Hz
TypeOLED
Sub-TypeWOLED
Dolby VisionNo
Screen FinishGlossy
Resolution4k
Native Refresh Rate120 Hz
TypeOLED
Sub-TypeWOLED
Dolby VisionYes
Screen FinishGlossy
Variants
- QN55S85DAEXZA (55")
- QN65S85DAEXZA (65")
- QN77S85DAEXZA (77")
- QN83S85DAEXZA (83")
- OLED48C1PUB (48")
- OLED55C1PUB (55")
- OLED65C1PUB (65")
- OLED77C1PUB (77")
- OLED83C1PUA (83")
Our Verdict
Samsung S85D OLED
LG C1 OLED
Full comparison details regarding individual product score sets can be found in the section below
Check Price
Main Differences forMixed Usage
Mixed Usage
Threshold
Mixed Usage
7.8
8.4
Direct Reflections
6.4
9.3
SDR Pre-Calibration Color Accuracy
6.7
4.5
HDR Brightness
6.3
6.8
Upscaling: Sharpness Processing
8.0
6.0
Full Comparison
Brightness
HDR Brightness
6.3
6.8
HDR Hallway Photo


HDR Cityscape Photo


HDR Landscape Photo


Hallway Lights (~1950 cd/m²)
620 cd/m²
639 cd/m²
Yellow Skyscraper (~700 cd/m²)
359 cd/m²
369 cd/m²
Landscape Pool (~300 cd/m²)
226 cd/m²
142 cd/m²
Peak 2% Window
643 cd/m²
751 cd/m²
Peak 10% Window
643 cd/m²
747 cd/m²
Peak 25% Window
472 cd/m²
412 cd/m²
Peak 50% Window
257 cd/m²
277 cd/m²
Peak 100% Window
144 cd/m²
131 cd/m²
Sustained 2% Window
631 cd/m²
729 cd/m²
Sustained 10% Window
627 cd/m²
725 cd/m²
Sustained 25% Window
467 cd/m²
392 cd/m²
Sustained 50% Window
256 cd/m²
263 cd/m²
Sustained 100% Window
142 cd/m²
125 cd/m²
Automatic Brightness Limiting (ABL)
0.095
0.109
HDR Brightness In Game Mode
5.7
6.9
HDR Hallway Photo


HDR Cityscape Photo


HDR Landscape Photo


Hallway Lights (~1950 cd/m²)
463 cd/m²
643 cd/m²
Yellow Skyscraper (~700 cd/m²)
392 cd/m²
378 cd/m²
Landscape Pool (~300 cd/m²)
162 cd/m²
135 cd/m²
Peak 2% Window
581 cd/m²
723 cd/m²
Peak 10% Window
595 cd/m²
728 cd/m²
Peak 25% Window
442 cd/m²
402 cd/m²
Peak 50% Window
263 cd/m²
284 cd/m²
Peak 100% Window
139 cd/m²
162 cd/m²
Sustained 2% Window
569 cd/m²
701 cd/m²
Sustained 10% Window
582 cd/m²
716 cd/m²
Sustained 25% Window
437 cd/m²
388 cd/m²
Sustained 50% Window
262 cd/m²
269 cd/m²
Sustained 100% Window
138 cd/m²
128 cd/m²
Automatic Brightness Limiting (ABL)
0.091
0.106
SDR Brightness
6.4
6.7
Real Scene Peak Brightness
402 cd/m²
302 cd/m²
Peak 2% Window
425 cd/m²
412 cd/m²
Peak 10% Window
434 cd/m²
414 cd/m²
Peak 25% Window
431 cd/m²
376 cd/m²
Peak 50% Window
338 cd/m²
314 cd/m²
Peak 100% Window
180 cd/m²
137 cd/m²
Sustained 2% Window
422 cd/m²
393 cd/m²
Sustained 10% Window
428 cd/m²
395 cd/m²
Sustained 25% Window
426 cd/m²
358 cd/m²
Sustained 50% Window
336 cd/m²
299 cd/m²
Sustained 100% Window
179 cd/m²
131 cd/m²
Automatic Brightness Limiting (ABL)
0.056
0.070
Black Level
Contrast
10
10
Contrast Picture


Contrast
Inf : 1
Inf : 1
Native Contrast
Inf : 1
Inf : 1
Lighting Zone Precision
10
10
Lighting Zone Precision Picture


Lighting Zone Transitions
10
10
Preferred LD Video, Moving Object
Local Dimming
No
No
Backlight
No Backlight
No Backlight
Dimming Zone Count Of The Tested TV
8,294,400
8,294,400
Contrast And Dark Details In Game Mode
9.5
9.5
Lighting Zone Precision Photo In Game Mode


Preferred LD Video, Moving Object In Game Mode
Game Transitions With VRR And Preferred LD
Black Uniformity
10
10
Black Uniformity Picture With Preferred Local Dimming

Std. Dev.
N/A
N/A
Native Black Uniformity Picture


Native Std. Dev.
0.163%
0.229%
Picture Quality
Contrast
10
10
Contrast Picture
Contrast
Inf : 1
Inf : 1
Native Contrast
Inf : 1
Inf : 1
Blooming
10
10
Blooming Photo
Lighting Zone Transitions
10
10
Preferred LD Video, Moving Object
Local Dimming
No
No
Backlight
No Backlight
No Backlight
Dimming Zones Count Of Tested TV
8,294,400
8,294,400
Contrast And Dark Details In Game Mode
9.5
9.5
Blooming Photo In Game Mode
Preferred LD Video, Moving Object In Game Mode
Game Transitions With VRR And Preferred LD
HDR Brightness
6.3
6.8
HDR Hallway Photo
HDR Cityscape Photo
HDR Landscape Photo
Hallway Lights (~1950 cd/m²)
620 cd/m²
639 cd/m²
Yellow Skyscraper (~700 cd/m²)
359 cd/m²
369 cd/m²
Landscape Pool (~300 cd/m²)
226 cd/m²
142 cd/m²
Peak 2% Window
643 cd/m²
751 cd/m²
Peak 10% Window
643 cd/m²
747 cd/m²
Peak 25% Window
472 cd/m²
412 cd/m²
Peak 50% Window
257 cd/m²
277 cd/m²
Peak 100% Window
144 cd/m²
131 cd/m²
Sustained 2% Window
631 cd/m²
729 cd/m²
Sustained 10% Window
627 cd/m²
725 cd/m²
Sustained 25% Window
467 cd/m²
392 cd/m²
Sustained 50% Window
256 cd/m²
263 cd/m²
Sustained 100% Window
142 cd/m²
125 cd/m²
Automatic Brightness Limiting (ABL)
0.095
0.109
HDR Brightness In Game Mode
5.7
6.9
HDR Hallway Photo
HDR Cityscape Photo
HDR Landscape Photo
Hallway Lights (~1950 cd/m²)
463 cd/m²
643 cd/m²
Yellow Skyscraper (~700 cd/m²)
392 cd/m²
378 cd/m²
Landscape Pool (~300 cd/m²)
162 cd/m²
135 cd/m²
Peak 2% Window
581 cd/m²
723 cd/m²
Peak 10% Window
595 cd/m²
728 cd/m²
Peak 25% Window
442 cd/m²
402 cd/m²
Peak 50% Window
263 cd/m²
284 cd/m²
Peak 100% Window
139 cd/m²
162 cd/m²
Sustained 2% Window
569 cd/m²
701 cd/m²
Sustained 10% Window
582 cd/m²
716 cd/m²
Sustained 25% Window
437 cd/m²
388 cd/m²
Sustained 50% Window
262 cd/m²
269 cd/m²
Sustained 100% Window
138 cd/m²
128 cd/m²
Automatic Brightness Limiting (ABL)
0.091
0.106
PQ EOTF Tracking
8.7
9.5
PQ EOTF Graph
600 Nit Tracking Delta
0.0037
0.0057
1000 Nit Tracking Delta
0.0034
0.0029
4000 Nit Tracking Delta
0.0033
0.0028
SDR Brightness
6.4
6.7
Real Scene Peak Brightness
402 cd/m²
302 cd/m²
Peak 2% Window
425 cd/m²
412 cd/m²
Peak 10% Window
434 cd/m²
414 cd/m²
Peak 25% Window
431 cd/m²
376 cd/m²
Peak 50% Window
338 cd/m²
314 cd/m²
Peak 100% Window
180 cd/m²
137 cd/m²
Sustained 2% Window
422 cd/m²
393 cd/m²
Sustained 10% Window
428 cd/m²
395 cd/m²
Sustained 25% Window
426 cd/m²
358 cd/m²
Sustained 50% Window
336 cd/m²
299 cd/m²
Sustained 100% Window
179 cd/m²
131 cd/m²
Automatic Brightness Limiting (ABL)
0.056
0.070
Color Gamut
8.6
Wide Color Gamut
Yes
Color Gamut DCI-P3 Picture

DCI P3 xy
96.33%
DCI P3 uv
98.83%
Color Gamut Rec.2020 Picture

Rec 2020 xy
71.28%
Rec 2020 uv
77.89%
Color Volume
7.3
7.9
P3 Color Volume ITP Picture


1,000 cd/m² DCI P3 Coverage ITP
73.9%
76.0%
2020 Color Volume ITP Picture


10,000 cd/m² Rec 2020 Coverage ITP
33.2%
34.4%
White Luminance
678 cd/m²
797 cd/m²
Red Luminance
100 cd/m²
84 cd/m²
Green Luminance
349 cd/m²
291 cd/m²
Blue Luminance
36 cd/m²
29 cd/m²
Cyan Luminance
377 cd/m²
315 cd/m²
Magenta Luminance
138 cd/m²
106 cd/m²
Yellow Luminance
440 cd/m²
362 cd/m²
Pre Calibration
6.7
4.5
Pre White Balance Picture


Pre Gamma Curve Picture


Pre Color Picture


White Balance dE
4.97
5.86
Color dE
2.24
5.13
Gamma
2.12
2.21
Color Temperature
6,817 K
7,167 K
Picture Mode
Movie
Expert (Dark Space)
Color Temp Setting
Warm 2
Warm 50
Gamma Setting
2.2
2.2
Post Calibration
9.4
9.4
Post White Balance Picture


Post Gamma Curve Picture


Post Color Picture


White Balance dE
0.23
0.16
Color dE
1.37
1.51
Gamma
2.21
2.20
Color Temperature
6,590 K
6,504 K
White Balance Calibration
20 point
22 point
Color Calibration
Yes
Yes
Gray Uniformity
7.5
8.7
50% Uniformity Picture


50% Std. Dev.
1.665%
1.280%
50% DSE
0.134%
0.124%
5% Uniformity Picture


5% Std. Dev.
0.500%
0.317%
5% DSE
0.114%
0.088%
Black Uniformity
10
10
Black Uniformity Picture With Preferred Local Dimming
Std. Dev.
N/A
N/A
Native Black Uniformity Picture
Native Std. Dev.
0.163%
0.229%
Viewing Angle
9.4
8.9
Viewing Angle Video
Chroma Graph


Color Washout
68°
57°
Hue Graph


Color Shift
37°
30°
Lightness Graph


Brightness Loss
70°
69°
Black Level Raise
70°
70°
Gamma Shift
70°
64°
Reflections
6.4
9.3
Reflections Picture

Average Room Off Picture

Bright Room Off Picture


Screen Finish
Glossy
Glossy
Total Reflections
1.4%
Indirect Reflections
0.2%
Calculated Direct Reflections
1.2%
HDR Native Gradient
8.0
7.3
HDR Gradient Picture


100% Black to 50% Gray
8.0
6.0
50% Gray to 100% White
10
8.0
100% Black to 50% Red
8.0
6.0
50% Red to 100% Red
10
10
100% Black to 50% Green
6.0
8.0
50% Green to 100% Green
8.0
6.0
100% Black to 50% Blue
6.0
6.0
50% Blue to 100% Blue
8.0
8.0
Low-Quality Content Smoothing
7.3
7.7
Low-Quality Content Smoothing Picture


Smoothing
7.0
7.5
Detail Preservation
8.0
8.0
Upscaling: Sharpness Processing
8.0
6.0
Sharpness Picture - 480p


Pixels
Pixels Picture
Subpixel Layout
RWBG
RWBG
Type
OLED
OLED
Sub-Type
WOLED
WOLED
Color
SDR Color Volume
8.1
DCI-P3 Gamut Rings

CIELAB DCI-P3 Coverage
95.22%
BT.2020 Gamut Rings

CIELAB BT.2020 Coverage
64.14%
HDR Color Volume
7.3
7.9
P3 Color Volume ITP Picture
1,000 cd/m² DCI P3 Coverage ITP
73.9%
76.0%
2020 Color Volume ITP Picture
10,000 cd/m² BT.2020 Coverage ITP
33.2%
34.4%
White Luminance
678 cd/m²
797 cd/m²
Red Luminance
100 cd/m²
84 cd/m²
Green Luminance
349 cd/m²
291 cd/m²
Blue Luminance
36 cd/m²
29 cd/m²
Cyan Luminance
377 cd/m²
315 cd/m²
Magenta Luminance
138 cd/m²
106 cd/m²
Yellow Luminance
440 cd/m²
362 cd/m²
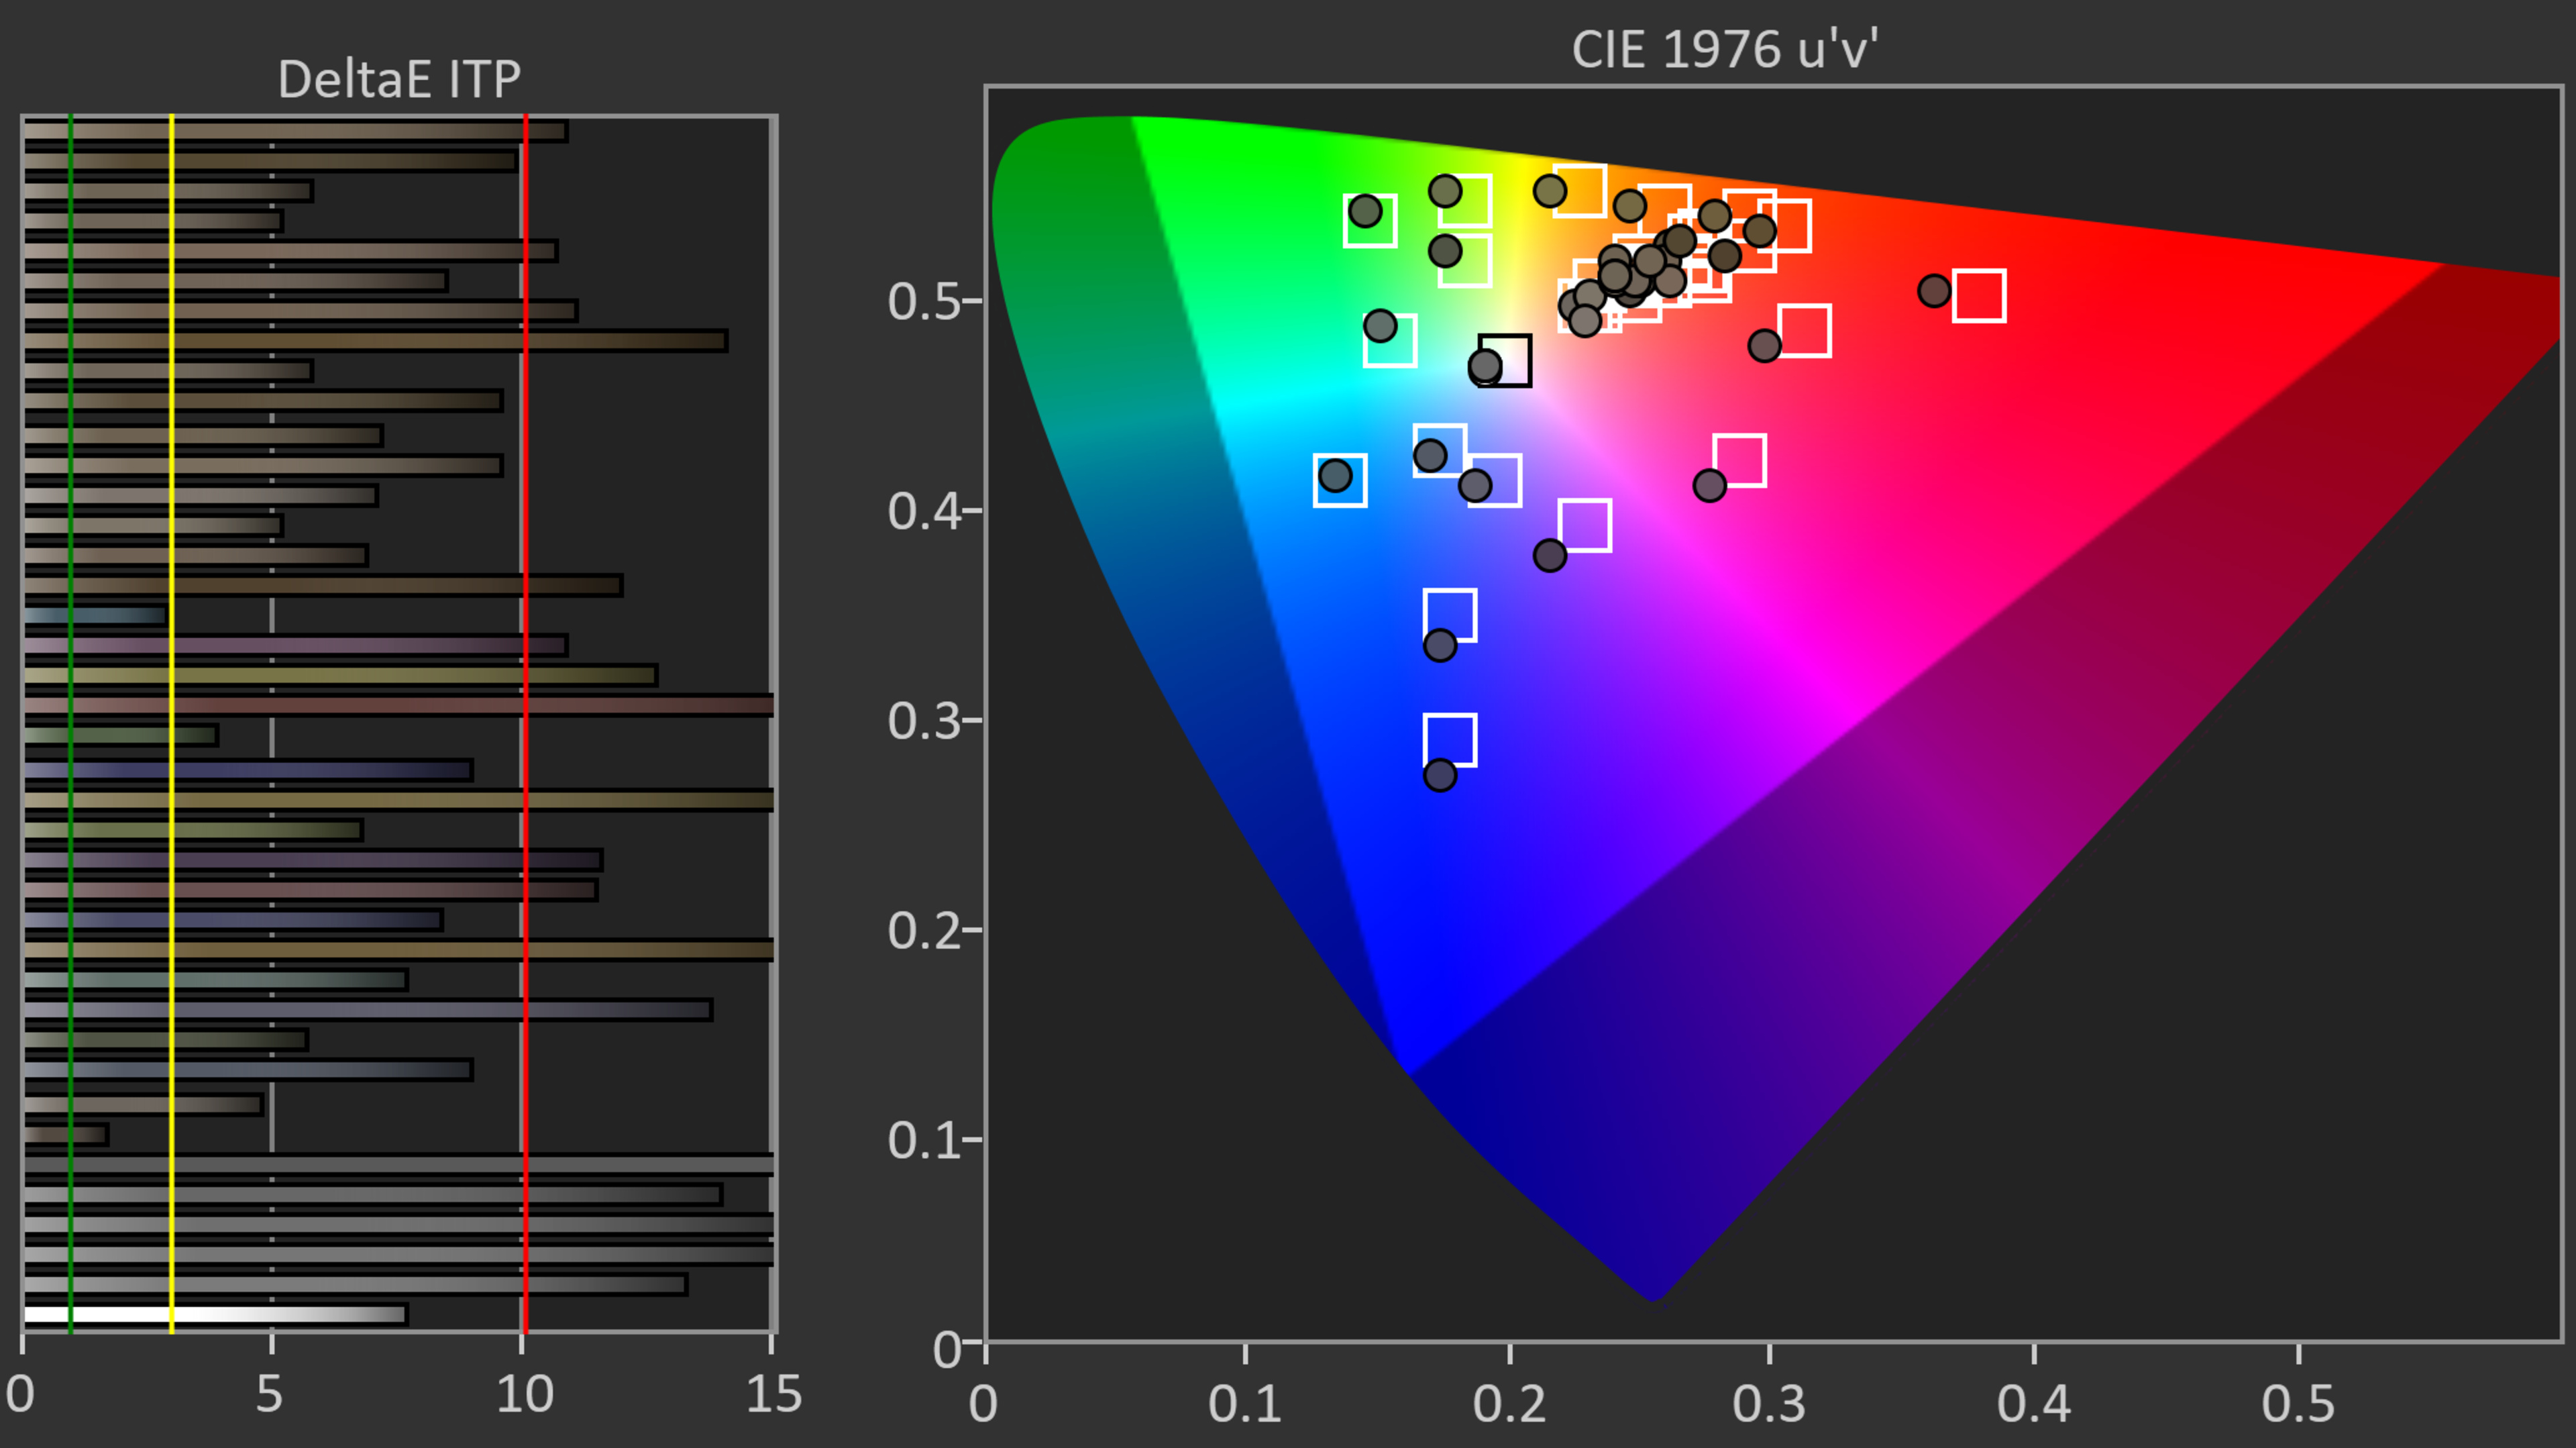
SDR Pre-Calibration Color Accuracy
6.7
4.5
Pre White Balance Picture
Pre Gamma Curve Picture
Pre Color Picture
White Balance dE 2000
4.97
5.86
Color dE 2000
2.24
5.13
Gamma
2.12
2.21
Color Temperature
6,817 K
7,167 K
Picture Mode
Movie
Expert (Dark Space)
Color Temp Setting
Warm 2
Warm 50
Gamma Setting
2.2
2.2
SDR Post-Calibration Color Accuracy
9.4
9.4
Post White Balance Picture
Post Gamma Curve Picture
Post Color Picture
White Balance dE 2000
0.23
0.16
Color dE 2000
1.37
1.51
Gamma
2.21
2.20
Color Temperature
6,590 K
6,504 K
White Balance Calibration
20 point
22 point
Color Calibration
Yes
Yes
HDR Pre-Calibration Color Accuracy
6.8
HDR Pre White Balance Picture

HDR Pre Color Picture
White Balance dE ITP
9.93
Color dE ITP
9.6
Color Temperature
7,197 K
Picture Mode
FILMMAKER MODE
HDR Post-Calibration Color Accuracy
8.4
HDR Post White Balance Picture

HDR Post Color Picture

White Balance dE ITP
4.61
Color dE ITP
9.70
Color Temperature
6,617 K
Motion
Response Time
9.4
9.9
Motion Blur Picture


Response Time Chart

80% Response Time
0.2 ms
100% Response Time
2.3 ms
Flicker-Free
0.0
10
Backlight chart


Flicker-Free
No
No
PWM Dimming Frequency
0 Hz
0 Hz
Black Frame Insertion (BFI)
BFI Picture


BFI Frequency Picture


Optional BFI
Yes
Yes
Min Flicker For 60 fps
60 Hz
60 Hz
60Hz For 60 fps
Yes
Yes
120Hz For 120 fps
No
Yes
Min Flicker for 60 fps in Game Mode
60 Hz
60 Hz
Motion Interpolation
Motion Interpolation (30 fps) Picture


Motion Interpolation (30 fps)
Yes
Yes
Motion Interpolation (60 fps) Picture


Motion Interpolation (60 fps)
Yes
Yes
Stutter
4.4
5.0
Frame Hold Time @ 24 fps
40.7 ms
39.4 ms
Frame Hold Time @ 60 fps
15.7 ms
13.4 ms
24p Judder
10
10
Judder-Free 24p
Yes
Yes
Judder-Free 24p via 60p
Yes
Yes
Judder-Free 24p via 60i
Yes
Yes
Judder-Free 24p via Native Apps
Yes
Yes
Variable Refresh Rate
7.5
9.4
Native Refresh Rate
120Hz
120 Hz
Variable Refresh Rate
Yes
Yes
HDMI Forum VRR
Yes
Yes
FreeSync
Yes
Yes
G-SYNC Compatible
Yes
Yes (NVIDIA Certified)
4k VRR Maximum
120 Hz
120 Hz
4k VRR Minimum
< 20 Hz
< 20 Hz
1080p VRR Maximum
120 Hz
120 Hz
1080p VRR Minimum
< 20 Hz
< 20 Hz
1440p VRR Maximum
120 Hz
1440p VRR Minimum
< 20 Hz
VRR + Local Dimming
No Local Dimming
No Local Dimming
Processing
PQ EOTF Tracking
8.7
9.5
PQ EOTF Graph
600 Nit Tracking Delta
0.0037
0.0057
1000 Nit Tracking Delta
0.0034
0.0029
4000 Nit Tracking Delta
0.0033
0.0028
Low-Quality Content Smoothing
7.3
7.7
Low-Quality Content Smoothing Picture
Smoothing
7.0
7.5
Detail Preservation
8.0
8.0
Upscaling: Sharpness Processing
8.0
6.0
Sharpness Picture - 480p
HDR Native Gradient
8.0
7.3
HDR Gradient Picture
100% Black To 50% Gray
8.0
6.0
50% Gray To 100% White
10
8.0
100% Black To 50% Red
8.0
6.0
50% Red To 100% Red
10
10
100% Black To 50% Green
6.0
8.0
50% Green To 100% Green
8.0
6.0
100% Black To 50% Blue
6.0
6.0
50% Blue To 100% Blue
8.0
8.0
Game Mode Responsiveness
Input Lag
8.9
9.7
1080p @ 60Hz
10.2 ms
10.1 ms
1080p @ 60Hz Outside Game Mode
98.3 ms
89.5 ms
1080p @ 120Hz
5.3 ms
5.2 ms
1080p @ Max Refresh Rate
5.3 ms
N/A
4k @ 60Hz
10.2 ms
10.1 ms
4k @ 60Hz @ 4:4:4
10.2 ms
10.0 ms
4k @ 60Hz Outside Game Mode
71.7 ms
89.4 ms
4k @ 60Hz With Interpolation
31.3 ms
85.4 ms
4k @ 120Hz
5.3 ms
5.6 ms
4k @ Max Refresh Rate
5.3 ms
N/A
8k @ 60Hz
N/A
N/A
Supported Resolutions
9.1
9.6
Resolution
4k
4k
480p @ 59.94Hz (Widescreen)
Yes
Yes
720p @ 59.94Hz
Yes
Yes
1080p @ 60Hz @ 4:4:4
Yes
Yes
1080p @ 120Hz
Yes
Yes
1080p @ 144Hz
No
No
4k @ 60Hz
Yes
Yes
4k @ 60Hz @ 4:4:4
Yes
Yes
4k @ 120Hz
Yes
Yes
4k @ 120Hz @ 4:4:4
Yes
Yes
4k @ 144Hz
No
No
8k @ 30Hz Or 24Hz
No
No
8k @ 60Hz
No
No
Variable Refresh Rate
7.5
9.4
Native Refresh Rate
120Hz
120 Hz
Variable Refresh Rate
Yes
Yes
HDMI Forum VRR
Yes
Yes
FreeSync
Yes
Yes
G-SYNC Compatible
Yes
Yes (NVIDIA Certified)
4k VRR Maximum
120 Hz
120 Hz
4k VRR Minimum
< 20 Hz
< 20 Hz
1080p VRR Maximum
120 Hz
120 Hz
1080p VRR Minimum
< 20 Hz
< 20 Hz
VRR + Local Dimming
No Local Dimming
No Local Dimming
CAD In Game Mode @ Max Refresh Rate
9.7
Pursuit Photo Max Refresh

CAD Heatmap Max Refresh

Transition At Max Refresh

0 to 31

Avg. CAD
30
Best 10% CAD
15
Worst 10% CAD
64
CAD In Game Mode @ 120Hz
9.7
Pursuit Photo 120Hz

CAD Heatmap 120Hz

Transition At 120Hz

0 to 31
Avg. CAD
30
Best 10% CAD
15
Worst 10% CAD
64
CAD In Game Mode @ 60Hz
9.6
Pursuit Photo 60Hz

CAD Heatmap 60Hz

Transition 60Hz

0 to 31
Avg. CAD
35
Best 10% CAD
16
Worst 10% CAD
88
PS5 Compatibility
PS5 Screenshot


Auto Low Latency Mode (ALLM)
Yes
Yes
4k @ 120Hz
Yes
Yes
1440p @ 120Hz
Yes
Yes
1080p @ 120Hz
Yes
Yes
HDR
Yes
Yes
VRR
Yes
Yes
Xbox Series X|S Compatibility
Xbox Series X Screenshot


Auto Low Latency Mode (ALLM)
Yes
Yes
4k @ 120Hz
Yes
Yes
1440p @ 120Hz
Yes
Yes
1080p @ 120Hz
Yes
Yes
HDR
Yes
Yes
VRR
Yes
Yes
Motion Handling
Stutter
4.4
5.0
Frame Hold Time @ 24 fps
40.7 ms
39.4 ms
Frame Hold Time @ 60 fps
15.7 ms
13.4 ms
24p Judder
10
10
Judder-Free 24p
Yes
Yes
Judder-Free 24p via 60p
Yes
Yes
Judder-Free 24p via 60i
Yes
Yes
Judder-Free 24p via Native Apps
Yes
Yes
Response Time
9.4
9.9
Pursuit Photo 60Hz
Response Time Heatmap 60Hz

Transition At 60Hz

0 to 31
First Response Time
1.0 ms
Total Response Time
1.9 ms
Worst 10% Response Time
8.5 ms
Flicker
Backlight chart
Flicker-Free
No
No
PWM Dimming Frequency
0 Hz
0 Hz
Black Frame Insertion (BFI)
BFI Picture
BFI Frequency Picture
Optional BFI
Yes
Yes
Min Flicker For 60 fps
60 Hz
60 Hz
60Hz For 60 fps
Yes
Yes
120Hz For 120 fps
No
Yes
Min Flicker For 60 fps In Game Mode
60 Hz
60 Hz
Motion Interpolation
Motion Interpolation (30 fps) Picture
Motion Interpolation (30 fps)
Yes
Yes
Motion Interpolation (60 fps) Picture
Motion Interpolation (60 fps)
Yes
Yes
Reflections
Direct Reflections
6.4
9.3
Ring Light Picture

Direct Reflections Graph
Peak Direct Reflection Intensity
44.9%
Screen Finish
Glossy
Glossy
Ambient Black Level Raise
9.3
Black Level Raise Picture

Bright Room Black Level Raise Graph
Black Luminance @ 0 lx
0.00 cd/m²
Black Luminance @ 1000 lx
0.24 cd/m²
Total Reflected Light
8.4
Bright Room Off Picture
Ring Picture Total Reflection

Total Reflected Light Intensity
12,646% ⋅ pixel
Diffraction Artifacts
No
Ambient Color Saturation
8.1
Bright Room Color Volume Graph
Low-Luminance Colors @ 1000 lx
66.56%
Mid-Luminance Colors @ 1000 lx
70.16%
High-Luminance Colors @ 1000 lx
66.03%
Panel
Viewing Angle
9.4
8.9
Viewing Angle Video
Chroma Graph
Color Washout
68°
57°
Hue Graph
Color Shift
37°
30°
Lightness Graph
Brightness Loss
70°
69°
Black Level Raise
70°
70°
Gamma Shift
70°
64°
Gray Uniformity
7.5
8.7
50% Uniformity Picture
50% Std. Dev.
1.665%
1.280%
50% DSE
0.134%
0.124%
5% Uniformity Picture
5% Std. Dev.
0.500%
0.317%
5% DSE
0.114%
0.088%
Panel Technology
Spectral Power Distribution

Pixels Picture
Type
OLED
OLED
Sub-Type
WOLED
WOLED
Subpixel Layout
RWBG
RWBG
Inputs
Input Lag
8.9
9.7
1080p @ 60Hz
10.2 ms
10.1 ms
1080p @ 60Hz Outside Game Mode
98.3 ms
89.5 ms
1080p @ 120Hz
5.3 ms
5.2 ms
1080p @ 144Hz
5.3 ms
N/A
1440p @ 60Hz
10.1 ms
1440p @ 120Hz
5.3 ms
1440p @ 144Hz
N/A
4k @ 60Hz
10.2 ms
10.1 ms
4k @ 60Hz + 10-Bit HDR
10.0 ms
4k @ 60Hz @ 4:4:4
10.2 ms
10.0 ms
4k @ 60Hz Outside Game Mode
71.7 ms
89.4 ms
4k @ 60Hz With Interpolation
31.3 ms
85.4 ms
4k @ 120Hz
5.3 ms
5.6 ms
4k @ 144Hz
5.3 ms
N/A
8k @ 60Hz
N/A
N/A
Supported Resolutions
9.1
9.6
Resolution
4k
4k
480p @ 59.94Hz (Widescreen)
Yes
Yes
720p @ 59.94Hz
Yes
Yes
1080p @ 60Hz @ 4:4:4
Yes
Yes
1080p @ 120Hz
Yes
Yes
1080p @ 144Hz
No
No
1440p @ 60Hz
Yes (forced resolution required)
1440p @ 120Hz
Yes
1440p @ 144Hz
No
4k @ 60Hz
Yes
Yes
4k @ 60Hz @ 4:4:4
Yes
Yes
4k @ 120Hz
Yes
Yes
4k @ 120Hz @ 4:4:4
Yes
Yes
4k @ 144Hz
No
No
8k @ 30Hz or 24Hz
No
No
8k @ 60Hz
No
No
PS5 Compatibility
PS5 Screenshot
Auto Low Latency Mode (ALLM)
Yes
Yes
4k @ 120Hz
Yes
Yes
1440p @ 120Hz
Yes
Yes
1080p @ 120Hz
Yes
Yes
HDR
Yes
Yes
VRR
Yes
Yes
Xbox Series X|S Compatibility
Xbox Series X Screenshot
Auto Low Latency Mode (ALLM)
Yes
Yes
4k @ 120Hz
Yes
Yes
1440p @ 120Hz
Yes
Yes
1080p @ 120Hz
Yes
Yes
HDR
Yes
Yes
VRR
Yes
Yes
Input Specifications
Side Inputs Picture


Rear Inputs Picture


HDR10
Yes
Yes
HDMI
4 (4x HDMI 2.1)
4
HDR10+
Yes
No
Dolby Vision
No
Yes
HDMI 2.1 Rated Speed
48 Gbps
Yes (HDMI 1,2,3,4)
HLG
Yes
Yes
ATSC Tuner
1.0
1.0
USB Ports
2
3
HDMI 2.0 Full Bandwidth
Yes (HDMI 1,2,3,4)
USB 3.0
No
No
Audio Out 3.5mm
1
1
Wi-Fi
Yes (2.4 GHz, 5 GHz)
Yes (2.4 GHz, 5 GHz)
Ethernet Speed
100 Mbps
1
CEC
Yes
Composite In
0
0
HDCP 2.2
Yes (HDMI 1,2,3,4)
Digital Optical Audio Out
1
1
Variable Analog Audio Out
Yes
Input Photos
Side Inputs Picture
Rear Inputs Picture
Audio Passthrough
ARC/eARC Port
eARC
eARC
eARC: Dolby Atmos Over Dolby Digital Plus
Yes
Yes
eARC: Dolby Digital Plus 7.1
Yes
Yes
eARC: LPCM 7.1 Over Dolby MAT
Yes
Yes
eARC: Dolby TrueHD 7.1
Yes
Yes
eARC: DTS:X Over DTS-HD MA
No
No
eARC: DTS-HD Master Audio 7.1
No
No
eARC: LPCM Channels (Bitstream)
7.1
7.1
ARC: Dolby Digital 5.1
Yes
Yes
ARC: DTS 5.1
No
No
Optical: Dolby Digital 5.1
Yes
Yes
Optical: DTS 5.1
No
No
Total Inputs
HDMI
4 (4x HDMI 2.1)
4
USB
2
3
Digital Optical Audio Out
1
1
Analog Audio Out 3.5mm
1
1
Analog Audio Out RCA
0
Component In
0
Composite In
0
0
Tuner (Cable/Ant)
1
Ethernet
100 Mbps
1
DisplayPort
0
IR In
0
HDR Format Support
HDR10
Yes
Yes
HDR10+
Yes
No
Dolby Vision
No
Yes
HLG
Yes
Yes
Design
Style
Design Picture
Curved
No
No
Accelerated Longevity Test
Uniformity Pictures

Month 26
50% Gray
Longevity Graph
Stand
Stand Picture


Back
Back Picture


Wall Mount
VESA 300x200
VESA 300x200
Borders
Borders Picture


Borders
0.35" (0.9 cm)
0.35" (0.9 cm)
Thickness
Thickness Picture


Max Thickness
1.26" (3.2 cm)
1.85" (4.7 cm)
Build Quality
7.5
9.0
Build quality picture


Smart Features
Interface
Smart TV Picture


Smart OS
Tizen
webOS
Version
2024
6.0
Ease of Use
Easy
Smoothness
Average
Time Taken to Select YouTube
2 s
Time Taken to Change Backlight
6 s
Advanced Options
Many
Ad-Free
0.0
0.0
Ads Picture


Ads
Yes
Yes
Opt-out
No
No
Suggested Content in Home
Yes
Yes
Opt-out of Suggested Content
No
No
Apps and Features
8.0
Apps Picture

App Selection
Great
App Smoothness
Average
Cast Capable
Yes
USB Drive Playback
Yes
USB Drive HDR Playback
Yes
HDR in Netflix
Yes
HDR in YouTube
Yes
Remote
Remote Picture


Size
Large
Voice Control
Yes
Many Features
CEC Menu Control
Yes
Other Smart Features
Yes
Remote App
LG TV Plus
TV Controls
Controls Picture


Mute Switch
Yes
In The Box
In The Box Picture


Misc
Power Consumption
104 W
79 W
Power Consumption (Max)
176 W
184 W
Firmware
1106
03.10.29
Sound Quality
Frequency Response
7.1
7.3
Frequency Response
Low-Frequency Extension
89.80 Hz
80.00 Hz
Std. Dev. @ 70
2.56 dB
3.57 dB
Std. Dev. @ 80
2.37 dB
2.93 dB
Std. Dev. @ Max
4.62 dB
4.49 dB
Max
86.5 dB SPL
91.1 dB SPL
Dynamic Range Compression
3.29 dB
5.58 dB
Digital Room Correction
Yes
Distortion
6.9
Total Harmonic Distortion
Weighted THD @ 80
0.047
Weighted THD @ Max
0.508
IMD @ 80
6.48%
IMD @ Max
12.74%
Samsung S85D OLED
LG C1 OLED
Comments
Samsung S85D OLED vs LG C1 OLED: Main Discussion
What do you think of our picks? Let us know below by starting a discussion.
Looking for a personalized buying advice from the RTINGS.com experts? Insiders have direct access to buying advice on our insider forum.