Notice: Your browser is not supported or outdated so some features of the site might not be available.
- Table of Contents
- Top
- Main Differences
- Brightness
- Black Level
- Color
- Processing
- Game Mode Responsiveness
- Motion Handling
- Reflections
- Panel
- Inputs
- Design
- Smart Features
- Sound Quality
- Picture Quality
- Motion
- Comments
Sony Z9D vs Sony BRAVIA 9 QLED
Side-by-Side Comparison
Products
Sony Z9D
Sony BRAVIA 9 QLED
Tested using Methodology v1.2
Updated Feb 22, 2024 02:34 PM
SEE PRICE
Amazon.comTested using Methodology v2.0.1
Updated May 29, 2025 05:33 PM
SEE PRICE
BestBuy.com

Resolution4k
Native Refresh Rate120 Hz
TypeLED
Sub-TypeVA
Dolby VisionYes
Screen FinishSemi-gloss
Resolution4k
Native Refresh Rate120Hz
TypeLED
Sub-TypeVA
Dolby VisionYes
Screen FinishGlossy
Variants
- XBR65Z9D (65")
- XBR75Z9D (75")
- XBR100Z9D (100")
- K-65XR90 (65")
- K-75XR90 (75")
- K-85XR90 (85")
Our Verdict
Sony Z9D
Sony BRAVIA 9 QLED
Full comparison details regarding individual product score sets can be found in the section below
Check Price
100"
XBR100Z9D
Searching
Finding store100"
65"
XBR65Z9D
Searching
Finding store65"
K-65XR90
Searching
Finding store75"
XBR75Z9D
Searching
Finding store75"
K-75XR90
Searching
Finding store85"
85"
K-85XR90
Searching
Finding storeMain Differences forMixed Usage
Mixed Usage
Threshold
Mixed Usage
8.3
8.4
Reflections
9.1
6.7
Viewing Angle
5.0
6.8
HDR Peak Brightness
9.2
8.8
Full Comparison
Brightness
HDR Brightness
9.2
8.8
HDR Hallway Photo

HDR Cityscape Photo

HDR Landscape Photo

Hallway Lights (~1950 cd/m²)
802 cd/m²
Yellow Skyscraper (~700 cd/m²)
628 cd/m²
Landscape Pool (~300 cd/m²)
289 cd/m²
Peak 2% Window
1,316 cd/m²
2,597 cd/m²
Peak 10% Window
1,653 cd/m²
2,873 cd/m²
Peak 25% Window
1,357 cd/m²
2,231 cd/m²
Peak 50% Window
906 cd/m²
1,274 cd/m²
Peak 100% Window
678 cd/m²
752 cd/m²
Sustained 2% Window
1,294 cd/m²
2,218 cd/m²
Sustained 10% Window
1,607 cd/m²
2,009 cd/m²
Sustained 25% Window
1,332 cd/m²
1,732 cd/m²
Sustained 50% Window
899 cd/m²
1,270 cd/m²
Sustained 100% Window
673 cd/m²
750 cd/m²
Automatic Brightness Limiting (ABL)
0.045
0.054
HDR Brightness In Game Mode
8.6
HDR Hallway Photo

HDR Cityscape Photo

HDR Landscape Photo

Hallway Lights (~1950 cd/m²)
732 cd/m²
Yellow Skyscraper (~700 cd/m²)
574 cd/m²
Landscape Pool (~300 cd/m²)
270 cd/m²
Peak 2% Window
2,726 cd/m²
Peak 10% Window
2,919 cd/m²
Peak 25% Window
2,236 cd/m²
Peak 50% Window
1,273 cd/m²
Peak 100% Window
749 cd/m²
Sustained 2% Window
2,152 cd/m²
Sustained 10% Window
1,885 cd/m²
Sustained 25% Window
1,620 cd/m²
Sustained 50% Window
1,268 cd/m²
Sustained 100% Window
748 cd/m²
Automatic Brightness Limiting (ABL)
0.051
SDR Brightness
9.0
9.3
Real Scene Peak Brightness
741 cd/m²
1,005 cd/m²
Peak 2% Window
1,251 cd/m²
2,607 cd/m²
Peak 10% Window
1,621 cd/m²
2,517 cd/m²
Peak 25% Window
1,339 cd/m²
2,117 cd/m²
Peak 50% Window
901 cd/m²
1,236 cd/m²
Peak 100% Window
677 cd/m²
776 cd/m²
Sustained 2% Window
1,235 cd/m²
2,389 cd/m²
Sustained 10% Window
1,583 cd/m²
1,760 cd/m²
Sustained 25% Window
1,320 cd/m²
1,798 cd/m²
Sustained 50% Window
895 cd/m²
1,232 cd/m²
Sustained 100% Window
672 cd/m²
775 cd/m²
Automatic Brightness Limiting (ABL)
0.044
0.053
Black Level
Contrast
8.7
8.9
Contrast Picture


Contrast
7,976 : 1
292,950 : 1
Native Contrast
4,322 : 1
2,792 : 1
Lighting Zone Precision
9.0
Lighting Zone Precision Picture

Lighting Zone Transitions
9.0
Preferred LD Video, Moving Object
Local Dimming
Yes
Yes
Backlight
Full-Array
Full-Array
Dimming Zone Count Of The Tested TV
1,512
Contrast And Dark Details In Game Mode
9.0
Lighting Zone Precision Photo In Game Mode

Preferred LD Video, Moving Object In Game Mode
Game Transitions With VRR And Preferred LD
Black Uniformity
8.7
8.1
Black Uniformity Picture With Preferred Local Dimming


Std. Dev.
0.555%
0.270%
Native Black Uniformity Picture


Native Std. Dev.
0.776%
1.223%
Color
SDR Color Volume
7.5
DCI-P3 Gamut Rings

CIELAB DCI-P3 Coverage
88.38%
BT.2020 Gamut Rings

CIELAB BT.2020 Coverage
67.11%
HDR Color Volume
7.4
9.0
P3 Color Volume ITP Picture


1,000 cd/m² DCI P3 Coverage ITP
53.8%
87.8%
2020 Color Volume ITP Picture


10,000 cd/m² BT.2020 Coverage ITP
42.2%
54.4%
White Luminance
2,698 cd/m²
Red Luminance
551 cd/m²
Green Luminance
1,130 cd/m²
Blue Luminance
155 cd/m²
Cyan Luminance
1,519 cd/m²
Magenta Luminance
698 cd/m²
Yellow Luminance
2,427 cd/m²
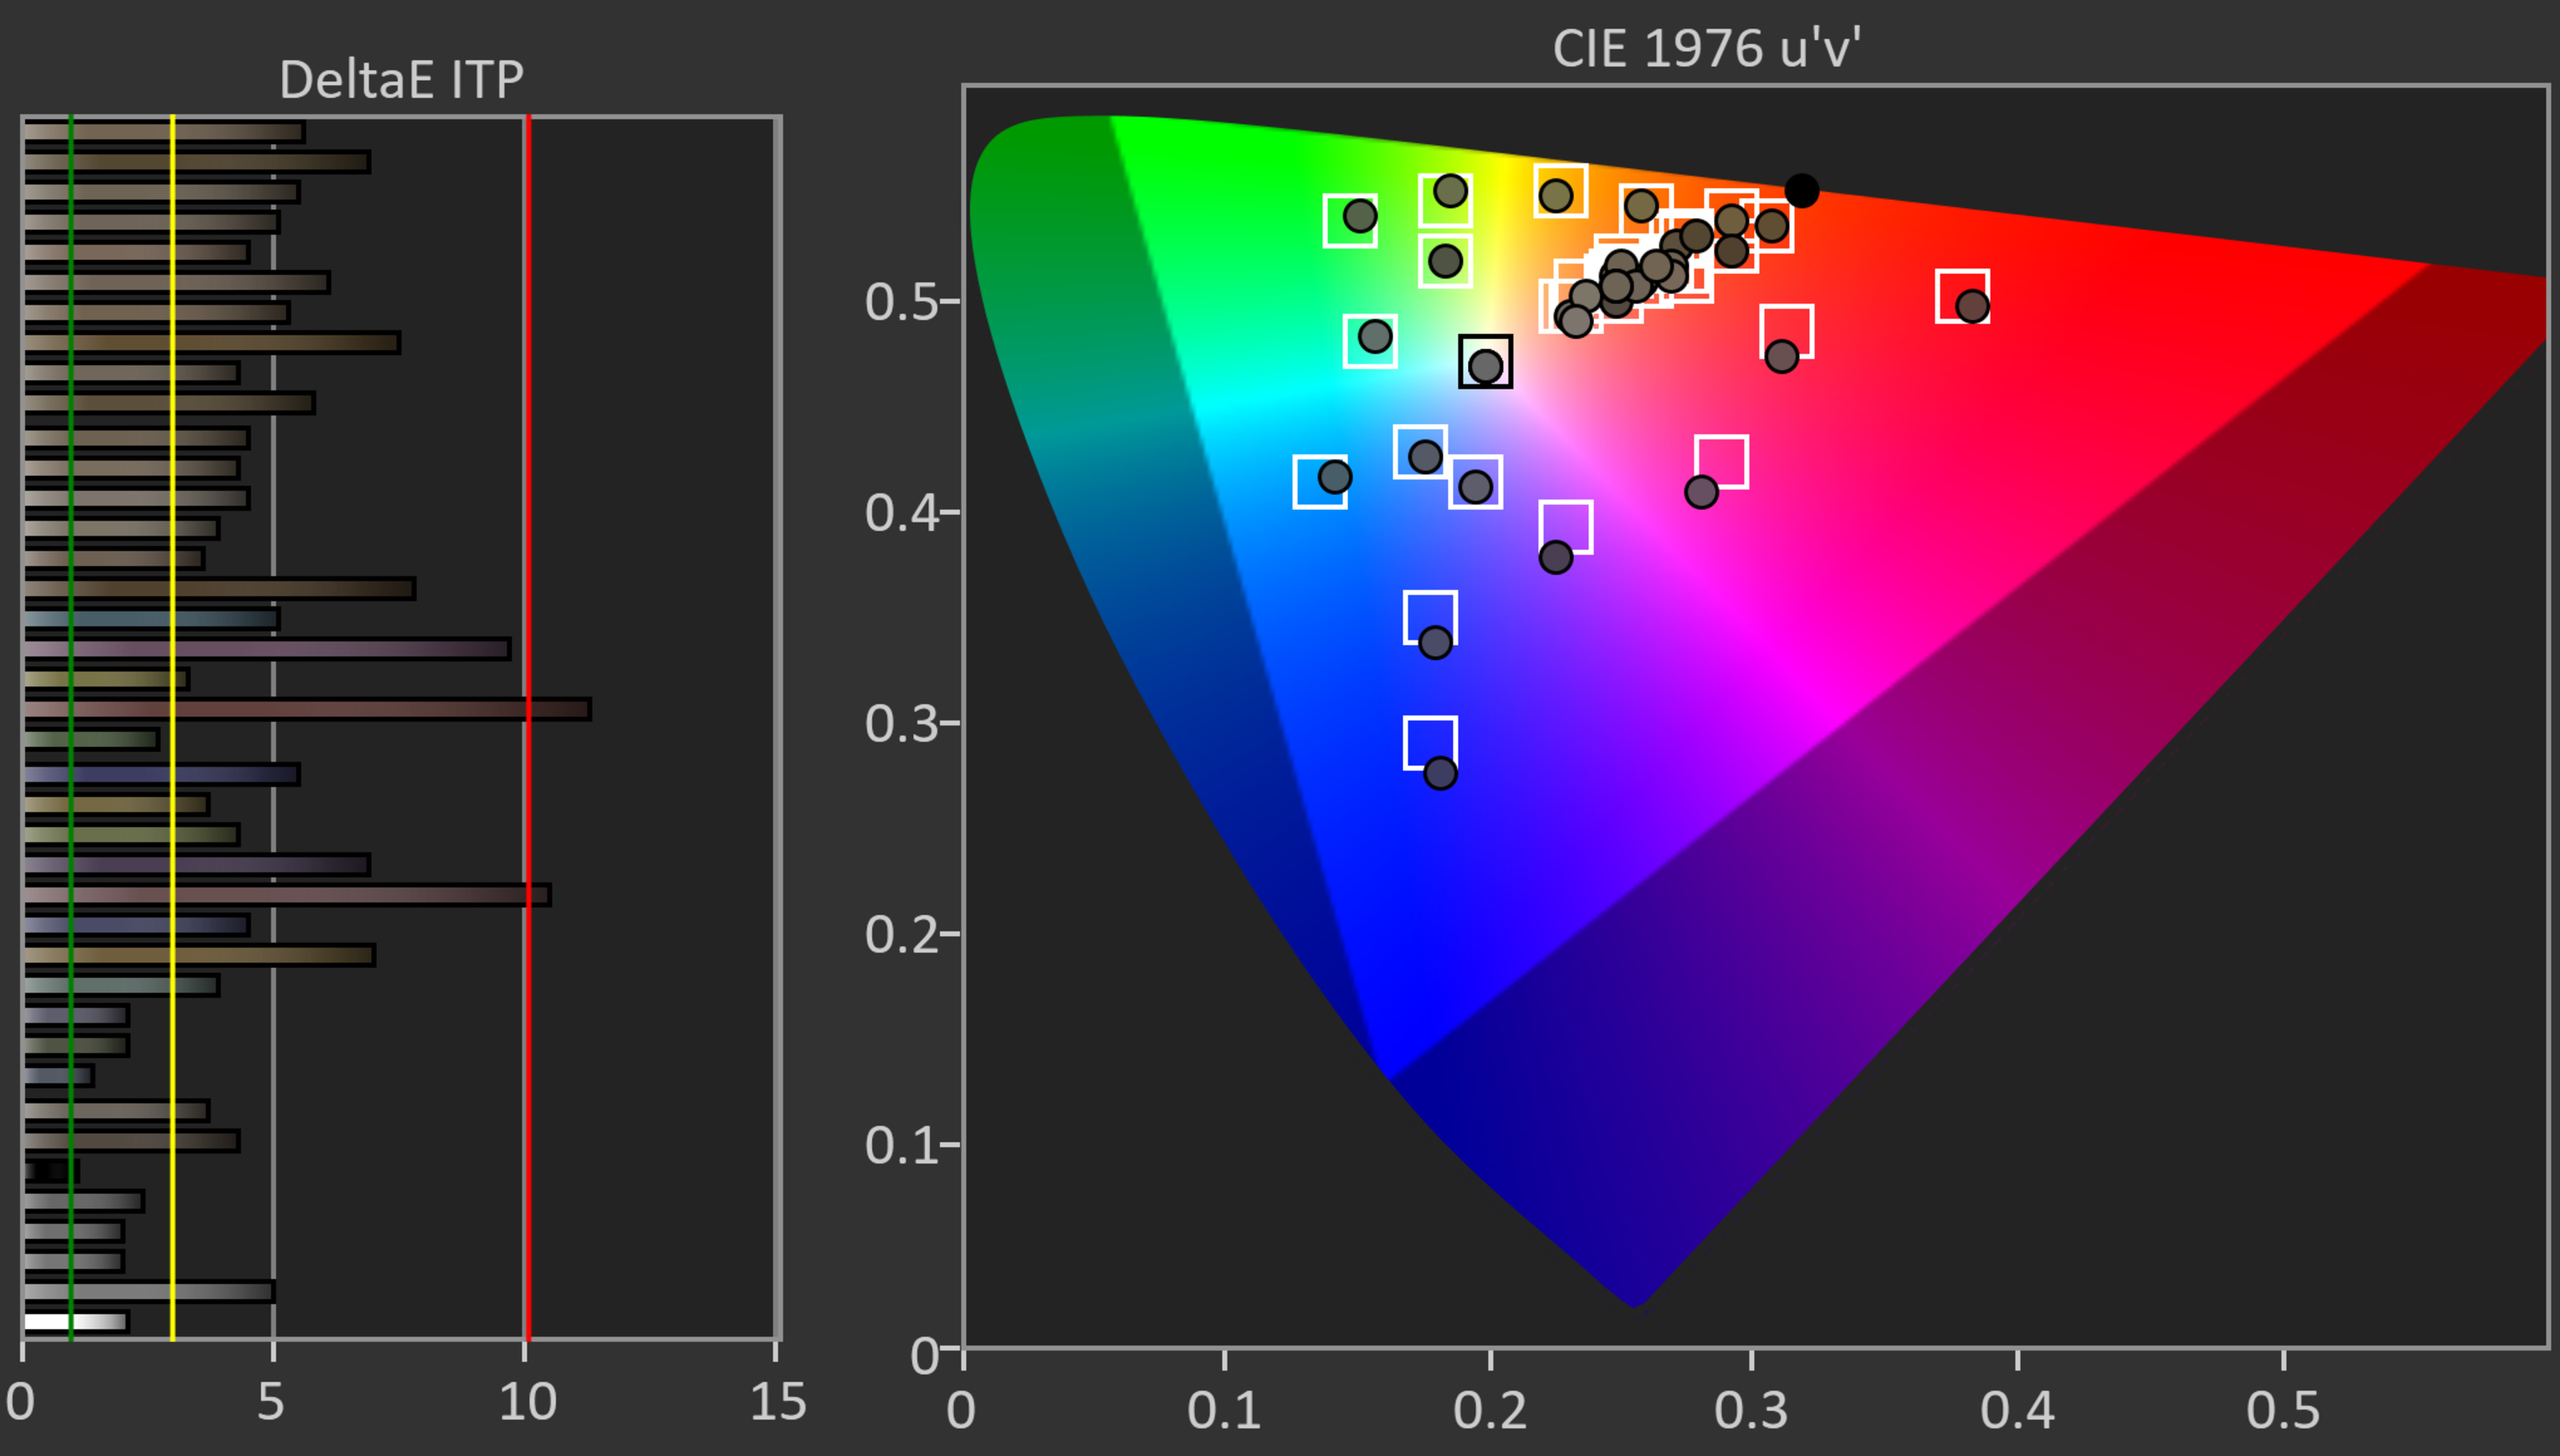
SDR Pre-Calibration Color Accuracy
8.1
8.8
Pre White Balance Picture


Pre Gamma Curve Picture


Pre Color Picture


White Balance dE 2000
2.66
2.34
Color dE 2000
1.92
1.29
Gamma
2.21
2.14
Color Temperature
6,032 K
6,492 K
Picture Mode
Custom
Professional
Color Temp Setting
Expert 1
Gamma Setting
0
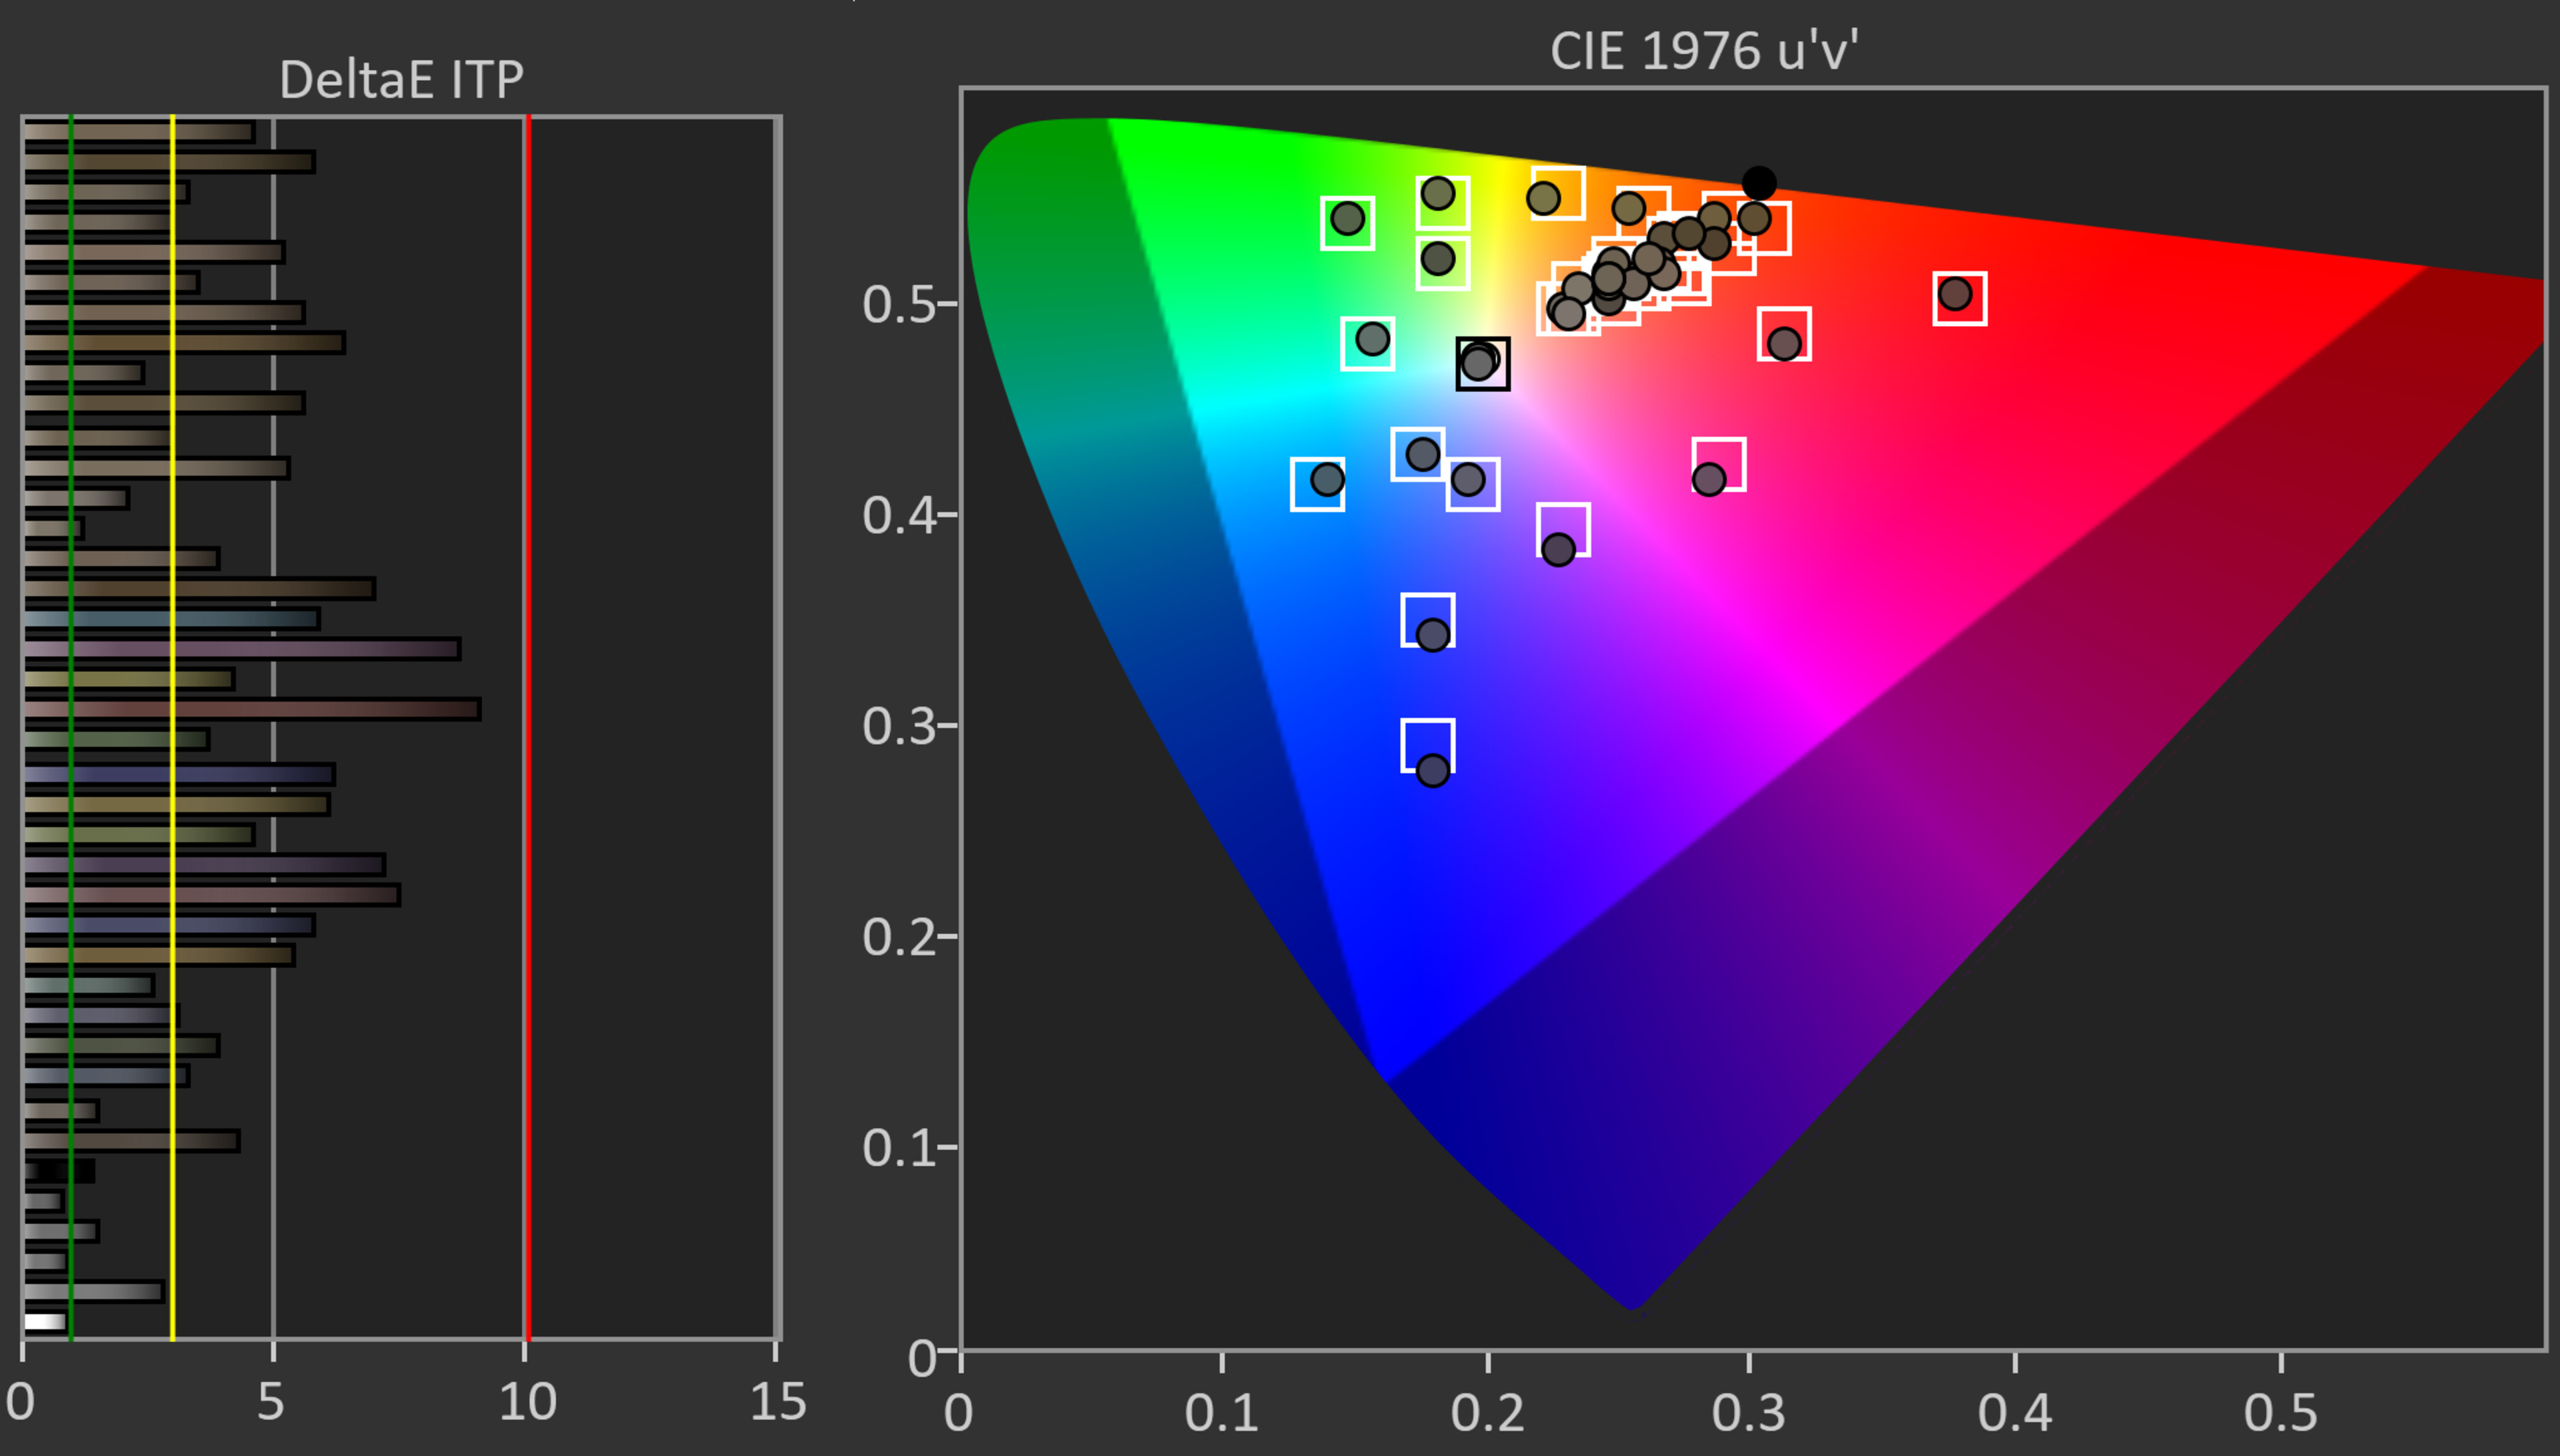
SDR Post-Calibration Color Accuracy
9.5
9.6
Post White Balance Picture


Post Gamma Curve Picture


Post Color Picture


White Balance dE 2000
0.25
0.21
Color dE 2000
1.17
1.18
Gamma
2.20
2.20
Color Temperature
6,493 K
6,502 K
White Balance Calibration
10 point
Color Calibration
Yes
HDR Pre-Calibration Color Accuracy
9.1
HDR Pre White Balance Picture

HDR Pre Color Picture
White Balance dE ITP
5.35
Color dE ITP
4.4
Color Temperature
6,604 K
Picture Mode
Professional
HDR Post-Calibration Color Accuracy
9.3
HDR Post White Balance Picture

HDR Post Color Picture
White Balance dE ITP
4.96
Color dE ITP
4.20
Color Temperature
6,462 K
Processing
PQ EOTF Tracking
8.8
PQ EOTF Graph
600 Nit Tracking Delta
0.0032
1000 Nit Tracking Delta
0.0033
4000 Nit Tracking Delta
0.0032
Low-Quality Content Smoothing
8.4
Low-Quality Content Smoothing Picture

Smoothing
8.5
Detail Preservation
8.0
Upscaling: Sharpness Processing
8.0
9.0
Sharpness Picture - 480p


HDR Native Gradient
8.9
8.3
HDR Gradient Picture


100% Black To 50% Gray
8.0
50% Gray To 100% White
10
100% Black To 50% Red
8.0
50% Red To 100% Red
10
100% Black To 50% Green
8.0
50% Green To 100% Green
8.0
100% Black To 50% Blue
8.0
50% Blue To 100% Blue
6.0
Game Mode Responsiveness
Input Lag
8.4
7.4
1080p @ 60Hz
41.3 ms
17.9 ms
1080p @ 60Hz Outside Game Mode
104.0 ms
250.6 ms
1080p @ 120Hz
14.5 ms
9.5 ms
1080p @ Max Refresh Rate
9.5 ms
4k @ 60Hz
24.5 ms
18.0 ms
4k @ 60Hz @ 4:4:4
24.4 ms
18.0 ms
4k @ 60Hz Outside Game Mode
87.3 ms
250.2 ms
4k @ 60Hz With Interpolation
83.5 ms
226.2 ms
4k @ 120Hz
N/A
9.8 ms
4k @ Max Refresh Rate
9.8 ms
8k @ 60Hz
N/A
Supported Resolutions
10
9.1
Resolution
4k
4k
480p @ 59.94Hz (Widescreen)
Yes
720p @ 59.94Hz
Yes
1080p @ 60Hz @ 4:4:4
Yes
Yes
1080p @ 120Hz
Yes (forced resolution required)
Yes
1080p Maximum Refresh Rate
120 Hz
4k @ 60Hz
Yes
Yes
4k @ 60Hz @ 4:4:4
Yes
Yes
4k @ 120Hz
No
Yes
4k @ 120Hz @ 4:4:4
Yes
4k Maximum Refresh Rate
120 Hz
8k @ 30Hz Or 24Hz
No
8k @ 60Hz
No
Variable Refresh Rate
0.0
7.5
Native Refresh Rate
120 Hz
120Hz
Variable Refresh Rate
No
Yes
HDMI Forum VRR
Yes
FreeSync
No
G-SYNC Compatible
Yes
4k VRR Maximum
N/A
120 Hz
4k VRR Minimum
N/A
< 20 Hz
1080p VRR Maximum
N/A
120 Hz
1080p VRR Minimum
N/A
< 20 Hz
VRR + Local Dimming
Yes
CAD In Game Mode @ Max Refresh Rate
5.3
Pursuit Photo Max Refresh

CAD Heatmap Max Refresh

Transition At Max Refresh


0 to 31
Avg. CAD
348
Best 10% CAD
152
Worst 10% CAD
550
CAD In Game Mode @ 120Hz
5.3
Pursuit Photo 120Hz

CAD Heatmap 120Hz

Transition At 120Hz

0 to 31
Avg. CAD
348
Best 10% CAD
152
Worst 10% CAD
550
CAD In Game Mode @ 60Hz
5.2
Pursuit Photo 60Hz

CAD Heatmap 60Hz

Transition 60Hz

0 to 31
Avg. CAD
358
Best 10% CAD
133
Worst 10% CAD
601
PS5 Compatibility
PS5 Screenshot

Auto Low Latency Mode (ALLM)
Yes
4k @ 120Hz
Yes
1440p @ 120Hz
No
1080p @ 120Hz
Yes
HDR
Yes
VRR
Yes
Xbox Series X|S Compatibility
Xbox Series X Screenshot

Auto Low Latency Mode (ALLM)
Yes
4k @ 120Hz
Yes
1440p @ 120Hz
No
1080p @ 120Hz
Yes
HDR
Yes
VRR
Yes
Motion Handling
Stutter
9.3
6.4
Frame Hold Time @ 24 fps
11.0 ms
35.3 ms
Frame Hold Time @ 60 fps
0.0 ms
10.3 ms
24p Judder
7.8
10
Judder-Free 24p
Yes
Yes
Judder-Free 24p via 60p
No
Yes
Judder-Free 24p via 60i
No
Yes
Judder-Free 24p via Native Apps
Yes
Yes
Response Time
7.4
8.5
Pursuit Photo 60Hz


Response Time Heatmap 60Hz

Transition At 60Hz

0 to 31
First Response Time
6.4 ms
Total Response Time
7.6 ms
Worst 10% Response Time
15.1 ms
Flicker
Backlight chart


Flicker-Free
No
No
PWM Dimming Frequency
720 Hz
720 Hz
Black Frame Insertion (BFI)
BFI Picture


BFI Frequency Picture


Optional BFI
Yes
Yes
Min Flicker For 60 fps
60 Hz
60 Hz
60Hz For 60 fps
Yes
Yes
120Hz For 120 fps
Yes
Yes
Min Flicker For 60 fps In Game Mode
60 Hz
60 Hz
Motion Interpolation
Motion Interpolation (30 fps) Picture


Motion Interpolation (30 fps)
Yes
Yes
Motion Interpolation (60 fps) Picture


Motion Interpolation (60 fps)
Yes
Yes
Reflections
Direct Reflections
9.1
6.7
Ring Light Picture

Direct Reflections Graph
Peak Direct Reflection Intensity
38.6%
Screen Finish
Semi-gloss
Glossy
Ambient Black Level Raise
6.9
Black Level Raise Picture

Bright Room Black Level Raise Graph
Black Luminance @ 0 lx
0.00 cd/m²
Black Luminance @ 1000 lx
1.67 cd/m²
Total Reflected Light
7.6
Bright Room Off Picture


Ring Picture Total Reflection

Total Reflected Light Intensity
15,761% ⋅ pixel
Diffraction Artifacts
Yes
Ambient Color Saturation
7.7
Bright Room Color Volume Graph
Low-Luminance Colors @ 1000 lx
63.83%
Mid-Luminance Colors @ 1000 lx
68.54%
High-Luminance Colors @ 1000 lx
62.59%
Panel
Viewing Angle
5.0
6.8
Viewing Angle Video
Chroma Graph

Color Washout
32°
Hue Graph

Color Shift
45°
Lightness Graph

Brightness Loss
46°
Black Level Raise
33°
Gamma Shift
17°
Gray Uniformity
6.9
6.0
50% Uniformity Picture


50% Std. Dev.
3.941%
3.729%
50% DSE
0.203%
0.209%
5% Uniformity Picture


5% Std. Dev.
1.220%
0.606%
5% DSE
0.129%
0.114%
Panel Technology
Spectral Power Distribution

Pixels Picture
Type
LED
LED
Sub-Type
VA
VA
Subpixel Layout
BGR
Inputs
Input Lag
8.4
7.4
1080p @ 60Hz
41.3 ms
17.9 ms
1080p @ 60Hz + HDR
41.0 ms
1080p @ 60Hz Outside Game Mode
104.0 ms
250.6 ms
1080p @ 120Hz
14.5 ms
9.5 ms
4k @ 60Hz
24.5 ms
18.0 ms
4k @ 60Hz + HDR
24.4 ms
4k @ 60Hz @ 4:4:4
24.4 ms
18.0 ms
4k @ 60Hz @ 4:4:4 + 8 bit HDR
24.5 ms
4k @ 60Hz Outside Game Mode
87.3 ms
250.2 ms
4k With Interpolation
83.5 ms
226.2 ms
4k @ 120 Hz
N/A
9.8 ms
4k with Variable Refresh Rate
N/A
1080p with Variable Refresh Rate
N/A
Input Specifications
Side Inputs Picture


HDR10
Yes
Yes
Rear Inputs Picture


HDMI
4
4 (2x HDMI 2.0, 2x HDMI 2.1)
HDMI 2.1 Rated Speed
48 Gbps
ATSC Tuner
3.0 (NEXTGEN TV)
USB Ports
3
2
USB 3.0
Yes (1)
Yes (1)
Audio Out 3.5mm
1
0
Wi-Fi
Yes (2.4 GHz, 5 GHz)
Yes (2.4 GHz, 5 GHz, 6 GHz)
Ethernet Speed
1
100 Mbps
Composite In
2 (shared)
0
Dolby Vision
Yes
Yes
Digital Optical Audio Out
1
1
HLG
Yes
Yes
3D
Yes
5.1 Passthrough ARC Dolby Digital
Yes
Yes
5.1 Passthrough ARC DTS
Yes
Yes
5.1 Passthrough Optical Dolby Digital
Yes
Yes
5.1 Passthrough Optical DTS
Yes
Yes
HDMI 2.0 Full Bandwidth
Yes (HDMI 2,3)
HDMI 2.1 Full Bandwidth
No
ARC
Yes (HDMI 3)
HDCP 2.2
Yes (HDMI 1,2,3,4)
CEC
Yes
MHL
No
Variable Analog Audio Out
Yes
Audio Passthrough
ARC/eARC Port
eARC
eARC: Dolby Atmos Over Dolby Digital Plus
Yes
eARC: Dolby Digital Plus 7.1
Yes
eARC: LPCM 7.1 Over Dolby MAT
Yes
eARC: Dolby TrueHD 7.1
Yes
eARC: DTS:X Over DTS-HD MA
Yes
eARC: DTS-HD Master Audio 7.1
Yes
eARC: LPCM Channels (Bitstream)
7.1
ARC: Dolby Digital 5.1
Yes
Yes
ARC: DTS 5.1
Yes
Yes
Optical: Dolby Digital 5.1
Yes
Yes
Optical: DTS 5.1
Yes
Yes
HDR Format Support
HDR10
Yes
Yes
HDR10+
No
Dolby Vision
Yes
Yes
HLG
Yes
Yes
Supported Resolutions
10
9.1
Resolution
4k
4k
1080p @ 60Hz @ 4:4:4
Yes
Yes
1080p @ 120Hz
Yes (forced resolution required)
Yes
1440p @ 60Hz
Yes
4k @ 30Hz @ 4:4:4
Yes
4k @ 60Hz
Yes
Yes
4k @ 60Hz @ 4:4:4
Yes
Yes
4k @ 120Hz
No
Yes
Side Inputs
Side Inputs Picture
Rear Inputs
Rear Inputs Picture
Total Inputs
HDMI
4
4 (2x HDMI 2.0, 2x HDMI 2.1)
USB
3
2
Digital Optical Audio Out
1
1
Analog Audio Out 3.5mm
1
0
Analog Audio Out RCA
0
Component In
1 (shared)
Composite In
2 (shared)
0
Tuner (Cable/Ant)
1
Ethernet
1
100 Mbps
DisplayPort
0
IR In
1
SD/SDHC
0
Design
Style
Design Picture
Curved
No
No
Stand
Stand Picture


Back
Back Picture


Wall Mount
VESA 400x300
VESA 300x300
Borders
Borders Picture


Borders
0.71" (1.8 cm)
0.28" (0.7 cm)
Thickness
Thickness Picture


Max Thickness
3.27" (8.3 cm)
1.85" (4.7 cm)
Build Quality
9.5
9.0
Build quality picture


Temperature
Temperature picture

Maximum Temperature
97 °F (36 °C)
Average Temperature
90 °F (32 °C)
Smart Features
Interface
Smart TV Picture


Smart OS
Android TV
Google TV
Version
6.0
12
Ease of Use
Average
Smoothness
Not Smooth
Time Taken to Select YouTube
4 s
Time Taken to Change Backlight
7 s
Advanced Options
Many
Ad-Free
10
0.0
Ads Picture

Ads
No
Yes
Opt-out
N/A
No
Suggested Content in Home
Yes
Yes
Opt-out of Suggested Content
Yes
No
Apps and Features
9.0
Apps Picture

App Selection
Very Many
App Smoothness
Average
Cast Capable
Yes
USB Drive Playback
Yes
USB Drive HDR Playback
Yes
HDR in Netflix
Yes
HDR in Amazon Video
Yes
HDR in YouTube
No
Remote
Remote Picture


Size
Large
Voice Control
Many Features
Yes
CEC Menu Control
Yes
Other Smart Features
No
Remote App
7.0
Remote App Picture

Acts as the Remote
Yes
Directly Launches Apps and Inputs
Both
Inputs Text in YouTube
No
Inputs Text in Netflix
No
Streams Device Files
Yes
Controls TV Settings
No
Voice Control
Yes
TV Controls
Controls Picture


Mute Switch
Yes
In The Box
In The Box Picture


Misc
Power Consumption
91 W
75 W
Power Consumption (Max)
270 W
278 W
Firmware
PKG6.0612.0004NAA
112.627.030.1NAA
Sound Quality
Frequency Response
5.6
7.9
Frequency Response
Low-Frequency Extension
169.51 Hz
84.76 Hz
Std. Dev. @ 70
4.68 dB
1.91 dB
Std. Dev. @ 80
4.96 dB
1.81 dB
Std. Dev. @ Max
6.35 dB
3.55 dB
Max
90.5 dB SPL
93.1 dB SPL
Dynamic Range Compression
3.07 dB
3.52 dB
Digital Room Correction
Yes
Distortion
6.5
Total Harmonic Distortion
Weighted THD @ 80
0.078
Weighted THD @ Max
8.865
IMD @ 80
2.88%
IMD @ Max
12.37%
Picture Quality
Contrast
8.7
8.9
Checkerboard Picture
Native Contrast
4,322 : 1
2,792 : 1
Contrast with local dimming
7,976 : 1
292,950 : 1
Local Dimming
8.5
Local Dimming Video
Local Dimming
Yes
Yes
Backlight
Full-Array
Full-Array
SDR Peak Brightness
9.0
9.3
SDR Real Scene Peak Brightness
741 cd/m²
1,005 cd/m²
SDR Peak 2% Window
1,251 cd/m²
2,607 cd/m²
SDR Peak 10% Window
1,621 cd/m²
2,517 cd/m²
SDR Peak 25% Window
1,339 cd/m²
2,117 cd/m²
SDR Peak 50% Window
901 cd/m²
1,236 cd/m²
SDR Peak 100% Window
677 cd/m²
776 cd/m²
SDR Sustained 2% Window
1,235 cd/m²
2,389 cd/m²
SDR Sustained 10% Window
1,583 cd/m²
1,760 cd/m²
SDR Sustained 25% Window
1,320 cd/m²
1,798 cd/m²
SDR Sustained 50% Window
895 cd/m²
1,232 cd/m²
SDR Sustained 100% Window
672 cd/m²
775 cd/m²
SDR ABL
0.044
0.053
HDR Peak Brightness
9.2
8.8
HDR Real Scene Peak Brightness
1,375 cd/m²
HDR Peak 2% Window
1,316 cd/m²
2,597 cd/m²
HDR Peak 10% Window
1,653 cd/m²
2,873 cd/m²
HDR Peak 25% Window
1,357 cd/m²
2,231 cd/m²
HDR Peak 50% Window
906 cd/m²
1,274 cd/m²
HDR Peak 100% Window
678 cd/m²
752 cd/m²
HDR Sustained 2% Window
1,294 cd/m²
2,218 cd/m²
HDR Sustained 10% Window
1,607 cd/m²
2,009 cd/m²
HDR Sustained 25% Window
1,332 cd/m²
1,732 cd/m²
HDR Sustained 50% Window
899 cd/m²
1,270 cd/m²
HDR Sustained 100% Window
673 cd/m²
750 cd/m²
HDR ABL
0.045
0.054
Gray Uniformity
6.9
6.0
50% Uniformity Picture
50% Std. Dev.
3.941%
3.729%
50% DSE
0.203%
0.209%
5% Uniformity Picture
5% Std. Dev.
1.220%
0.606%
5% DSE
0.129%
0.114%
Viewing Angle
5.0
6.8
Viewing Angle Video
Color Shift Picture

Color Shift
19°
Brightness Picture

Brightness
40°
Black Level Picture

Black Level
35°
Black Uniformity
8.7
8.1
Native Black Uniformity Picture
Native Std. Dev.
0.776%
1.223%
Black Uniformity Picture with Local Dimming
Std. Dev. w/ L.D.
0.555%
0.270%
Reflections
9.1
6.7
Reflections Picture

Average Room Off Picture

Bright Room Off Picture
Screen Finish
Semi-gloss
Glossy
Total Reflections
2.6%
Indirect Reflections
0.2%
Pre Calibration
8.1
8.8
Pre Calibration Picture
Pre Gamma Curve Picture
Pre Color Picture
Picture Mode
Custom
Professional
White Balance dE
2.66
2.34
Color dE
1.92
1.29
Gamma
2.21
2.14
Color Temperature
6,032 K
6,492 K
Post Calibration
9.5
9.6
Post Calibration Picture
Post Gamma Curve Picture
Post Color Picture
Picture Mode
Custom
White Balance dE
0.25
0.21
Color dE
1.17
1.18
Gamma
2.20
2.20
Color Temperature
6,493 K
6,502 K
480p Input
8.0
9.0
480p Picture
720p Input
8.0
720p Picture

1080p Input
9.0
1080p Picture

4k Input
10
4k Picture

Color Gamut
7.9
Wide Color Gamut
Yes
Color Gamut DCI-P3 Picture

DCI P3 xy
85.94%
DCI P3 uv
93.40%
Color Gamut Rec.2020 Picture

Rec 2020 xy
63.09%
Rec 2020 uv
71.77%
EOTF

Color Volume
7.4
9.0
P3 Color Volume ITP Picture
Normalized DCI P3 Coverage ITP
83.2%
10,000 cd/m² DCI P3 Coverage ITP
53.8%
87.8%
2020 Color Volume ITP Picture
Normalized Rec 2020 Coverage ITP
65.2%
10,000 cd/m² Rec 2020 Coverage ITP
42.2%
54.4%
Gradient
8.9
8.3
Gradient Picture
Color Depth
10 Bit
Red (Std. Dev.)
0.096
Green (Std. Dev.)
0.085
Blue (Std. Dev.)
0.086
Gray (Std. Dev.)
0.048
Temporary Image Retention
10
Image Retention Picture

IR after 0 min recovery
0.00%
IR after 2 min recovery
0.00%
IR after 4 min recovery
0.00%
IR after 6 min recovery
0.00%
IR after 8 min recovery
0.00%
IR after 10 min recovery
0.00%
Permanent Burn-In Risk
10
Permanent Burn-In Risk
No
Pixels
Pixels Picture
Type
LED
LED
Sub-Type
VA
VA
Motion
Response Time
7.4
8.5
Motion Blur Picture
Response Time Chart

80% Response Time
4.4 ms
100% Response Time
30.7 ms
Flicker-Free
9.5
0.0
Backlight chart
Flicker-Free
No
No
PWM Dimming Frequency
720 Hz
720 Hz
Black Frame Insertion (BFI)
9.3
0.0
BFI Picture
BFI Frequency Picture
Optional BFI
Yes
Yes
Min Flicker for 60 fps
60 Hz
60 Hz
60 Hz for 60 fps
Yes
Yes
120 Hz for 120 fps
Yes
Yes
Min Flicker for 60 fps in Game Mode
60 Hz
60 Hz
Motion Interpolation
10
0.0
Motion Interpolation (30 fps) Picture
Motion Interpolation (30 fps)
Yes
Yes
Motion Interpolation (60 fps) Picture
Motion Interpolation (60 fps)
Yes
Yes
Stutter
9.3
6.4
Frame Hold Time @ 24 fps
11.0 ms
35.3 ms
Frame Hold Time @ 60 fps
0.0 ms
10.3 ms
24p Judder
7.8
10
Judder-Free 24p
Yes
Yes
Judder-Free 24p via 60p
No
Yes
Judder-Free 24p via 60i
No
Yes
Judder-Free 24p via Native Apps
Yes
Yes
Variable Refresh Rate
0.0
7.5
Native Refresh Rate
120 Hz
120Hz
Variable Refresh Rate
No
Yes
4k VRR Maximum
N/A
120 Hz
4k VRR Minimum
N/A
< 20 Hz
1080p VRR Maximum
N/A
120 Hz
1080p VRR Minimum
N/A
< 20 Hz
VRR Supported Connectors
N/A
Check Price
100"
XBR100Z9D
Searching
Finding store100"
65"
XBR65Z9D
Searching
Finding store65"
K-65XR90
Searching
Finding store75"
XBR75Z9D
Searching
Finding store75"
K-75XR90
Searching
Finding store85"
85"
K-85XR90
Searching
Finding store
Sony Z9D
Sony BRAVIA 9 QLED
Comments
Sony Z9D vs Sony BRAVIA 9 QLED: Main Discussion
What do you think of our picks? Let us know below by starting a discussion.
Looking for a personalized buying advice from the RTINGS.com experts? Insiders have direct access to buying advice on our insider forum.