Notice: Your browser is not supported or outdated so some features of the site might not be available.
Notice: TV 2.0 is finally here! With this massive update, we've completely revamped the way we test and score TVs, with an emphasis on how a TV performs in a bright room. You can read about all the changes in our 2.0 changelog.
Notice: Improving our reviews takes a huge amount of time and effort. We're hiring writers and testers. Apply now!
- Table of Contents
- Top
- Main Differences
- Brightness
- Black Level
- Color
- Processing
- Game Mode Responsiveness
- Motion Handling
- Reflections
- Panel
- Inputs
- Design
- Smart Features
- Sound Quality
- Picture Quality
- Motion
- Comments
TCL QM8/QM851G QLED vs Sony X900H
Side-by-Side Comparison
Products
TCL QM8/QM851G QLED
Sony X900H
Tested using Methodology v2.0
Updated Mar 26, 2025 03:59 PM
SEE PRICE
Amazon.comTested using Methodology v1.6
Updated Feb 07, 2025 06:26 PM
SEE PRICE
Amazon.com

Resolution4k
Native Refresh Rate144Hz
TypeLED
Sub-TypeVA
Dolby VisionYes
Screen FinishGlossy
Resolution4k
Native Refresh Rate120 Hz
TypeLED
Sub-TypeVA
Dolby VisionYes
Screen FinishSemi-gloss
Variants
- 65QM851G (65")
- 75QM851G (75")
- 85QM851G (85")
- 98QM851G (98")
- XBR55X900H (55")
- XBR65X900H (65")
- XBR75X900H (75")
- XBR85X900H (85")
Our Verdict
TCL QM8/QM851G QLED
Sony X900H
Full comparison details regarding individual product score sets can be found in the section below
Check Price
55"
55"
XBR55X900H
SEARCH
Amazon.com65"
65QM851G
SEE PRICE
Amazon.com65"
XBR65X900H
SEARCH
Amazon.com75"
75QM851G
SEE PRICE
Amazon.com75"
XBR75X900H
SEARCH
Amazon.com85"
85QM851G
SEE PRICE
Amazon.com85"
XBR85X900H
SEE PRICE
Amazon.com98"
98QM851G
SEE PRICE
Amazon.com98"
Notice: Two or more of the products selected have been tested with different test methodologies, so some of the results below aren't directly comparable.
Learn how our test benches and scoring system work, and read more about the latest changes to our
TVs test methodology.
Read more
Main Differences forMixed Usage
Mixed Usage
Threshold
Mixed Usage
8.2
8.1
HDR Brightness
9.4
6.9
SDR Brightness
9.5
8.2
Full Comparison
Brightness
HDR Brightness
9.4
6.9
HDR Hallway Photo

HDR Cityscape Photo

HDR Landscape Photo

Hallway Lights (~1950 cd/m²)
1,472 cd/m²
Yellow Skyscraper (~700 cd/m²)
611 cd/m²
Landscape Pool (~300 cd/m²)
473 cd/m²
Peak 2% Window
2,564 cd/m²
358 cd/m²
Peak 10% Window
3,467 cd/m²
447 cd/m²
Peak 25% Window
3,338 cd/m²
736 cd/m²
Peak 50% Window
1,814 cd/m²
677 cd/m²
Peak 100% Window
967 cd/m²
545 cd/m²
Sustained 2% Window
2,497 cd/m²
356 cd/m²
Sustained 10% Window
3,319 cd/m²
446 cd/m²
Sustained 25% Window
3,253 cd/m²
723 cd/m²
Sustained 50% Window
1,810 cd/m²
673 cd/m²
Sustained 100% Window
965 cd/m²
544 cd/m²
Automatic Brightness Limiting (ABL)
0.060
0.041
HDR Brightness In Game Mode
9.4
7.5
HDR Hallway Photo

HDR Cityscape Photo

HDR Landscape Photo

Hallway Lights (~1950 cd/m²)
1,393 cd/m²
Yellow Skyscraper (~700 cd/m²)
625 cd/m²
Landscape Pool (~300 cd/m²)
447 cd/m²
Peak 2% Window
4,167 cd/m²
471 cd/m²
Peak 10% Window
3,425 cd/m²
550 cd/m²
Peak 25% Window
3,366 cd/m²
746 cd/m²
Peak 50% Window
1,796 cd/m²
608 cd/m²
Peak 100% Window
956 cd/m²
531 cd/m²
Sustained 2% Window
2,384 cd/m²
469 cd/m²
Sustained 10% Window
3,300 cd/m²
540 cd/m²
Sustained 25% Window
3,251 cd/m²
731 cd/m²
Sustained 50% Window
1,792 cd/m²
607 cd/m²
Sustained 100% Window
953 cd/m²
530 cd/m²
Automatic Brightness Limiting (ABL)
0.060
0.023
SDR Brightness
9.5
8.2
Real Scene Peak Brightness
1,108 cd/m²
474 cd/m²
Peak 2% Window
4,043 cd/m²
423 cd/m²
Peak 10% Window
3,355 cd/m²
462 cd/m²
Peak 25% Window
3,291 cd/m²
604 cd/m²
Peak 50% Window
1,767 cd/m²
530 cd/m²
Peak 100% Window
940 cd/m²
466 cd/m²
Sustained 2% Window
2,320 cd/m²
420 cd/m²
Sustained 10% Window
3,238 cd/m²
457 cd/m²
Sustained 25% Window
3,171 cd/m²
598 cd/m²
Sustained 50% Window
1,761 cd/m²
529 cd/m²
Sustained 100% Window
938 cd/m²
465 cd/m²
Automatic Brightness Limiting (ABL)
0.060
0.020
Black Level
Contrast
8.9
8.6
Contrast Picture


Contrast
201,150 : 1
5,386 : 1
Native Contrast
6,515 : 1
4,267 : 1
Lighting Zone Precision
8.5
Lighting Zone Precision Picture

Lighting Zone Transitions
8.5
Preferred LD Video, Moving Object
Local Dimming
Yes
Yes
Backlight
Full-Array
Full-Array
Dimming Zone Count Of The Tested TV
2,880
Contrast And Dark Details In Game Mode
9.0
Lighting Zone Precision Photo In Game Mode

Preferred LD Video, Moving Object In Game Mode
Game Transitions With VRR And Preferred LD
Black Uniformity
8.9
8.8
Black Uniformity Picture With Preferred Local Dimming


Std. Dev.
0.154%
1.390%
Native Black Uniformity Picture


Native Std. Dev.
0.569%
0.558%
Color
SDR Color Volume
7.7
DCI-P3 Gamut Rings

CIELAB DCI-P3 Coverage
90.94%
BT.2020 Gamut Rings

CIELAB BT.2020 Coverage
67.01%
HDR Color Volume
9.0
7.2
P3 Color Volume ITP Picture


1,000 cd/m² DCI P3 Coverage ITP
85.2%
31.0%
2020 Color Volume ITP Picture


10,000 cd/m² BT.2020 Coverage ITP
54.8%
26.5%
White Luminance
2,513 cd/m²
Red Luminance
585 cd/m²
Green Luminance
1,885 cd/m²
Blue Luminance
189 cd/m²
Cyan Luminance
2,075 cd/m²
Magenta Luminance
773 cd/m²
Yellow Luminance
2,451 cd/m²
SDR Pre-Calibration Color Accuracy
7.5
8.7
Pre White Balance Picture


Pre Gamma Curve Picture


Pre Color Picture


White Balance dE 2000
3.36
1.73
Color dE 2000
2.07
1.89
Gamma
2.09
2.23
Color Temperature
6,127 K
6,460 K
Picture Mode
Movie
Custom
Color Temp Setting
Warm -5
Expert 1
Gamma Setting
2.2
0
SDR Post-Calibration Color Accuracy
9.6
9.2
Post White Balance Picture


Post Gamma Curve Picture


Post Color Picture


White Balance dE 2000
0.24
0.54
Color dE 2000
0.82
1.70
Gamma
2.20
2.20
Color Temperature
6,483 K
6,509 K
White Balance Calibration
20 point
10 point
Color Calibration
Yes
No
HDR Pre-Calibration Color Accuracy
5.7
HDR Pre White Balance Picture

HDR Pre Color Picture
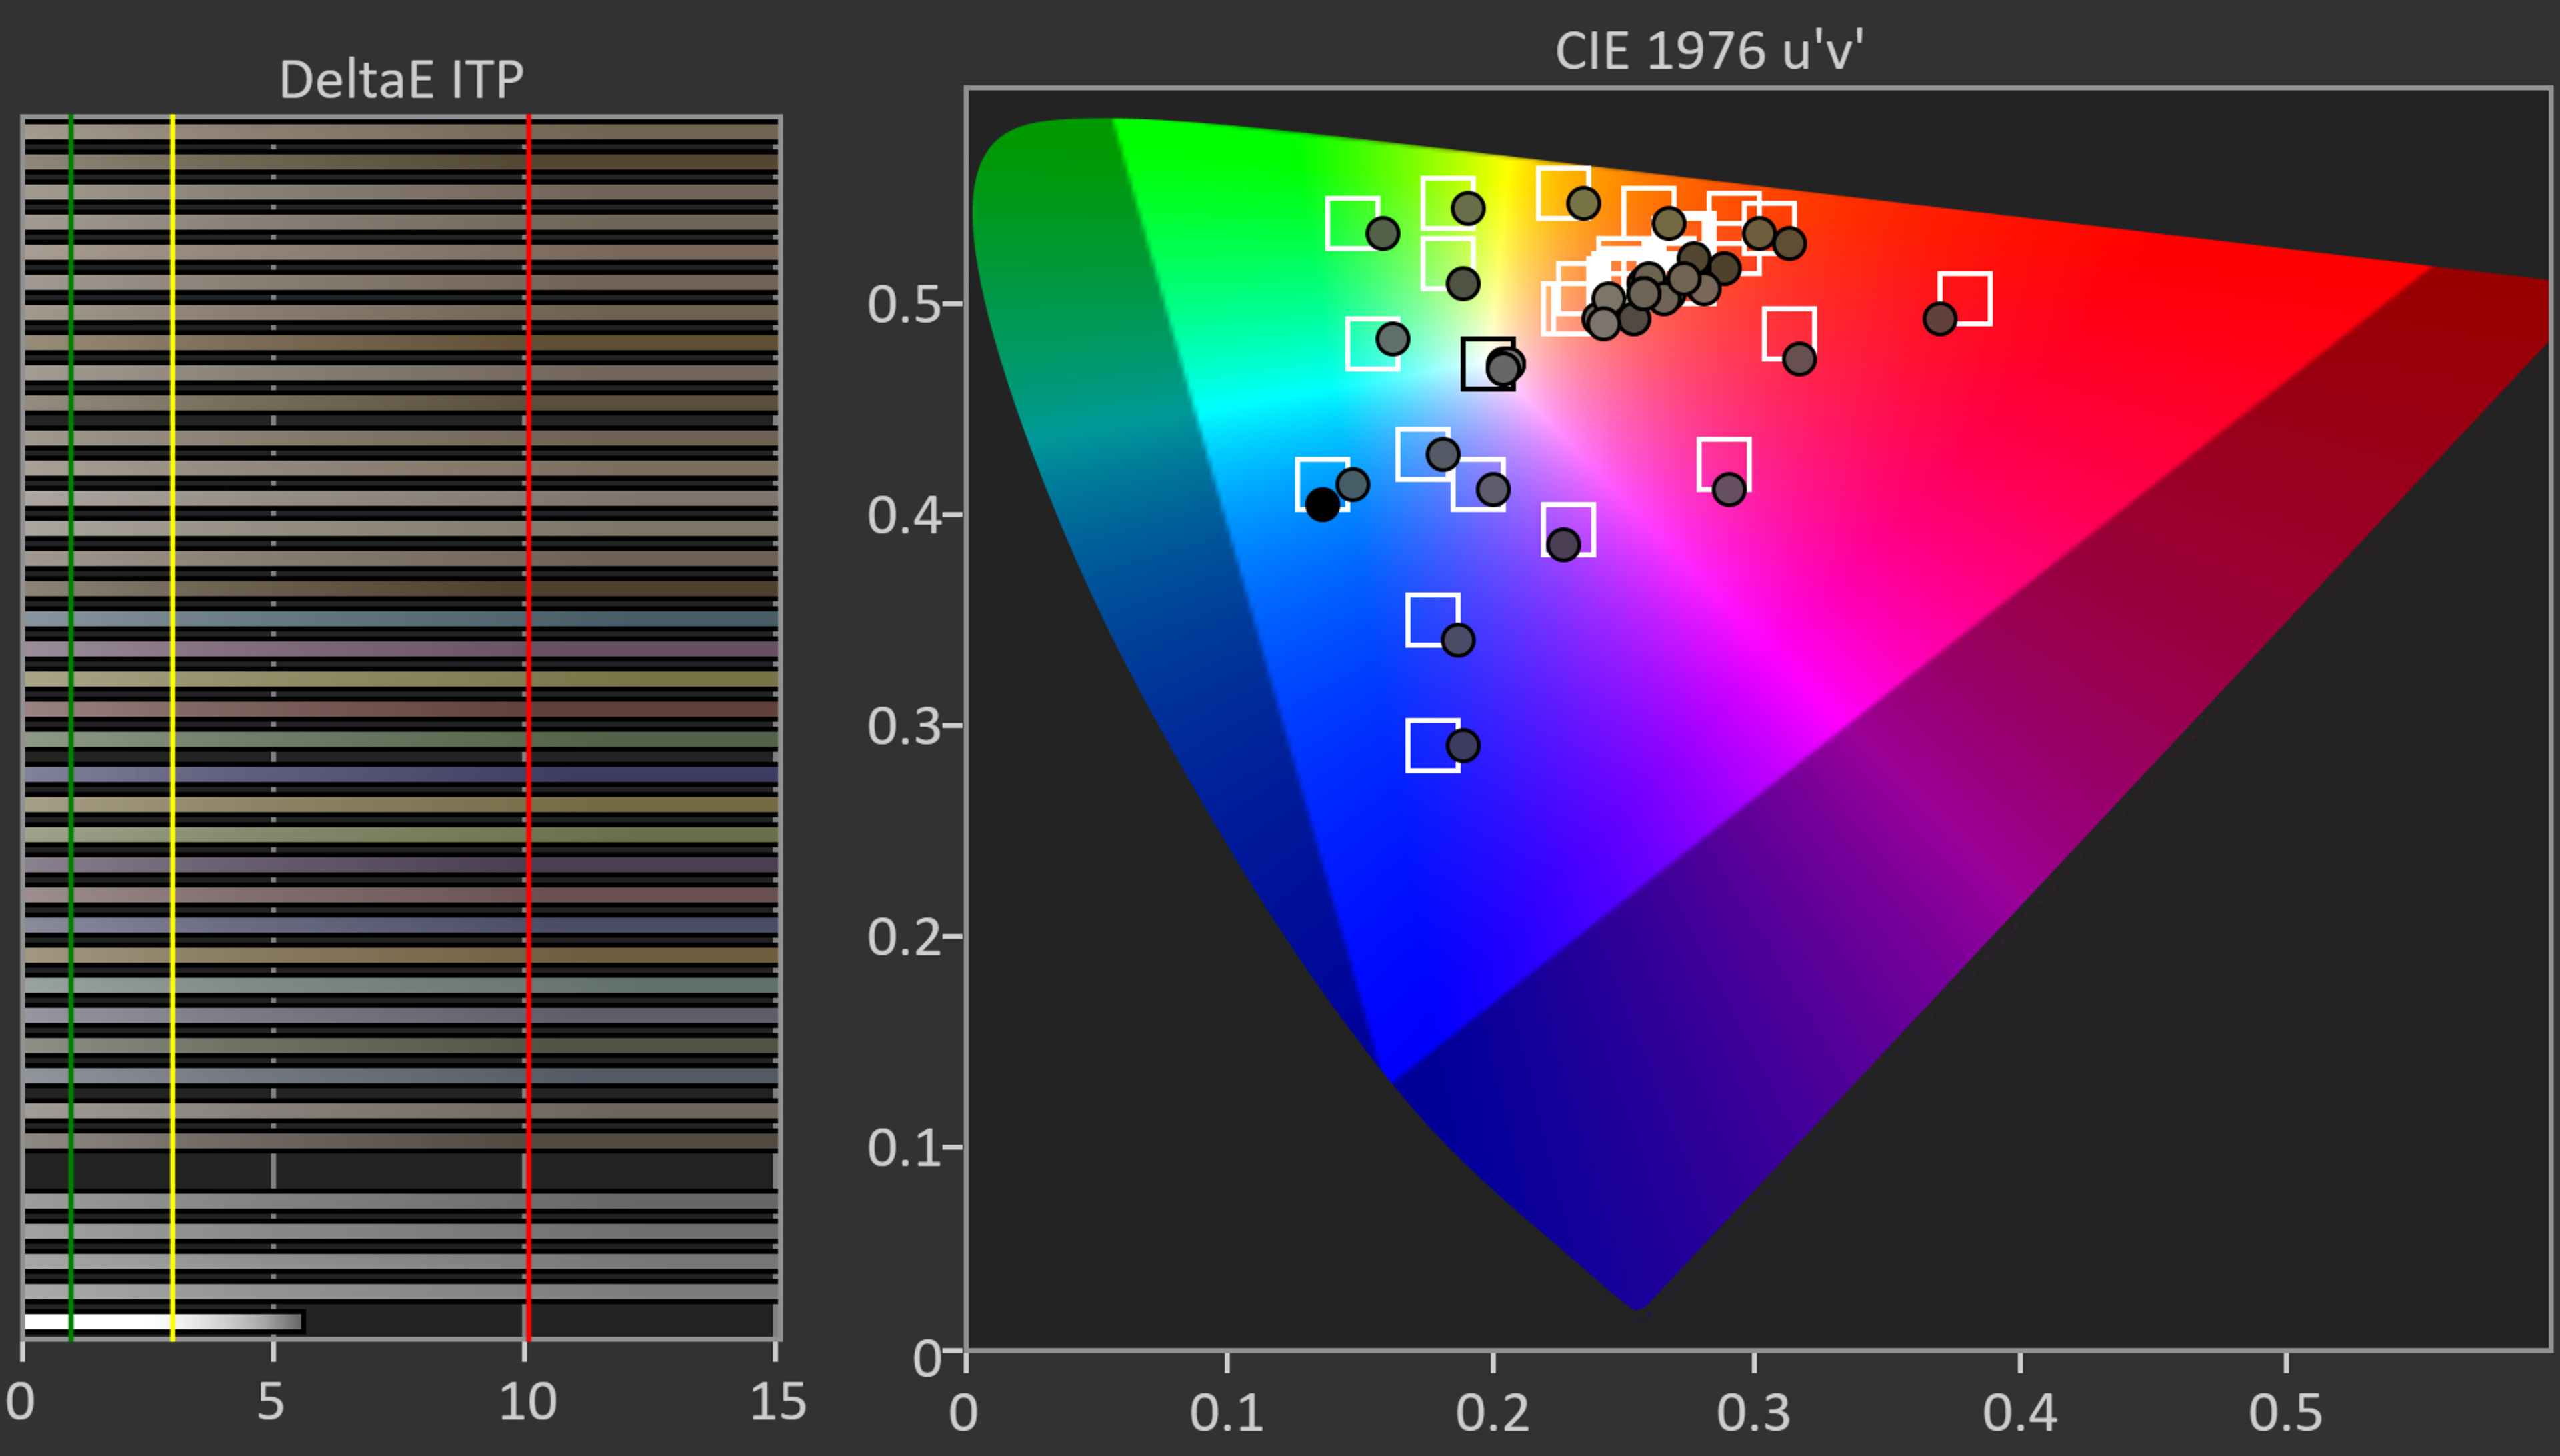
White Balance dE ITP
41.45
Color dE ITP
49.6
Color Temperature
6,308 K
Picture Mode
Movie
HDR Post-Calibration Color Accuracy
7.0
HDR Post White Balance Picture

HDR Post Color Picture
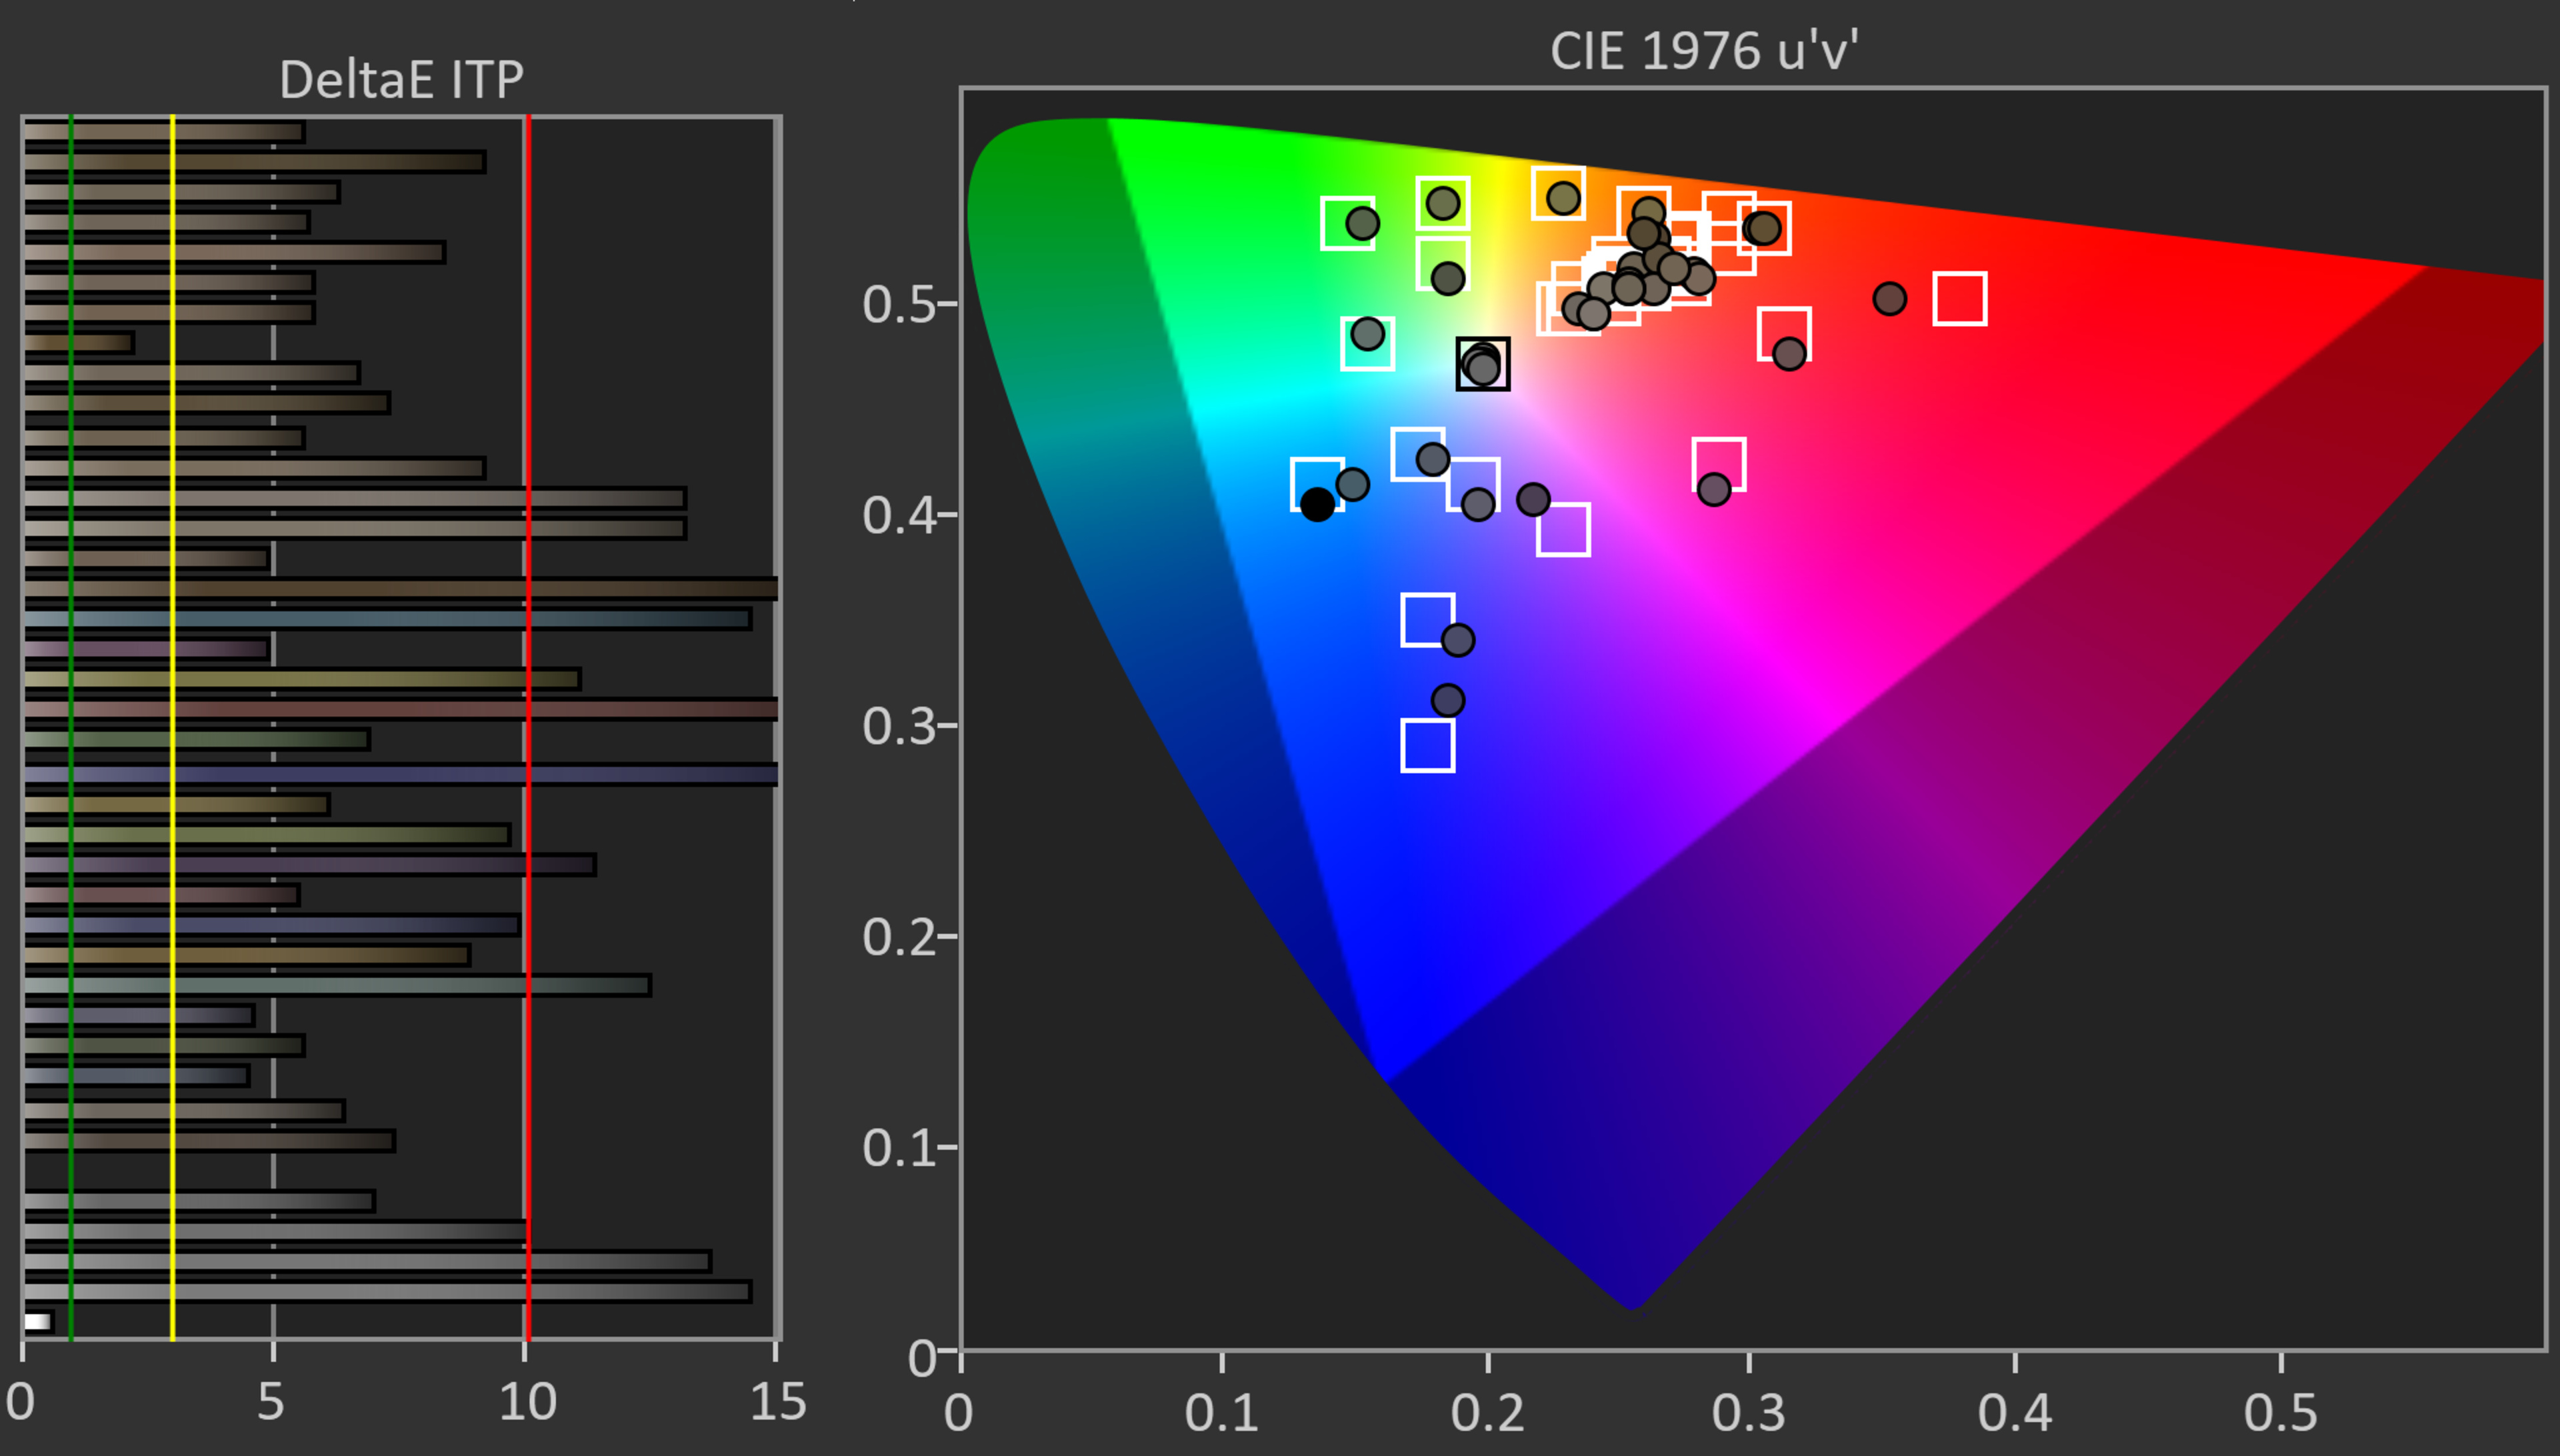
White Balance dE ITP
19.70
Color dE ITP
8.60
Color Temperature
6,276 K
Processing
PQ EOTF Tracking
3.9
PQ EOTF Graph
600 Nit Tracking Delta
0.0313
1000 Nit Tracking Delta
0.0314
4000 Nit Tracking Delta
0.0314
Low-Quality Content Smoothing
8.1
Low-Quality Content Smoothing Picture

Smoothing
8.5
Detail Preservation
7.0
Upscaling: Sharpness Processing
7.5
8.0
Sharpness Picture - 480p


HDR Native Gradient
7.8
8.9
HDR Gradient Picture


100% Black To 50% Gray
6.0
50% Gray To 100% White
6.0
100% Black To 50% Red
8.0
50% Red To 100% Red
10
100% Black To 50% Green
8.0
50% Green To 100% Green
8.0
100% Black To 50% Blue
8.0
50% Blue To 100% Blue
8.0
Game Mode Responsiveness
Input Lag
8.4
9.4
1080p @ 60Hz
14.1 ms
15.4 ms
1080p @ 60Hz Outside Game Mode
125.0 ms
91.1 ms
1080p @ 120Hz
6.1 ms
7.2 ms
1080p @ Max Refresh Rate
8.0 ms
4k @ 60Hz
14.1 ms
15.1 ms
4k @ 60Hz @ 4:4:4
15.0 ms
15.1 ms
4k @ 60Hz Outside Game Mode
124.7 ms
90.9 ms
4k @ 60Hz With Interpolation
116.5 ms
87.2 ms
4k @ 120Hz
5.9 ms
6.7 ms
4k @ Max Refresh Rate
5.0 ms
8k @ 60Hz
N/A
N/A
Supported Resolutions
9.7
9.2
Resolution
4k
4k
480p @ 59.94Hz (Widescreen)
Yes
720p @ 59.94Hz
Yes
1080p @ 60Hz @ 4:4:4
Yes
Yes
1080p @ 120Hz
Yes
Yes (native support)
1080p @ 144Hz
Yes
4k @ 60Hz
Yes
Yes
4k @ 60Hz @ 4:4:4
Yes
Yes
4k @ 120Hz
Yes
Yes (native support)
4k @ 120Hz @ 4:4:4
Yes
4k @ 144Hz
Yes
8k @ 30Hz Or 24Hz
No
No
8k @ 60Hz
No
No
Variable Refresh Rate
8.8
9.4
Native Refresh Rate
144Hz
120 Hz
Variable Refresh Rate
Yes
Yes
HDMI Forum VRR
Yes
Yes
FreeSync
Yes
No
G-SYNC Compatible
Yes
Yes
4k VRR Maximum
144 Hz
120 Hz
4k VRR Minimum
< 20 Hz
< 20 Hz
1080p VRR Maximum
240 Hz
120 Hz
1080p VRR Minimum
< 20 Hz
< 20 Hz
VRR + Local Dimming
Yes
CAD In Game Mode @ Max Refresh Rate
7.5
Pursuit Photo Max Refresh

CAD Heatmap Max Refresh

Transition At Max Refresh

0 to 31

Avg. CAD
173
Best 10% CAD
71
Worst 10% CAD
303
CAD In Game Mode @ 120Hz
6.9
Pursuit Photo 120Hz

CAD Heatmap 120Hz

Transition At 120Hz

0 to 31
Avg. CAD
200
Best 10% CAD
69
Worst 10% CAD
482
CAD In Game Mode @ 60Hz
7.0
Pursuit Photo 60Hz

CAD Heatmap 60Hz

Transition 60Hz

0 to 31
Avg. CAD
217
Best 10% CAD
71
Worst 10% CAD
372
PS5 Compatibility
PS5 Screenshot


Auto Low Latency Mode (ALLM)
Yes
Yes
4k @ 120Hz
Yes
Yes
1440p @ 120Hz
Yes
PS5 can't do 1440p
1080p @ 120Hz
Yes
Yes
HDR
Yes
VRR
Yes
PS5 can't do VRR yet
Xbox Series X|S Compatibility
Xbox Series X Screenshot


Auto Low Latency Mode (ALLM)
Yes
4k @ 120Hz
Yes
Yes
1440p @ 120Hz
Yes
No
1080p @ 120Hz
Yes
Yes
HDR
Yes
VRR
Yes
Yes
Motion Handling
Stutter
6.1
7.0
Frame Hold Time @ 24 fps
36.2 ms
30.5 ms
Frame Hold Time @ 60 fps
11.2 ms
5.5 ms
24p Judder
10
10
Judder-Free 24p
Yes
Yes
Judder-Free 24p via 60p
Yes
Yes
Judder-Free 24p via 60i
Yes
Yes
Judder-Free 24p via Native Apps
Yes
Yes
Response Time
8.1
8.3
Pursuit Photo 60Hz


Response Time Heatmap 60Hz

Transition At 60Hz

0 to 31
First Response Time
5.5 ms
Total Response Time
10.6 ms
Worst 10% Response Time
22.9 ms
Flicker
Backlight chart


Flicker-Free
No
No
PWM Dimming Frequency
30,000 Hz
720 Hz
Black Frame Insertion (BFI)
BFI Picture


BFI Frequency Picture


Optional BFI
Yes
Yes
Min Flicker For 60 fps
60 Hz
120 Hz
60Hz For 60 fps
Yes
No
120Hz For 120 fps
Yes
Yes
Min Flicker For 60 fps In Game Mode
60 Hz
120 Hz
Motion Interpolation
Motion Interpolation (30 fps) Picture


Motion Interpolation (30 fps)
Yes
Yes
Motion Interpolation (60 fps) Picture


Motion Interpolation (60 fps)
Yes
Yes
Reflections
Direct Reflections
6.3
7.3
Ring Light Picture

Direct Reflections Graph
Peak Direct Reflection Intensity
46.5%
Screen Finish
Glossy
Semi-gloss
Ambient Black Level Raise
9.1
Black Level Raise Picture

Bright Room Black Level Raise Graph
Black Luminance @ 0 lx
0.00 cd/m²
Black Luminance @ 1000 lx
0.38 cd/m²
Total Reflected Light
7.8
Bright Room Off Picture


Ring Picture Total Reflection

Total Reflected Light Intensity
12,962% ⋅ pixel
Diffraction Artifacts
Yes
Ambient Color Saturation
8.4
Bright Room Color Volume Graph
Low-Luminance Colors @ 1000 lx
71.72%
Mid-Luminance Colors @ 1000 lx
68.86%
High-Luminance Colors @ 1000 lx
59.50%
Panel
Viewing Angle
6.2
5.5
Viewing Angle Video
Chroma Graph


Color Washout
23°
23°
Hue Graph


Color Shift
31°
25°
Lightness Graph


Brightness Loss
30°
34°
Black Level Raise
18°
16°
Gamma Shift
18°
24°
Gray Uniformity
7.1
8.1
50% Uniformity Picture


50% Std. Dev.
2.225%
2.447%
50% DSE
0.170%
0.155%
5% Uniformity Picture


5% Std. Dev.
0.670%
0.356%
5% DSE
0.093%
0.086%
Panel Technology
Spectral Power Distribution

Pixels Picture
Type
LED
LED
Sub-Type
VA
VA
Subpixel Layout
BGR
Inputs
Input Specifications
Side Inputs Picture


Rear Inputs Picture


HDMI
4 (2x HDMI 2.0, 2x HDMI 2.1)
4
HDMI 2.1 Rated Speed
48 Gbps
Yes (HDMI 3,4)
ATSC Tuner
3.0 (NEXTGEN TV)
USB Ports
3
2
HDR10
Yes
Yes
USB 3.0
Yes (1)
Yes (1)
Audio Out 3.5mm
1
1
HDR10+
Yes
No
Wi-Fi
Yes (2.4 GHz, 5 GHz, 6 GHz)
Yes (2.4 GHz, 5 GHz)
Ethernet Speed
100 Mbps
1
Composite In
1 (Adapter Required, Not Incl.)
1 (adapter required, not incl.)
Dolby Vision
Yes
Yes
Digital Optical Audio Out
1
1
HLG
Yes
Yes
HDMI 2.0 Full Bandwidth
Yes (HDMI 1,2,3,4)
CEC
Yes
HDCP 2.2
Yes (HDMI 1,2,3,4)
Variable Analog Audio Out
Yes
Input Lag
8.4
9.4
1080p @ 60Hz
14.1 ms
15.4 ms
1080p @ 60Hz Outside Game Mode
125.0 ms
91.1 ms
1440p @ 60Hz
15.0 ms
4k @ 60Hz
14.1 ms
15.1 ms
4k @ 60Hz + 10-Bit HDR
15.2 ms
4k @ 60Hz @ 4:4:4
15.0 ms
15.1 ms
4k @ 60Hz Outside Game Mode
124.7 ms
90.9 ms
4k @ 60Hz With Interpolation
116.5 ms
87.2 ms
8k @ 60Hz
N/A
N/A
1080p @ 120Hz
6.1 ms
7.2 ms
1440p @ 120Hz
N/A
4k @ 120Hz
5.9 ms
6.7 ms
1080p with Variable Refresh Rate
N/A
1440p with VRR
N/A
4k with VRR
N/A
8k with VRR
N/A
Audio Passthrough
ARC/eARC Port
eARC
Yes
eARC: Dolby Atmos Over Dolby Digital Plus
Yes
Yes
eARC: Dolby Digital Plus 7.1
Yes
eARC: LPCM 7.1 Over Dolby MAT
Yes
eARC: Dolby TrueHD 7.1
Yes
ARC
Yes (HDMI 3)
eARC: DTS:X Over DTS-HD MA
Yes
Yes
eARC: DTS-HD Master Audio 7.1
Yes
eARC: LPCM Channels (Bitstream)
7.1
ARC: Dolby Digital 5.1
Yes
Yes
ARC: DTS 5.1
Yes
Yes
Optical: Dolby Digital 5.1
Yes
Yes
Optical: DTS 5.1
Yes
Yes
HDR Format Support
HDR10
Yes
Yes
HDR10+
Yes
No
Dolby Vision
Yes
Yes
HLG
Yes
Yes
Supported Resolutions
9.7
9.2
Resolution
4k
4k
1080p @ 60Hz @ 4:4:4
Yes
Yes
1080p @ 120Hz
Yes
Yes (native support)
1440p @ 60Hz
Yes (forced resolution required)
1440p @ 120Hz
No
4k @ 60Hz
Yes
Yes
4k @ 60Hz @ 4:4:4
Yes
Yes
4k @ 120Hz
Yes
Yes (native support)
8k @ 30Hz or 24Hz
No
No
8k @ 60Hz
No
No
Advanced Console Compatibility
PS5 Screenshot
Xbox Series X Screenshot
Auto Low Latency Mode (ALLM)
Yes
Yes
PS5, 4k @ 120Hz + HDR
Yes
PS5, 4k @ 120Hz
Yes
Yes
PS5, 4k @ 60Hz + HDR
Yes
PS5, 1440p @ 120Hz
Yes
PS5 can't do 1440p
PS5, 1080p @ 120Hz
Yes
Yes
PS5, Variable Refresh Rate
Yes
PS5 can't do VRR yet
Xbox Series X, 4k @ 120Hz + HDR
Yes
Xbox Series X, 4k @ 120Hz
Yes
Yes
Xbox Series X, 4k @ 60Hz + HDR
Yes
Xbox Series X, 1440p @ 120Hz
Yes
No
Xbox Series X, 1080p @ 120Hz
Yes
Yes
Xbox Series X, Variable Refresh Rate
Yes
Yes
Input Photos
Side Inputs Picture
Rear Inputs Picture
Total Inputs
HDMI
4 (2x HDMI 2.0, 2x HDMI 2.1)
4
USB
3
2
Digital Optical Audio Out
1
1
Analog Audio Out 3.5mm
1
1
Analog Audio Out RCA
0
Component In
0
Composite In
1 (Adapter Required, Not Incl.)
1 (adapter required, not incl.)
Tuner (Cable/Ant)
1
Ethernet
100 Mbps
1
DisplayPort
0
IR In
1
SD/SDHC
0
Design
Style
Design Picture
Curved
No
No
Accelerated Longevity Test
Uniformity Pictures

Month 24
50% Gray
Longevity Graph
Stand
Stand Picture


Back
Back Picture


Wall Mount
VESA 400x400
VESA 300x300
Borders
Borders Picture


Borders
0.31" (0.8 cm)
0.35" (0.9 cm)
Thickness
Thickness Picture


Max Thickness
2.28" (5.8 cm)
2.80" (7.1 cm)
Build Quality
8.5
8.0
Build quality picture


Smart Features
Interface
Smart TV Picture


Smart OS
Google TV
Android TV
Version
12
9.0
Ease of Use
Average
Smoothness
Very Smooth
Time Taken to Select YouTube
2 s
Time Taken to Change Backlight
2 s
Advanced Options
Many
Ad-Free
0.0
0.0
Ads Picture

Ads
Yes
Yes
Opt-out
No
No
Suggested Content in Home
Yes
Yes
Opt-out of Suggested Content
No
Yes
Apps and Features
9.0
Apps Picture

App Selection
Great
App Smoothness
Very Smooth
Cast Capable
Yes
USB Drive Playback
Yes
USB Drive HDR Playback
Yes
HDR in Netflix
Yes
HDR in YouTube
Yes
Remote
Remote Picture


Size
Large
Voice Control
Yes
Many Features
CEC Menu Control
Yes
Other Smart Features
No
Remote App
Android TV
TV Controls
Controls Picture


Mute Switch
Yes
In The Box
In The Box Picture


Misc
Power Consumption
66 W
48 W
Power Consumption (Max)
307 W
145 W
Firmware
V8-T653T02-LF1V085
PKG6.0132.0031NAA
Sound Quality
Frequency Response
7.0
7.3
Frequency Response
Low-Frequency Extension
75.51 Hz
95.14 Hz
Std. Dev. @ 70
3.92 dB
2.62 dB
Std. Dev. @ 80
3.60 dB
2.69 dB
Std. Dev. @ Max
4.90 dB
5.01 dB
Max
87.3 dB SPL
94.1 dB SPL
Dynamic Range Compression
4.74 dB
4.58 dB
Digital Room Correction
Yes
Distortion
5.8
Total Harmonic Distortion
Weighted THD @ 80
0.047
Weighted THD @ Max
9.938
IMD @ 80
6.18%
IMD @ Max
47.09%
Picture Quality
Contrast
8.9
8.6
Checkerboard Picture
Native Contrast
6,515 : 1
4,267 : 1
Contrast with local dimming
201,150 : 1
5,386 : 1
SDR Brightness
9.5
8.2
Real Scene Peak Brightness
1,108 cd/m²
474 cd/m²
Peak 2% Window
4,043 cd/m²
423 cd/m²
Peak 10% Window
3,355 cd/m²
462 cd/m²
Peak 25% Window
3,291 cd/m²
604 cd/m²
Peak 50% Window
1,767 cd/m²
530 cd/m²
Peak 100% Window
940 cd/m²
466 cd/m²
Sustained 2% Window
2,320 cd/m²
420 cd/m²
Sustained 10% Window
3,238 cd/m²
457 cd/m²
Sustained 25% Window
3,171 cd/m²
598 cd/m²
Sustained 50% Window
1,761 cd/m²
529 cd/m²
Sustained 100% Window
938 cd/m²
465 cd/m²
Automatic Brightness Limiting (ABL)
0.060
0.020
Local Dimming
7.5
LD Video, Moving Object
LD Video, Real Content
LD Video, Real Content Side View
Local Dimming
Yes
Yes
Backlight
Full-Array
Full-Array
Local Dimming In Game Mode
7.5
LD Video, Moving Object
LD Video, Real Content
LD Video, Real Content Side View
Local Dimming
Yes
Backlight
Full-Array
HDR Brightness
9.4
6.9
EOTF

Real Scene Highlight
543 cd/m²
Peak 2% Window
2,564 cd/m²
358 cd/m²
Peak 10% Window
3,467 cd/m²
447 cd/m²
Peak 25% Window
3,338 cd/m²
736 cd/m²
Peak 50% Window
1,814 cd/m²
677 cd/m²
Peak 100% Window
967 cd/m²
545 cd/m²
Sustained 2% Window
2,497 cd/m²
356 cd/m²
Sustained 10% Window
3,319 cd/m²
446 cd/m²
Sustained 25% Window
3,253 cd/m²
723 cd/m²
Sustained 50% Window
1,810 cd/m²
673 cd/m²
Sustained 100% Window
965 cd/m²
544 cd/m²
Automatic Brightness Limiting (ABL)
0.060
0.041
HDR Brightness In Game Mode
9.4
7.5
Game Mode EOTF

Real Scene Highlight
669 cd/m²
Peak 2% Window
4,167 cd/m²
471 cd/m²
Peak 10% Window
3,425 cd/m²
550 cd/m²
Peak 25% Window
3,366 cd/m²
746 cd/m²
Peak 50% Window
1,796 cd/m²
608 cd/m²
Peak 100% Window
956 cd/m²
531 cd/m²
Sustained 2% Window
2,384 cd/m²
469 cd/m²
Sustained 10% Window
3,300 cd/m²
540 cd/m²
Sustained 25% Window
3,251 cd/m²
731 cd/m²
Sustained 50% Window
1,792 cd/m²
607 cd/m²
Sustained 100% Window
953 cd/m²
530 cd/m²
Automatic Brightness Limiting (ABL)
0.060
0.023
Gray Uniformity
7.1
8.1
50% Uniformity Picture
50% Std. Dev.
2.225%
2.447%
50% DSE
0.170%
0.155%
5% Uniformity Picture
5% Std. Dev.
0.670%
0.356%
5% DSE
0.093%
0.086%
Black Uniformity
8.9
8.8
Native Black Uniformity Picture
Native Std. Dev.
0.569%
0.558%
Black Uniformity Picture with Local Dimming
Std. Dev. w/ L.D.
0.154%
1.390%
Viewing Angle
6.2
5.5
Viewing Angle Video
Chroma Graph
Color Washout
23°
23°
Hue Graph
Color Shift
31°
25°
Lightness Graph
Brightness Loss
30°
34°
Black Level Raise
18°
16°
Gamma Shift
18°
24°
Reflections
6.3
7.3
Reflections Picture

Average Room Off Picture

Bright Room Off Picture
Screen Finish
Glossy
Semi-gloss
Total Reflections
5.4%
Indirect Reflections
0.8%
Calculated Direct Reflections
4.6%
Pre Calibration
7.5
8.7
Pre White Balance Picture
Pre Gamma Curve Picture
Pre Color Picture
White Balance dE
3.36
1.73
Color dE
2.07
1.89
Gamma
2.09
2.23
Color Temperature
6,127 K
6,460 K
Picture Mode
Movie
Custom
Color Temp Setting
Warm -5
Expert 1
Gamma Setting
2.2
0
Post Calibration
9.6
9.2
Post White Balance Picture
Post Gamma Curve Picture
Post Color Picture
White Balance dE
0.24
0.54
Color dE
0.82
1.70
Gamma
2.20
2.20
Color Temperature
6,483 K
6,509 K
White Balance Calibration
20 point
10 point
Color Calibration
Yes
No
480p Input
7.5
8.0
480p Picture
720p Input
8.0
720p Picture

1080p Input
9.0
1080p Picture

4k Input
10
4k Picture

8k Input
0.0
8k Picture
Pixels
Pixels Picture
Type
LED
LED
Sub-Type
VA
VA
Color Gamut
7.9
Wide Color Gamut
Yes
Color Gamut DCI-P3 Picture

DCI P3 xy
87.31%
DCI P3 uv
93.11%
Color Gamut Rec.2020 Picture

Rec 2020 xy
63.98%
Rec 2020 uv
71.22%
Color Volume
9.0
7.2
P3 Color Volume ITP Picture
Normalized DCI P3 Coverage ITP
76.1%
10,000 cd/m² DCI P3 Coverage ITP
85.2%
31.0%
2020 Color Volume ITP Picture
Normalized Rec 2020 Coverage ITP
66.6%
10,000 cd/m² Rec 2020 Coverage ITP
54.8%
26.5%
Gradient
7.8
8.9
Gradient Picture
Color Depth
10 Bit
Red (Std. Dev.)
0.077
Green (Std. Dev.)
0.095
Blue (Std. Dev.)
0.071
Gray (Std. Dev.)
0.084
Temporary Image Retention
10
Image Retention Picture

IR after 0 min recovery
0.00%
IR after 2 min recovery
0.00%
IR after 4 min recovery
0.00%
IR after 6 min recovery
0.00%
IR after 8 min recovery
0.00%
IR after 10 min recovery
0.00%
Permanent Burn-In Risk
10
Permanent Burn-In Risk
No
Motion
Response Time
8.1
8.3
Motion Blur Picture
Response Time Chart

80% Response Time
4.0 ms
100% Response Time
11.2 ms
Flicker-Free
0.0
9.5
Backlight chart
Flicker-Free
No
No
PWM Dimming Frequency
30,000 Hz
720 Hz
Black Frame Insertion (BFI)
0.0
6.0
BFI Picture
BFI Frequency Picture
Optional BFI
Yes
Yes
Min Flicker For 60 fps
60 Hz
120 Hz
60Hz For 60 fps
Yes
No
120Hz For 120 fps
Yes
Yes
Min Flicker for 60 fps in Game Mode
60 Hz
120 Hz
Motion Interpolation
Motion Interpolation (30 fps) Picture
Motion Interpolation (30 fps)
Yes
Yes
Motion Interpolation (60 fps) Picture
Motion Interpolation (60 fps)
Yes
Yes
Stutter
6.1
7.0
Frame Hold Time @ 24 fps
36.2 ms
30.5 ms
Frame Hold Time @ 60 fps
11.2 ms
5.5 ms
24p Judder
10
10
Judder-Free 24p
Yes
Yes
Judder-Free 24p via 60p
Yes
Yes
Judder-Free 24p via 60i
Yes
Yes
Judder-Free 24p via Native Apps
Yes
Yes
Variable Refresh Rate
8.8
9.4
Native Refresh Rate
144Hz
120 Hz
Variable Refresh Rate
Yes
Yes
HDMI Forum VRR
Yes
Yes
FreeSync
Yes
No
G-SYNC Compatible
Yes
Yes
4k VRR Maximum
144 Hz
120 Hz
4k VRR Minimum
< 20 Hz
< 20 Hz
1080p VRR Maximum
240 Hz
120 Hz
1080p VRR Minimum
< 20 Hz
< 20 Hz
1440p VRR Maximum
1440p VRR Minimum
Unknown
VRR Supported Connectors
HDMI
Check Price
55"
55"
XBR55X900H
SEARCH
Amazon.com65"
65QM851G
SEE PRICE
Amazon.com65"
XBR65X900H
SEARCH
Amazon.com75"
75QM851G
SEE PRICE
Amazon.com75"
XBR75X900H
SEARCH
Amazon.com85"
85QM851G
SEE PRICE
Amazon.com85"
XBR85X900H
SEE PRICE
Amazon.com98"
98QM851G
SEE PRICE
Amazon.com98"
TCL QM8/QM851G QLED
Sony X900H
Comments
TCL QM8/QM851G QLED vs Sony X900H: Main Discussion
What do you think of our picks? Let us know below by starting a discussion.
Looking for a personalized buying advice from the RTINGS.com experts? Insiders have direct access to buying advice on our insider forum.