Beyond the Marketing
How Projectors Really Perform in Terms of Brightness & Contrast
We've tested 35 projectors (and counting), including typical home theater projectors, portable laser projectors, and ultra-short throw projectors. Initially, our primary observation from these tests was that, for the most part, projectors can't keep up with anything but budget TVs regarding brightness levels and contrast ratios. How does this translate into the user experience? As it turns out, we've learned that the numbers don't tell the whole story.
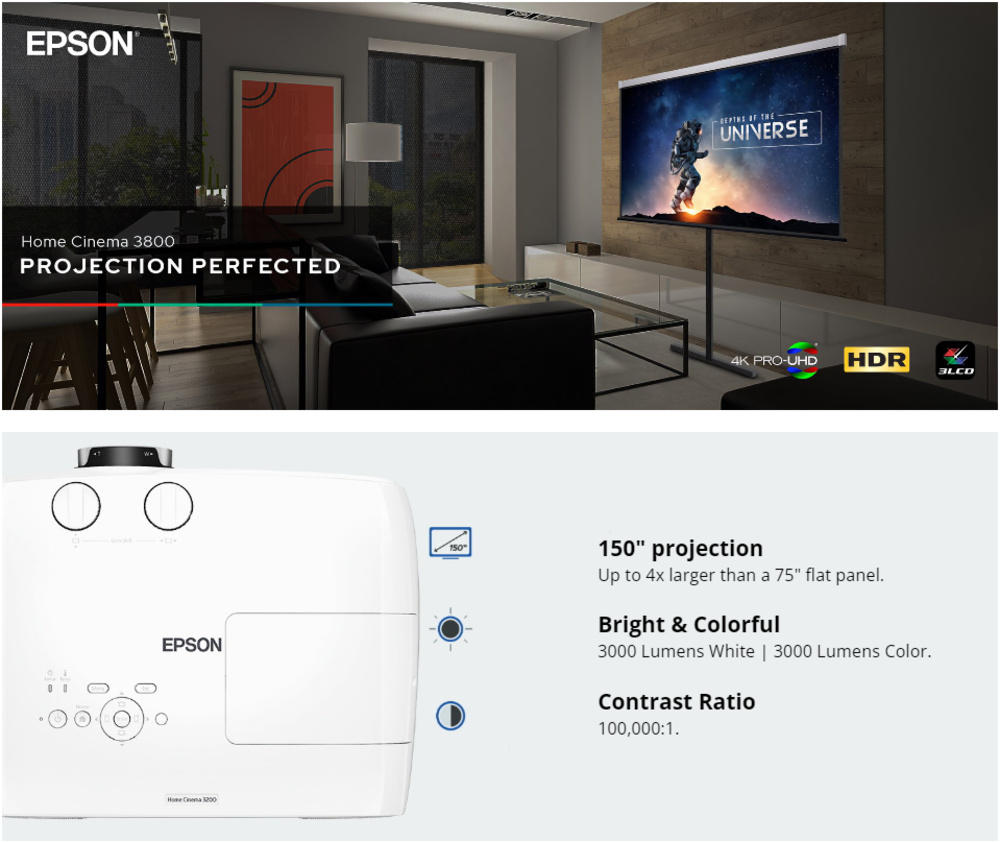
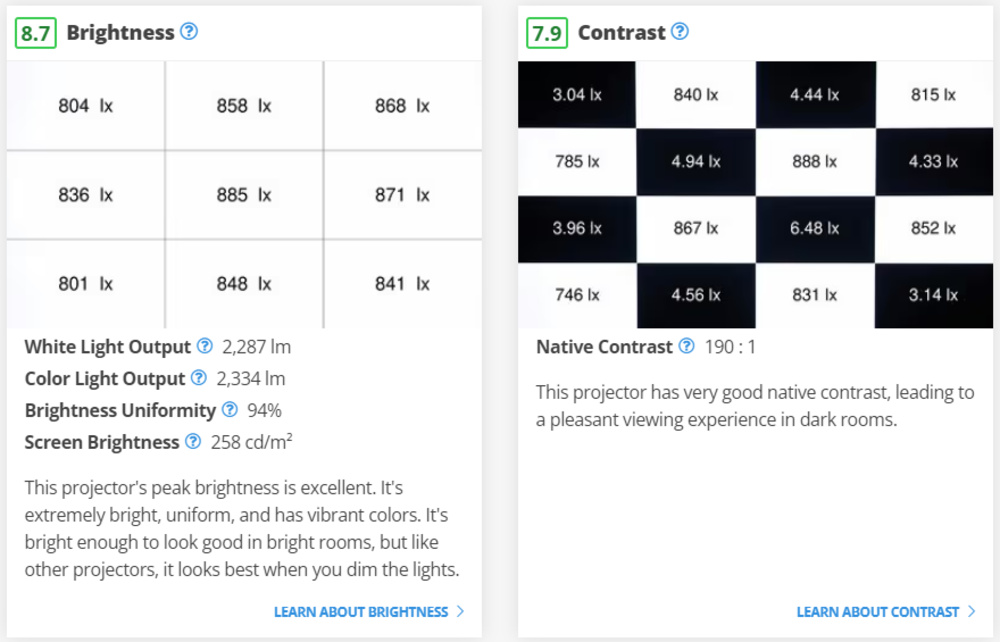
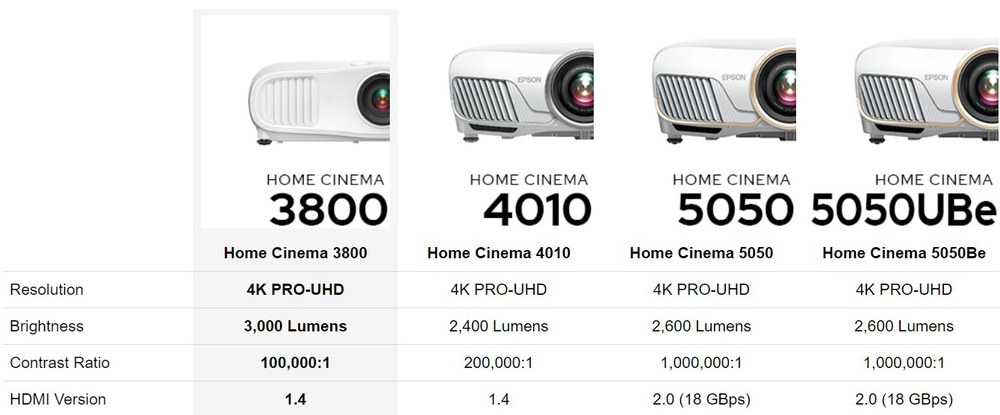
Marketing claims ended up being what we found to be most contentious during our testing. Simply put, outside of very specific use conditions, you cannot expect most projectors to deliver the level of performance their advertising states they do. The list of examples is long. Why does a projector like the Epson Home Cinema 3800, one of the best we've tested so far, advertise a brightness of 3000 lumens with a 100 000:1 contrast ratio while we only measure ~2300 lumens in our test setup and a contrast ratio of 190:1?
|
Product sheet of the Epson Home Cinema 3800 (source: Epson)
|
|
Our test results for brightness and contrast of the Epson Home Cinema 3800
|
By reading this article, you'll see the big picture regarding projector brightness and contrast and how the marketing surrounding them is often deceptive. We aim to get you the right information about projectors to enable you to make an informed purchase decision.
Lumens: Are You Actually Getting What's Advertised?
Before we get into the nitty-gritty about projector brightness marketing and how it actually (or, more accurately, doesn't) translate to real-world user experiences, some knowledge about projector brightness, including the difference between illuminance and illuminance and ANSI lumens, is required. If you're a lumen-savvy enthusiast, skip to the next section.
Some Context On Projector Brightness
TVs vs. projectors: the difference between illuminance and luminance
If you have no idea how to compare a projector's brightness output to a TV or any other emissive display, fret not; we were in the same boat when we started developing our projector test bench. What's a lumen anyway, and more importantly, how many nits (cd/m²) is it?
|
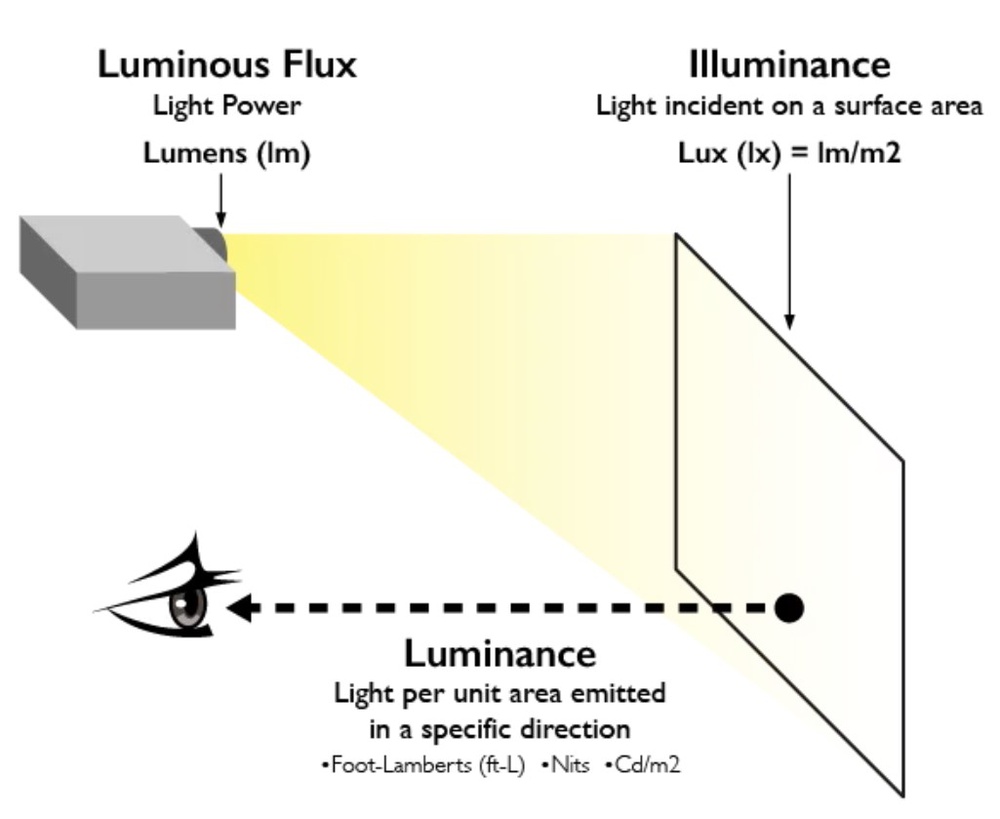
The answer is a little frustrating. You can't directly convert ANSI lumens to nits since they measure two completely different things: illuminance and luminance. A TV's brightness is measured in luminance (nits or cd/m²) because you're looking at the light source itself, which is constrained within a fixed area. Manufacturers don't use luminance for a projector, with good reason: it's a meaningless metric without context. We can measure luminance by taking a reading of the image being displayed on the projection screen, but its value will only be representative of the testing environment and equipment used. The figure to the right shows the difference between luminance and illuminance. |
Illuminance vs. luminance (source: BenQ)
|
ANSI lumens
The main driving factor behind the purchase of a projector over a TV is their ability to display content in larger sizes. A projector delivering a high amount of lumens is key to doing so. There's no way around it for projectors: the larger the image you display, the lower the screen brightness (luminance) since the light source is fixed no matter how small or large you make the image. It's one of the reasons that manufacturers don't rate their projectors' brightness output in terms of luminance but rather illuminance—the amount of light that falls on a surface per unit area.
The most widely used units are ANSI lumens, the standard unit for measuring light output from projectors as specified by the ANSI standard IT7.228-1997. Testing and calculating ANSI lumens is a straightforward process, allowing for a quick and efficient comparison of projectors in brightness.
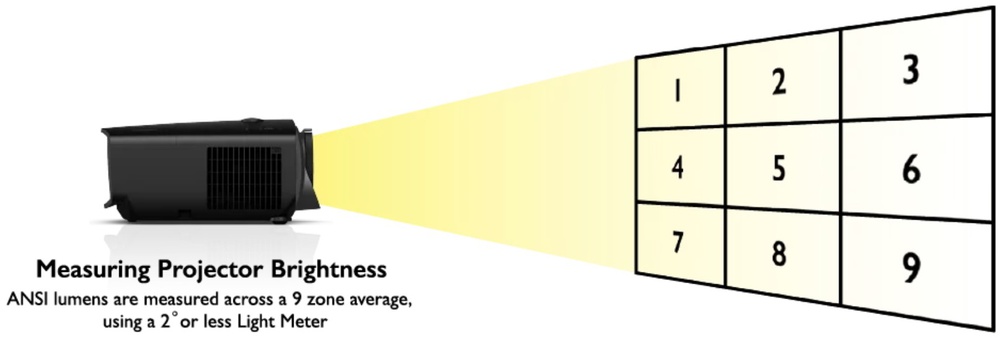
To calculate ANSI lumens, one needs to use an illuminance meter, take measurements in nine predefined areas, average them, and multiply them by the screen area; it's as simple as that! The picture below demonstrates how ANSI lumens are measured:
A word of caution: it's essential to remain vigilant when a projector has its brightness quoted in lux or "LED lumens," as these values are essentially meaningless. They do not indicate how much light is projected from the lens but rather how much light is emitted at the source inside the projector before all the internal losses occur.
But wait, can ANSI lumens be converted to nits?
How do lumens translate to brightness? Simply put, there's no definitive answer without context, as the luminance in nits will be relative to the projected image size and the projection surface. It's possible to get reference values as long as the projectors are tested in the same setup, which is, fortunately, exactly what we do!
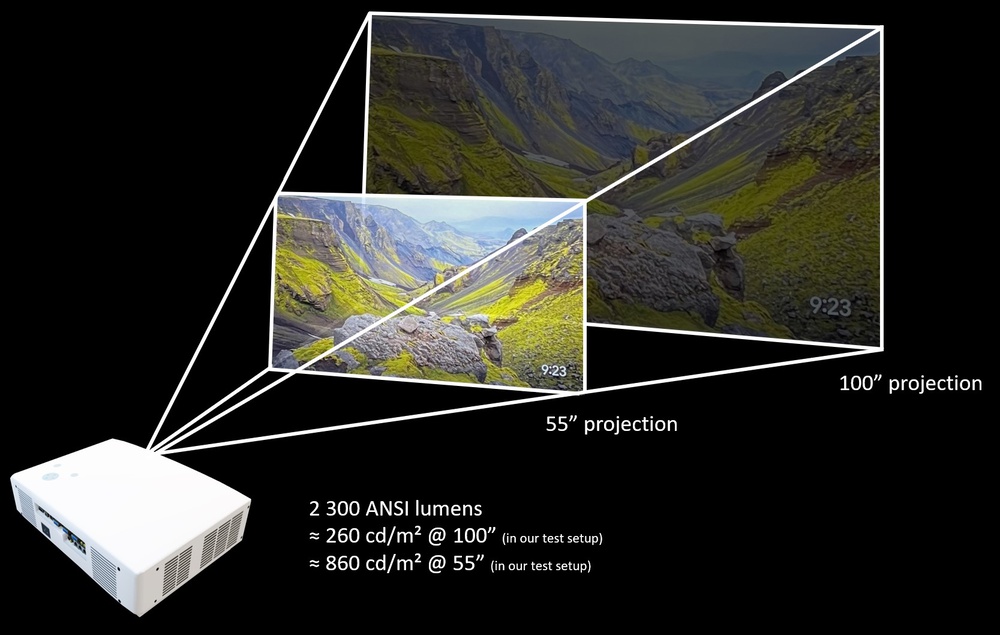
For example, our Epson Home Cinema 3800 delivers ~2300 ANSI lumens of light once calibrated. In our test environment, it gets insanely bright over a 55" projection size (~860 nits), and we still measured a solid 260 nits when projecting a 100" image. On a side note, while one could argue that 260 cd/m² is not as bright as most TVs, it's plenty bright for a projector, especially considering the impact of having such a large surface area with that brightness level.
Why you want high ANSI lumen figures
As we saw above, a projector with high ANSI lumen figures can be very bright even at large projection sizes (100"+). But what does it look like for smaller, less powerful projectors like portable models?
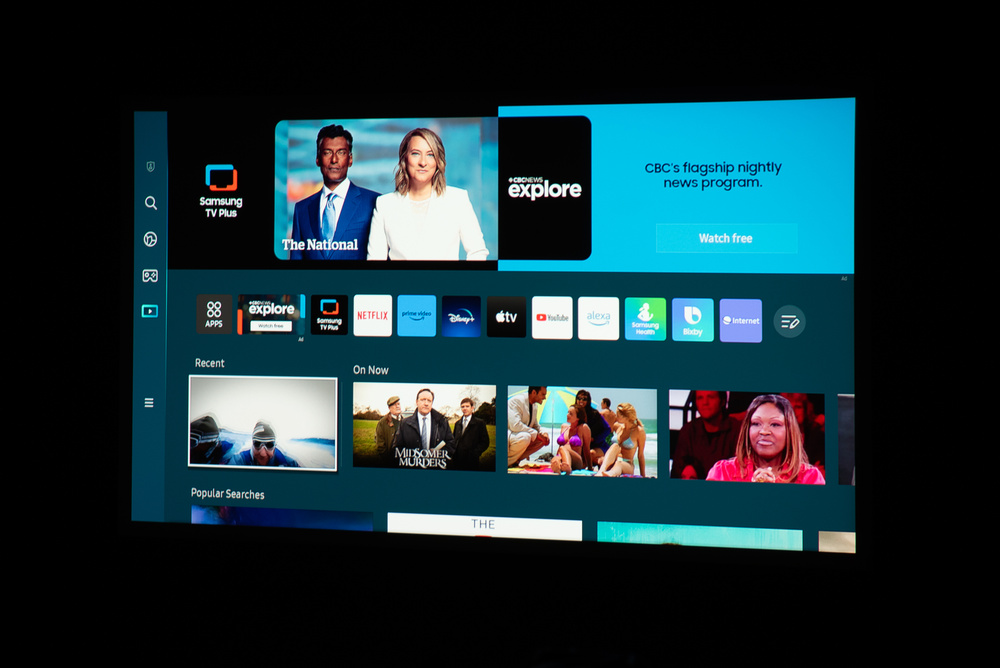
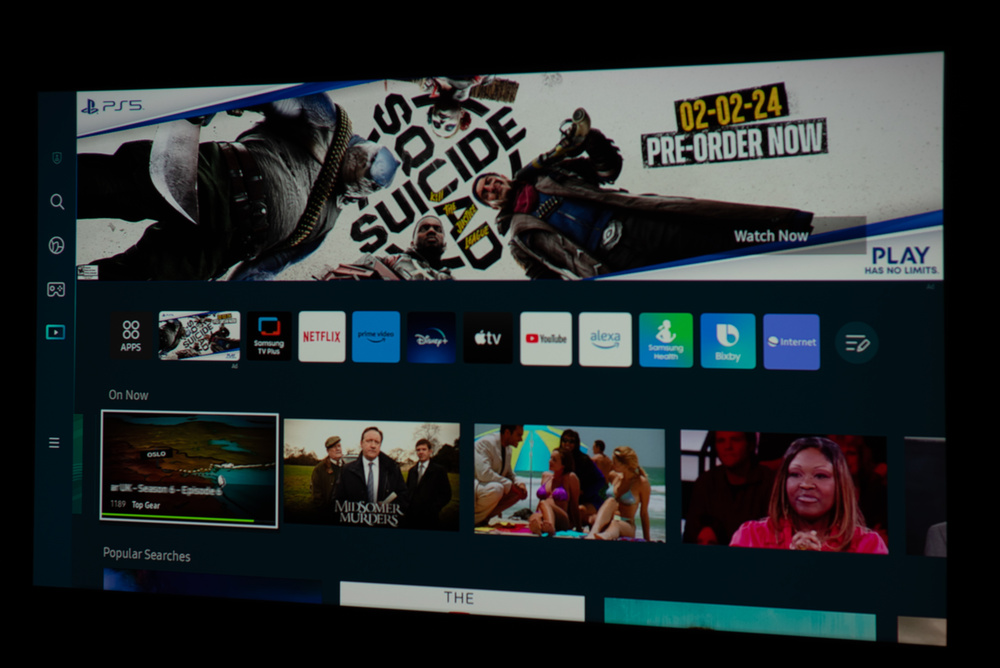
Below are photos of the Samsung The Freestyle 2nd Gen in our test environment using constant camera settings. The projector only has about 175 ANSI lumens once calibrated in our test setup. Samsung's marketing claims that this device is "…capable of projecting screens from 30 up to an incredible 100 inches in size," so we decided to take measurements at 55" and 100" projection sizes as we did for the more powerful Epson projector.
On the left, we measured a white brightness of ~64 cd/m² on a 55" projection, while we only got ~19.5 cd/m² on a 100" projection. It's bright in a dark environment for smaller projection sizes, but as you can see, using it for a 100" projection may push it a little, even in an ideal environment.
|
Samsung The Freestyle 2nd Gen projecting a 55" image in our testing room
|
Samsung The Freestyle 2nd Gen projecting a 100" image in our testing room
|
Here's our rule-of-thumb guide about how many ANSI lumens we recommend to get an acceptable picture quality for different projection sizes and viewing environments:
| ANSI lumen output | Dark viewing environments | Brighter viewing environments |
| < 500 | Small images (≤75") | Unusable beyond very small image sizes |
| 500 - 1000 | Standard image sizes (100 ~ 120") | Medium image sizes (≤85") |
| 1000 - 2000 | Large image sizes (100"+) | Standard image sizes (100 ~ 120") |
| > 2000 | Large image sizes (100"+) | Large image sizes (100"+) |
Brightness Marketing Vs. Reality
Where brightness marketing starts to get creative
Understandably, we don't expect many people in the projector market to be looking to project small image sizes like the 55" we've tested the Samsung Freestyle 2nd Gen with. At larger projection sizes, less powerful projectors, like most portable models on the market, simply can't produce a bright image, and this is where we saw our first disconnect between marketing and reality.
From what we've seen, this is rather widespread across the industry. It's all too common to see small portable projectors as being suspiciously bright when projecting a large image, even with some ambient light on!
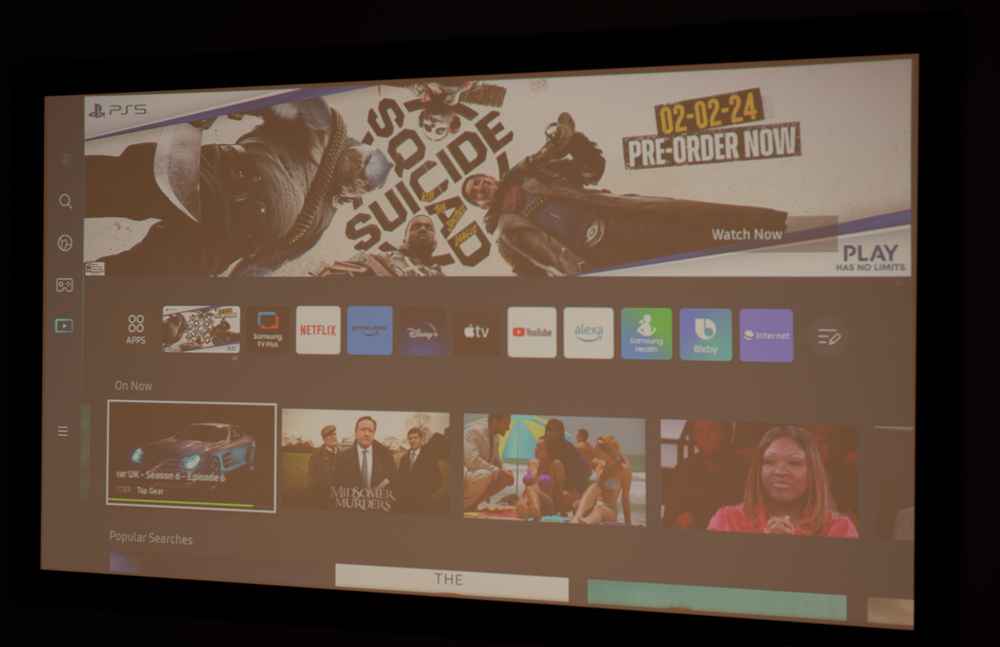
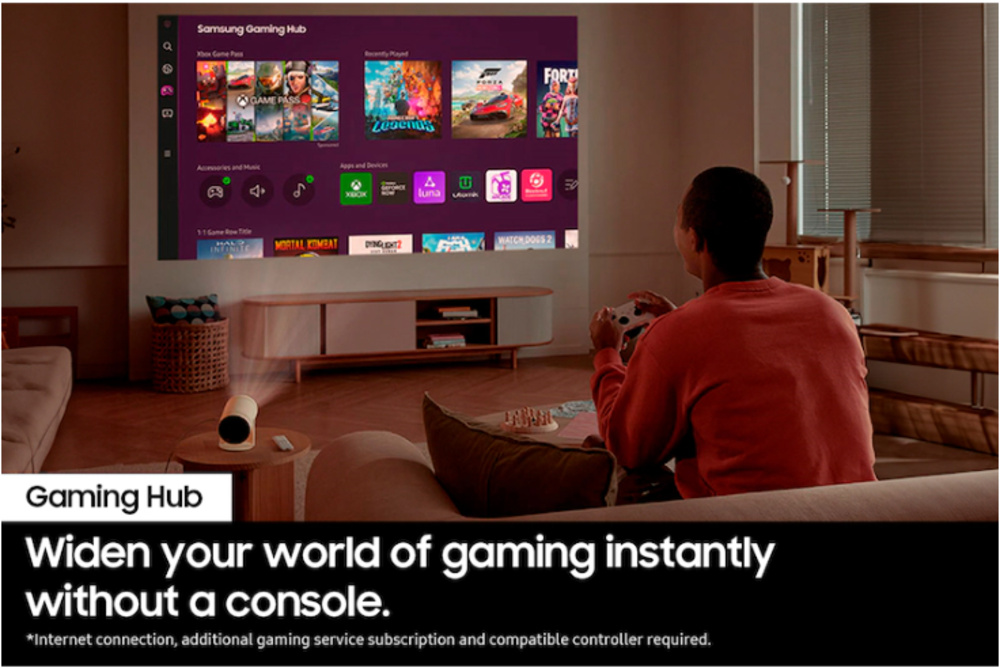
We decided to see how the Freestyle 2nd Gen would look if we added some ambient light in our testing room by turning on ceiling lights in the back of our room, and we'll let you be the judge on how it compares to the marketing online as shown in the pictures below.
|
The Freestyle 2nd Gen projecting a 100" image in our testing room (rear ceiling lights on)
|
The Freestyle 2nd Gen as shown on its product page (source: Samsung)
|
|
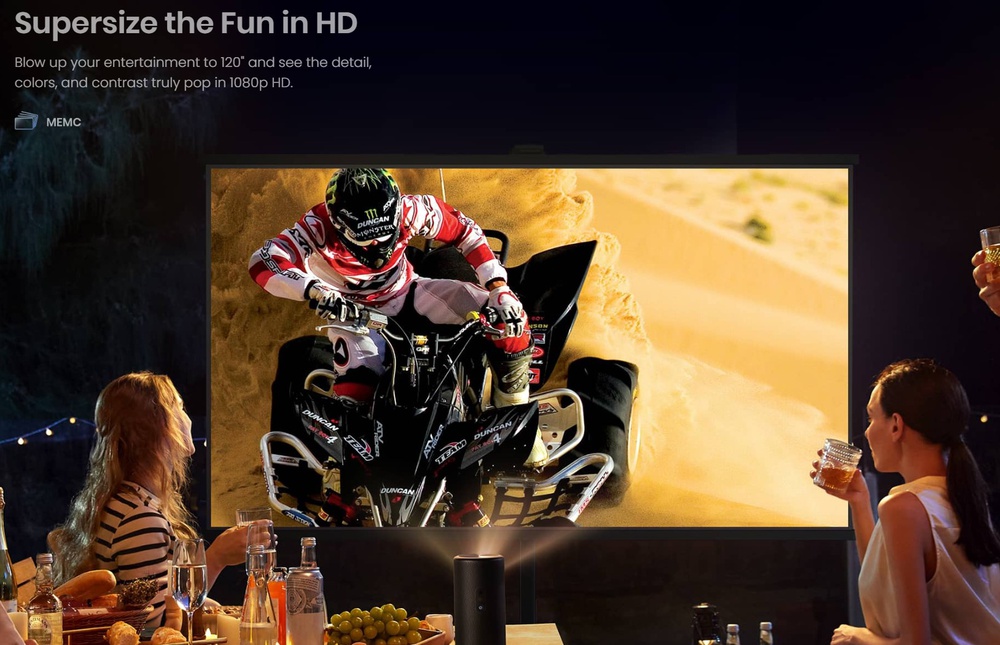
Although we've shown results from using the Freestyle 2nd Gen for this article, we could have used almost any other portable projector on the market and achieved similar results. As a matter of fact, here's what the marketing on Anker's product page for the Nebula Capsule 3 looks like. We measured its lumen output at ~210 lm once calibrated (only about 35 more than the Freestyle 2nd gen). As you can imagine, it would look significantly different if projecting a 120" image as shown in the simulated image if it were in a similar setup in the real world. |
The Nebula Capsule 3 as shown on its product page (source: Anker)
|
|
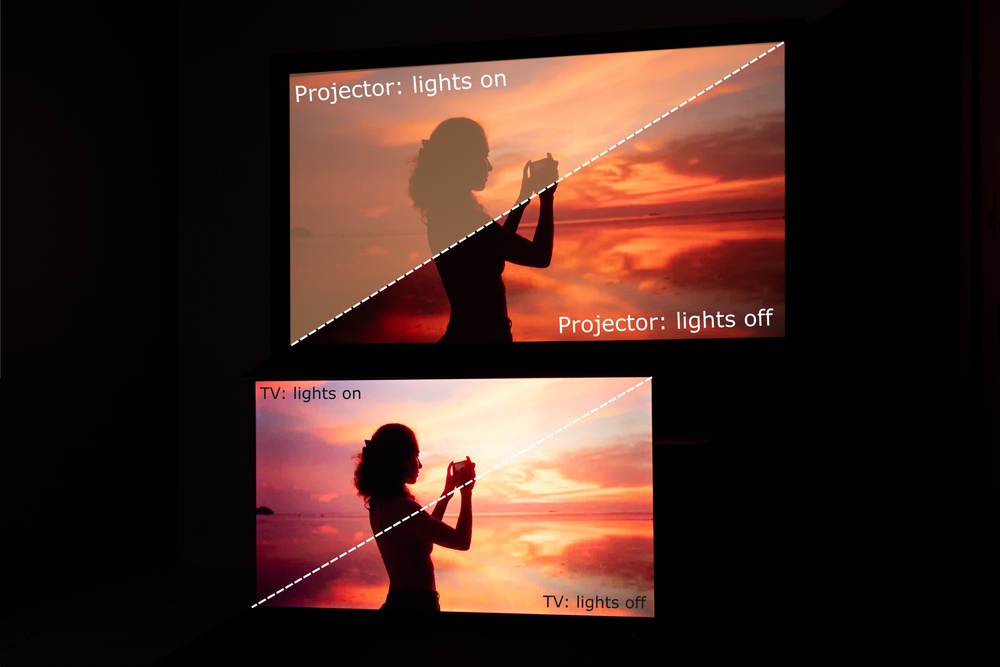
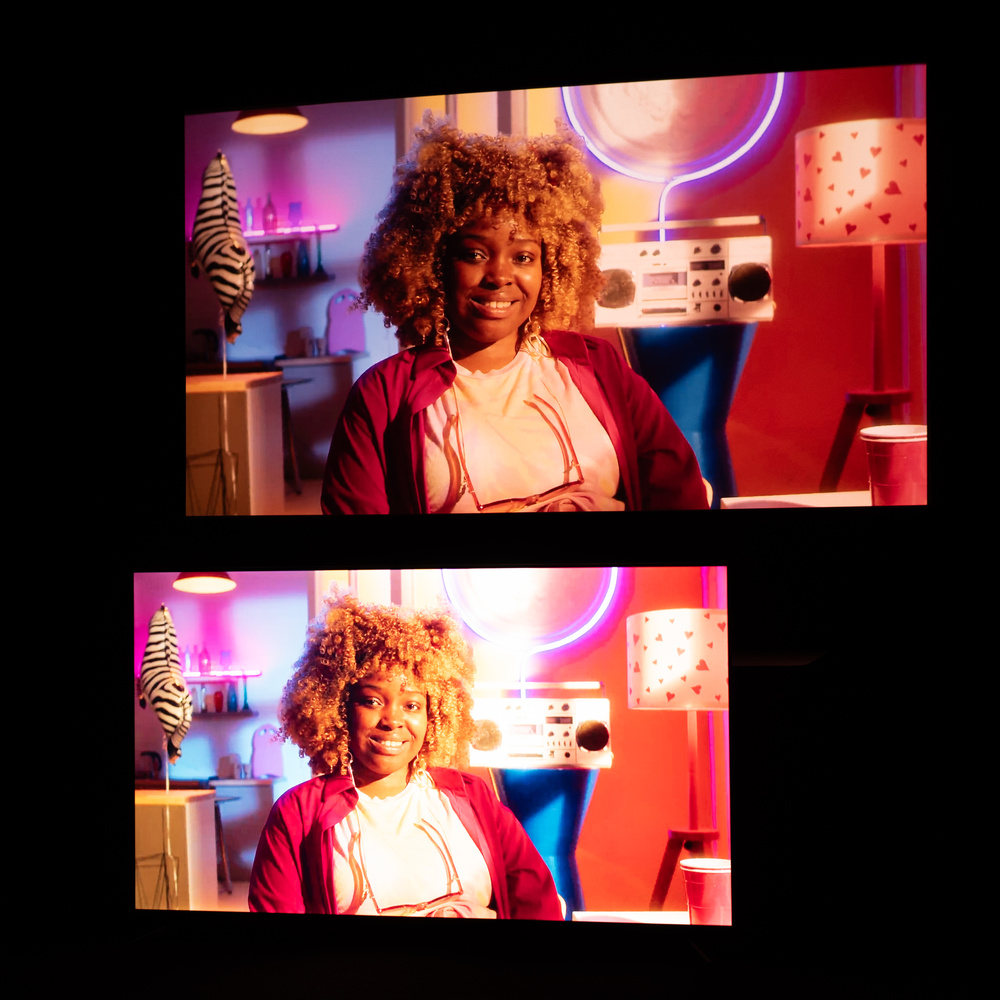
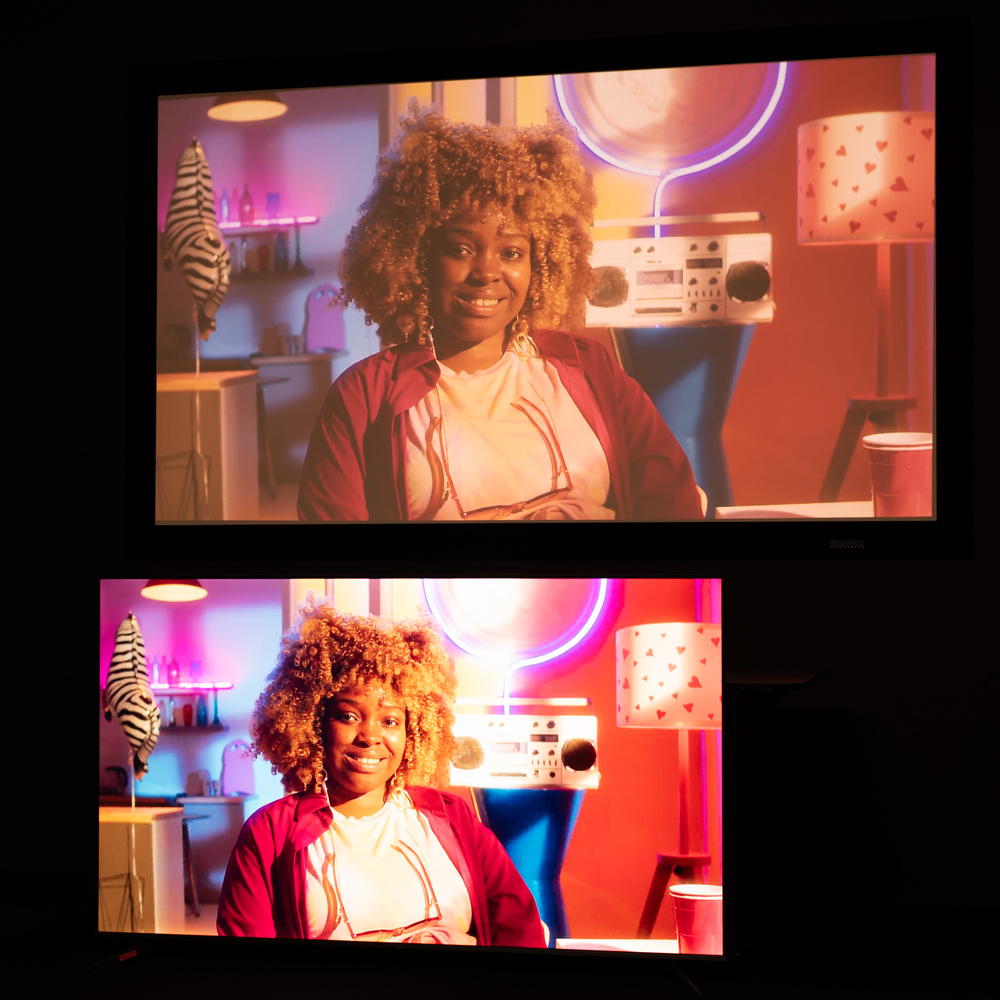
Beyond the brightness, you've likely noticed that the contrast is also substantially better in the marketing picture than what we obtained in our setup (we'll get to this a bit later). It's worth mentioning that by design, emissive displays are much less phased by ambient light than projectors, as seen in the example to the right of the Hisense PX1-PRO projector vs. the TCL 65" Q650G. The picture is a composite of two pictures: one was taken with all lights off in our testing room, while the other had the rear ceiling lights on, like in the picture of the Freestyle 2nd Gen shown above. |
Hisense PX1-PRO projector vs. TCL 65" Q650G (with and without ambient light)
|
You Likely Won't Experience The Stated ANSI Lumen Values
ANSI lumens aren't the same for every picture mode
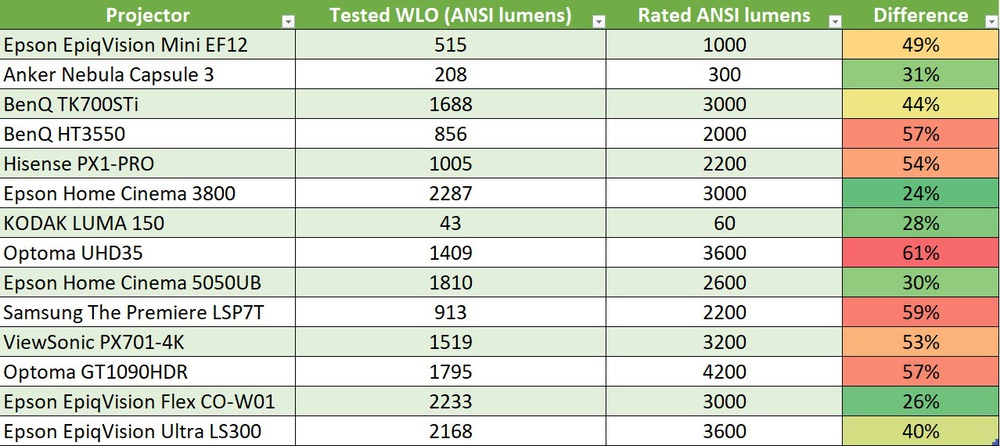
Manufacturers specify a projector's light output in its brightest picture mode, which is typically the least accurate (e.g., Vivid, etc.). Unfortunately, this means that when such a mode is available on a projector, no brightness information is given about the most accurate uncalibrated picture mode of a projector. It's one thing to be bright but another to accurately display colors. The drop in performance can be significant, especially after calibration. Here is the difference between the rated ANSI lumen output of projectors and our measured output in the most accurate mode, post calibration:
|
Table of tested WLO (ANSI lumens) compared to the values quoted by manufacturers
|
As we do for TVs, we test our projectors after calibrating them in their most accurate picture mode out of the box. The key takeaway to keep in mind is that the ANSI lumen specification doesn't reflect its performance if picture quality and color accuracy are important to you.
ANSI lumen figures can be optimized to the detriment of color light output
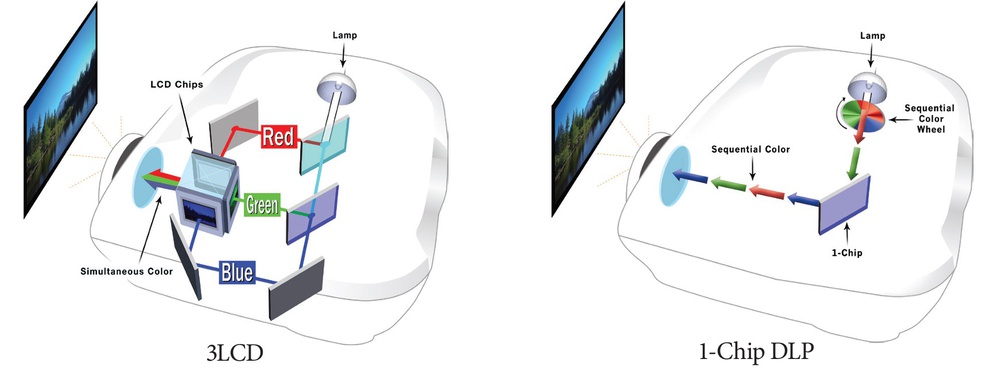
ANSI lumens are great but come with a big caveat: they only account for white light output (WLO). This would be fine if projectors all used the same imaging technology, as they'd all have the same limitations. LCD projectors typically have a color light output (CLO) that matches their WLO. On the other hand, many projectors using single-chip DLP (digital light processing) technology in combination with a color wheel commonly see CLO values far below that of their WLO due to design choices. The following diagram shows a simplified overview of a 3LCD projector compared to a single-chip DLP projector using a color wheel.
Please note: not all single-chip DLP projectors use a color wheel.
|
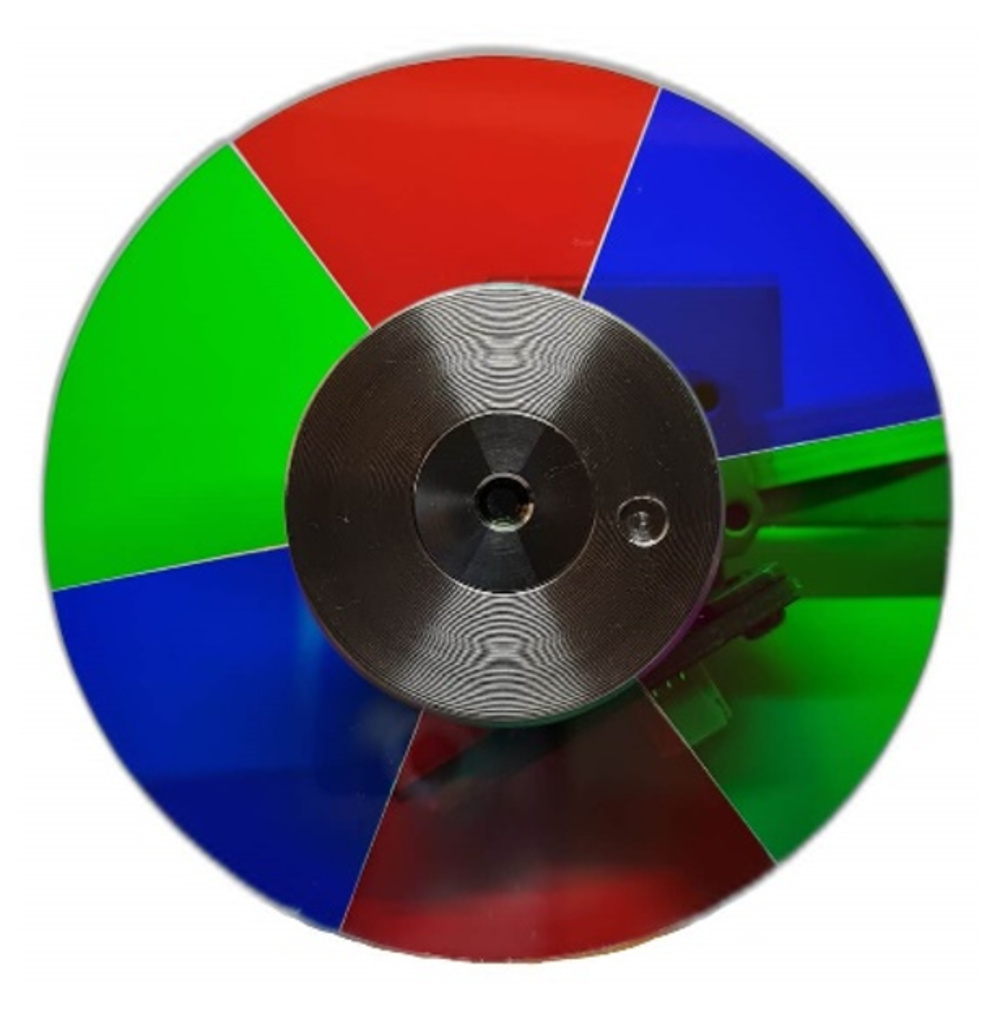
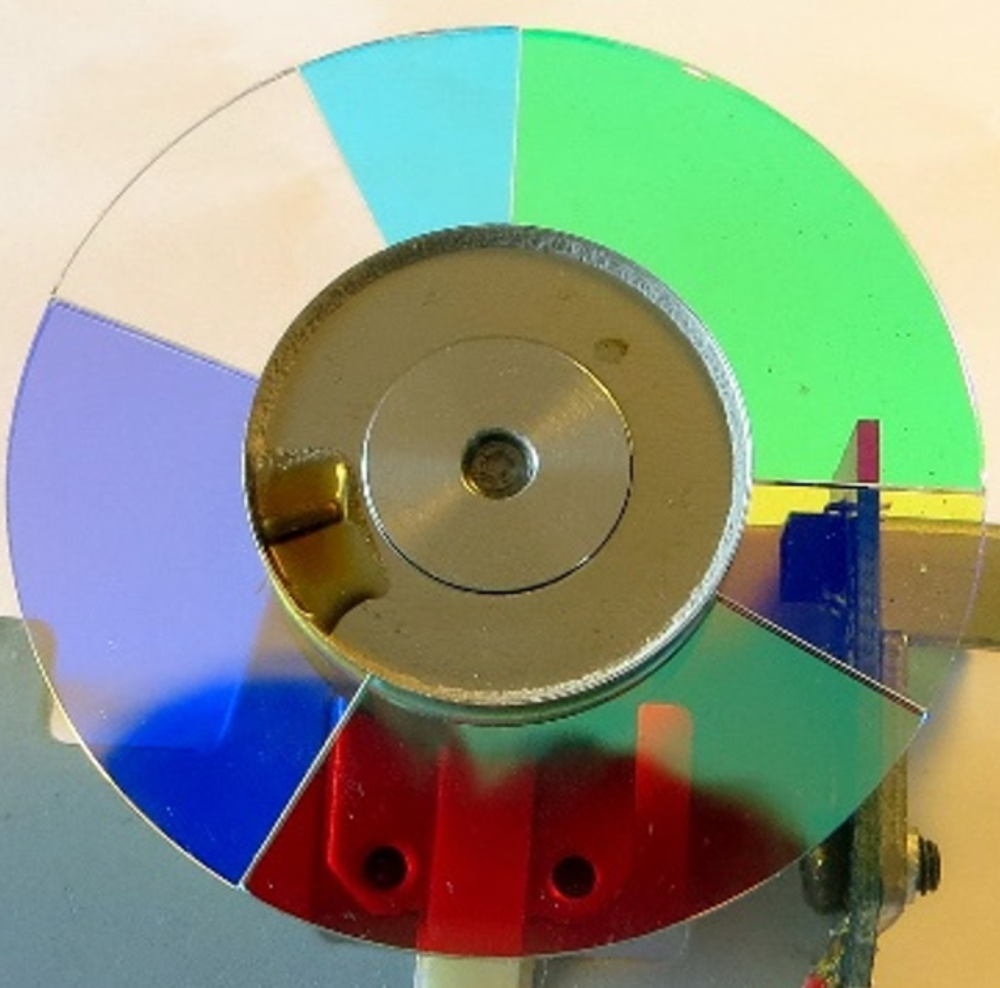
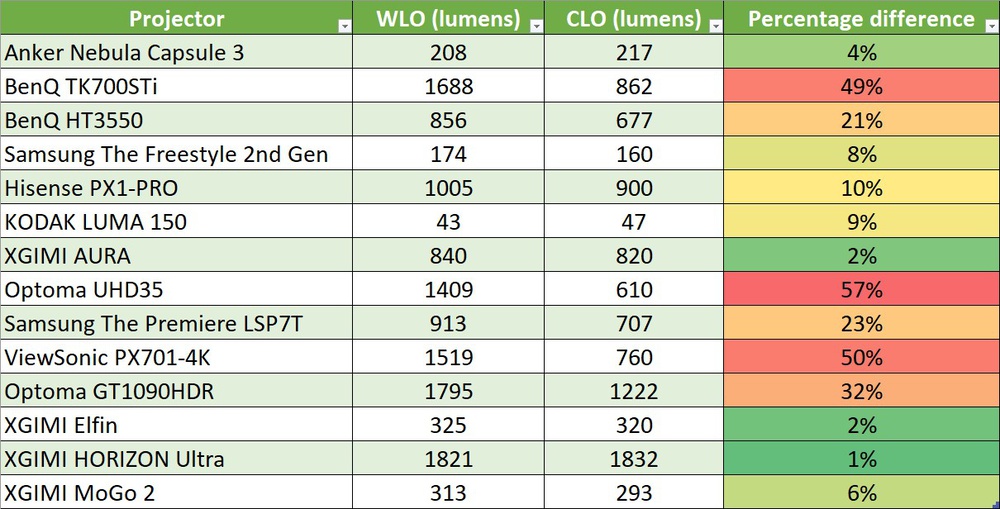
The color wheels used to generate the colors in most single-chip DLP projectors became very interesting to us, as manufacturers can add additional colors past the required RGB channels. A transparent section on color wheels will often be used to boost white light output. This is beneficial to the overall brightness of the picture, but it essentially lowers the projector's CLO relative to its WLO, resulting in dimmer, less vivid colors than you would get if the CLO were equal to the WLO. Although we're sticking to projectors for this article, what you can do by adding a white subcomponent to a DLP color wheel is akin to the addition of a white subpixel in WOLED TVs. Although they can match a QD-OLED's white light emission, they lag behind in terms of individual red, green, and blue light emissions. Below are examples of an RGB color wheel and a color wheel that adds transparent (white), cyan, and yellow subcomponents. Due to various design implementations in DLP projectors, like using color wheels and adding additional non-RGB filters, we sometimes observe significant differences between the WLO and CLO of some DLP projectors. The results of our measurements on DLP projectors are below. Note that some variation is expected because of measurement accuracy considerations, especially since 27 measurements are taken to calculate the CLO. |
RGB color wheel
RGB + white, cyan & yellow color wheel
|
|
Table showing white light output (WLO) compared to color light output (CLO) for select DLP projectors we've tested.
|
One thing to remember regarding ANSI lumens is that they don't tell the whole story about a projector's brightness output. Looking at both WLO and CLO is key to determining how bright a projector is and how it will perform across a broad range of content.
Contrast: If You Can't Beat Them, Join Them!
Contrast is where things get very tricky for projectors, as the contrast ratio they deliver is entirely relative outside of a specialized test lab. Like for brightness, some general knowledge about how projector contrast ratios are measured and quoted in the industry is required to understand why contrast marketing is overwhelmingly deceptive.
Background Information: ANSI, FOFO, And Dynamic Contrast ratios
|
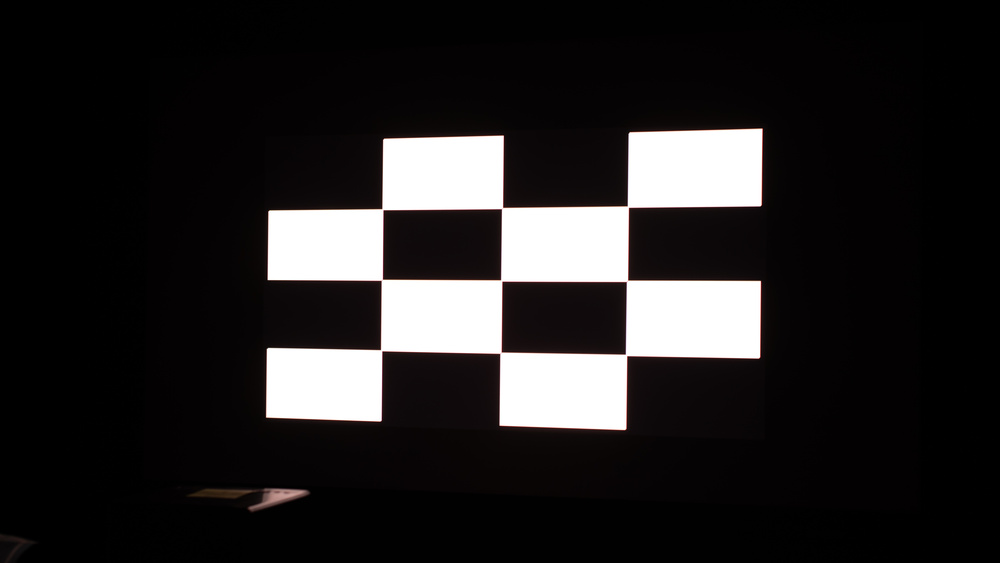
The most stringent contrast ratio for projectors is ANSI contrast, which gives you the projector's performance on a 50% APL checkerboard. ANSI contrast is much lower than any other reported contrast value manufacturers usually list on their projector specification sheets. To give you an idea, Barco, a leading manufacturer of high-end projectors, states, "A projector with an ANSI contrast of 1000:1 is an exceptionally good projector." So, seeing contrast above 1000:1 for consumer projectors is a big hint that the stated value isn't ANSI contrast. |
ANSI contrast checkerboard (50% APL)
|
|
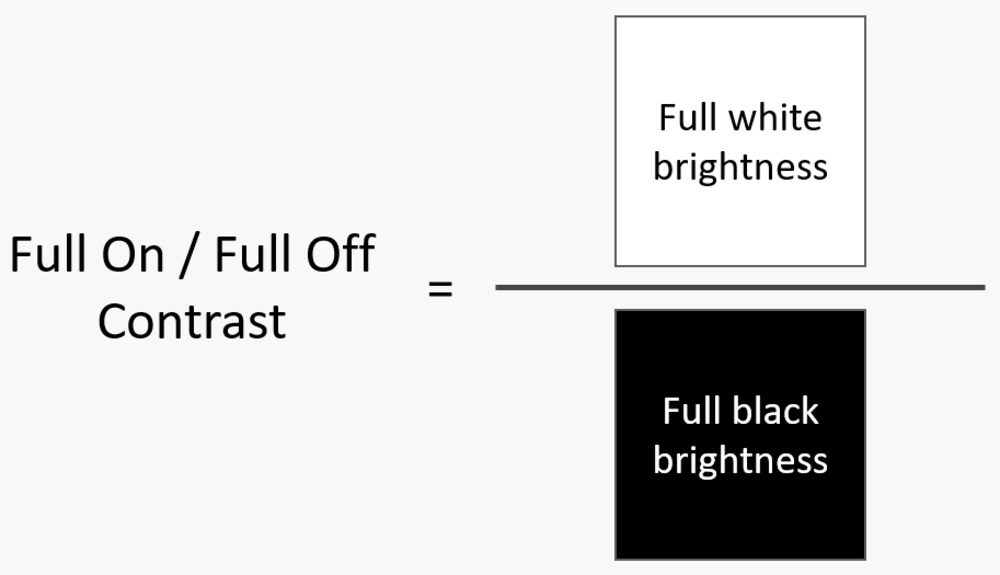
Full On / Full Off contrast is the ratio between the brightness of a solid white reflected image from a projector and the brightness of a solid black reflected image from the same projector, as shown in the figure to the right. A projector having a FOFO contrast of 2500:1 means that the solid white image is 2500x brighter than the solid black image. FOFO contrast values can be very high even without the aid of contrast-boosting features. |
FOFO contrast measurement framework
|
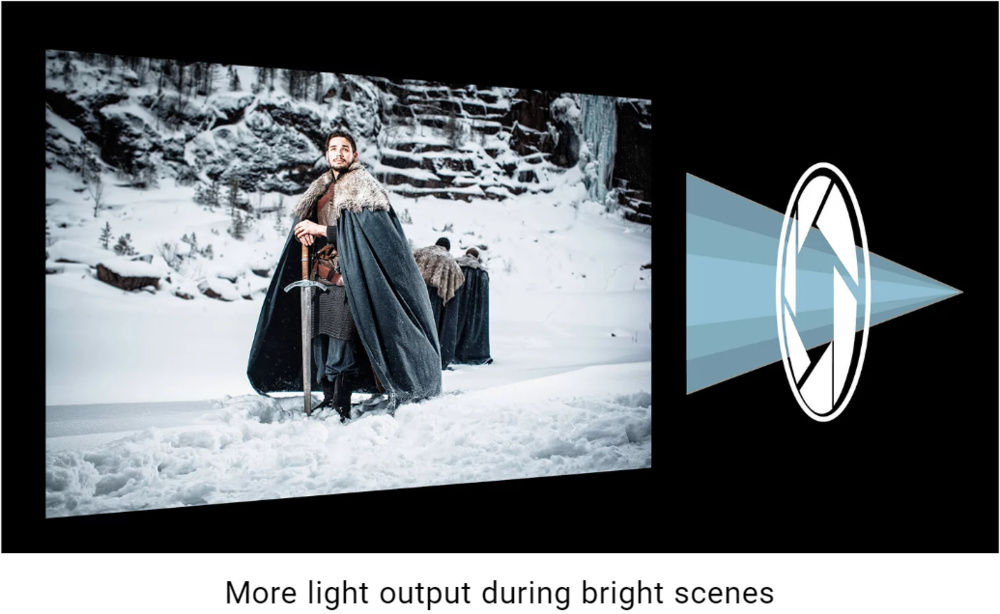
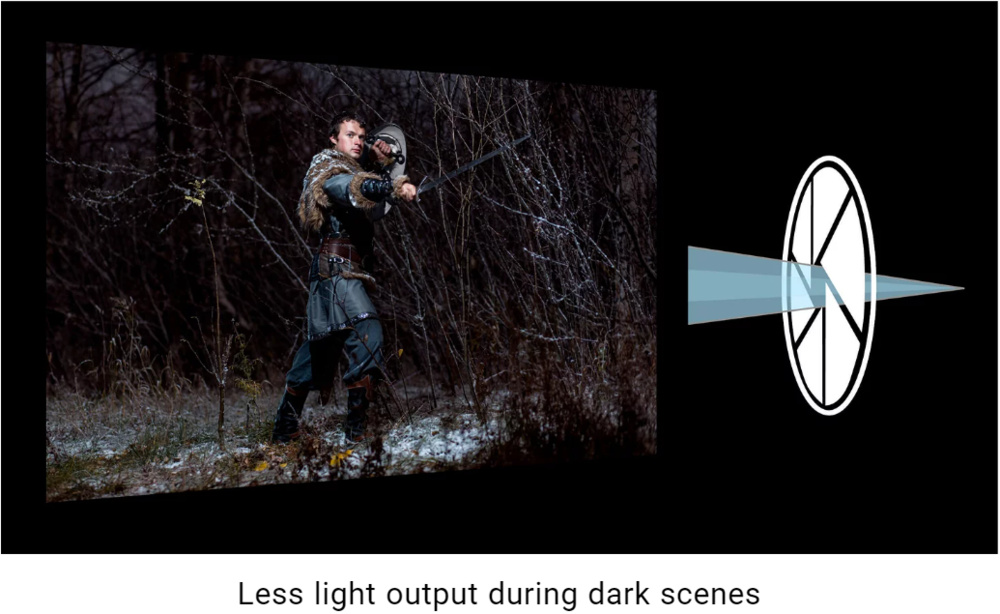
Dynamic contrast means that a projector uses features to make adjustments based on the projected image. These include dynamic irises, which limit the amount of light being outputted by the projector, and lamp or picture modes that lower the output of the light source, thus lowering the brightness of the image displayed. Dynamic contrast values are measured the same way FOFO contrast is, with the addition of these dimming features, which significantly lower the brightness of the solid black image.
While these features can improve the black levels of a projector in real content, especially in very dim scenes, they inherently lower the brightness of the brighter areas in the same scene, which results in a minimal impact on the scene's contrast.
|
Bright scene dynamic contrast - Iris opened (source: BenQ)
|
Dark scene dynamic contrast - Iris closed (source: BenQ)
|
Contrast Marketing: Big Numbers Sell
|
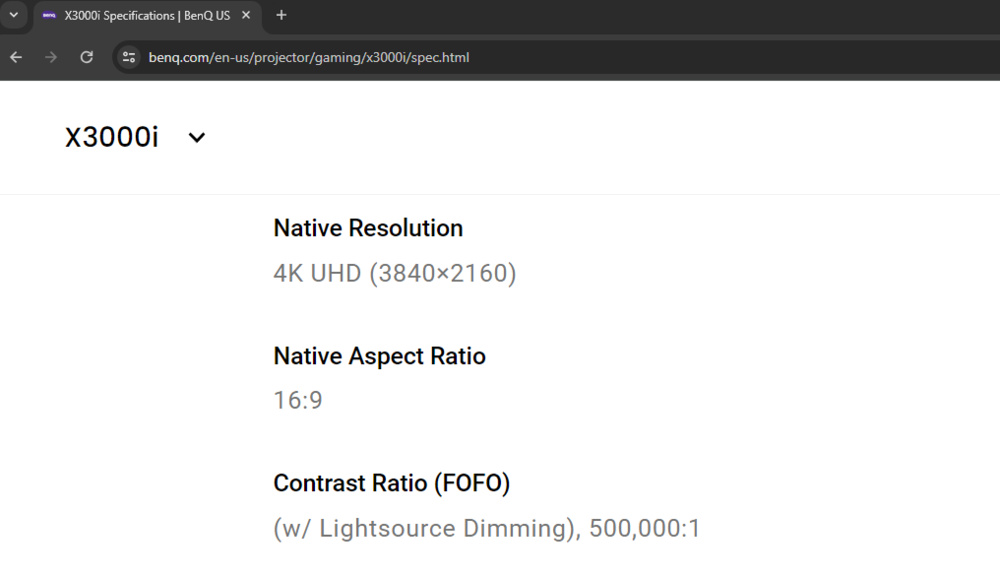
Contrast ratios being comparatively low on paper for projectors has resulted in marketing specifying contrast values you'll never experience watching real content. Values are usually quoted as either FOFO (full-on/full-off) or Dynamic Contrast. But don't take our word for it. BenQ provides the answer in their article called The Myth of High Contrast: "...Given the average consumer's tendency to equate higher numbers with being "better," most brands have favored the use of FOFO contrast ratio in their contrast specifications." It's advice so good that they're following it themselves, as we can see in the figure to the right. |
BenQ X3000i specifications (source: BenQ)
|
Values like the ones seen in the image below should ring an alarm, as they can't be experienced in the same frame. We've tested this ourselves on our Epson Home Cinema 3800, and the only way we could obtain a contrast ratio of 100 000:1 was by measuring a full white frame, followed by a full black frame after allowing the auto-iris to dim the black frame to its lowest possible level. This isn't the contrast you'll experience in real content.
|
ANSI Contrast: Stringent But Not Perfect Either
A projector's contrast ratio mostly depends on the viewing environment and the APL (average pixel level) of the content being displayed, as well as whether contrast-enhancing features are active. The lower the APL, the higher the effective contrast ratio.
Despite its usefulness in comparing projectors in terms of their native contrast performance, we consider that ANSI contrast has two main issues:
- It's a fixed value measured on a 50% average pixel level (APL) checkerboard, meaning it doesn't tell you the contrast ratio you would obtain at a lower APL.
- Measuring it 100% accurately is unfeasible except in perfect lab-grade conditions with top-tier equipment like contrast sensors placed directly on the projector screen. Any light reflecting towards the screen from any surface, including our illuminance meter and tester, will raise black levels and lower the measured contrast value.
We don't measure ANSI contrast as part of our current projector reviews. We measure native contrast on a 50% APL checkerboard (all contrast boosting features disabled). Our stringent contrast measuring protocol, including the test room, instruments, and tolerance for light in the room, is highly standardized, so you can confidently compare the projector's native contrast ratios using the values we provide—we affectionately refer to it as "ANSI-ish" contrast.
As a matter of fact, our room's design was validated during testing development as we could accurately measure the advertised FOFO and dynamic contrast ratios of projectors, like the Epson Home Cinema 3800's 100 000:1 dynamic contrast ratio. We're measuring 50% APL contrast because we calculated a 190:1 contrast ratio on this projector instead of its advertised 100 000:1 contrast ratio, as shown at the start of this article.
Lower APL = Better Contrast Ratios
As mentioned in the previous section, a projector's contrast performance is relative to the APL of the content being displayed on the screen. APL is the information contained in the input signal before gamma correction is applied. The lower the APL, the higher the perceived contrast. This is due both to light leakage within the projector's optical setup but also has a lot to do with the fact that the more light is projected in your viewing environment, the more will be reflected towards the screen in areas that should be dark which will lead to increased black levels and thus lower contrast.
To demonstrate how this impacts contrast performance, we've made custom checkerboard patterns with APLs of 1%, 10%, and 25% and tested two projectors to compare their contrast ratios at these APLs to their 50% APL performance.
|
1% APL test pattern
|
10% APL test pattern
|
25% APL test pattern
|
50% APL test pattern (ANSI checkerboard)
|
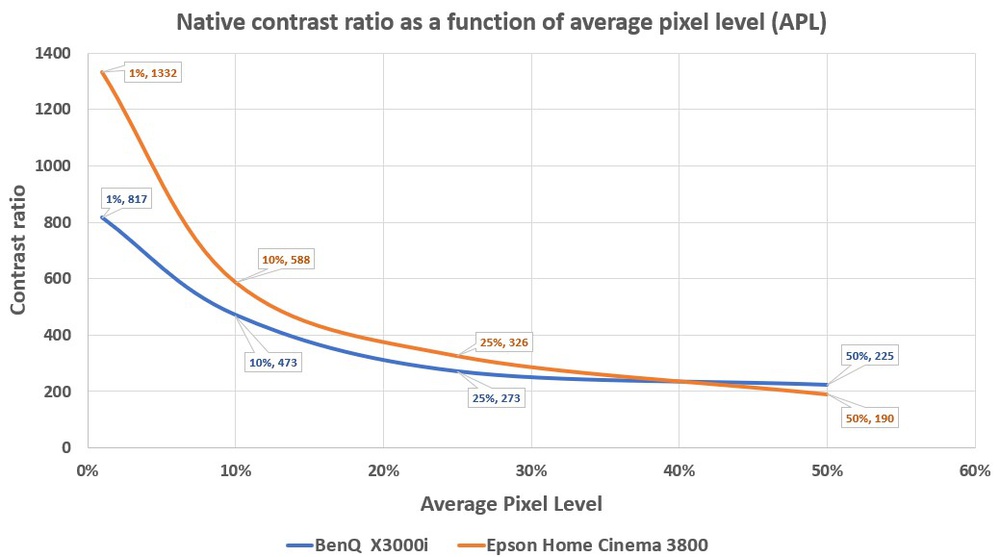
The figure below shows how the contrast ratios of both the Epson Home Cinema 3800 (LCD) and BenQ X3000i (DLP) projectors vary per the APL of the scene displayed. At an APL of 10% or under, projectors can yield performance comparable to some entry-level IPS LCD TVs. As we are using checkerboard patterns, the ADL (average display luminance), which is the luminance output after gamma correction, is the same as the APL. In real scenes, the ADL is generally lower than the APL, which benefits the effective contrast ratio.
|
Native contrast ratio of the BenQ X3000i and Epson Home Cinema 3800 as a function of the average pixel level (APL)
|
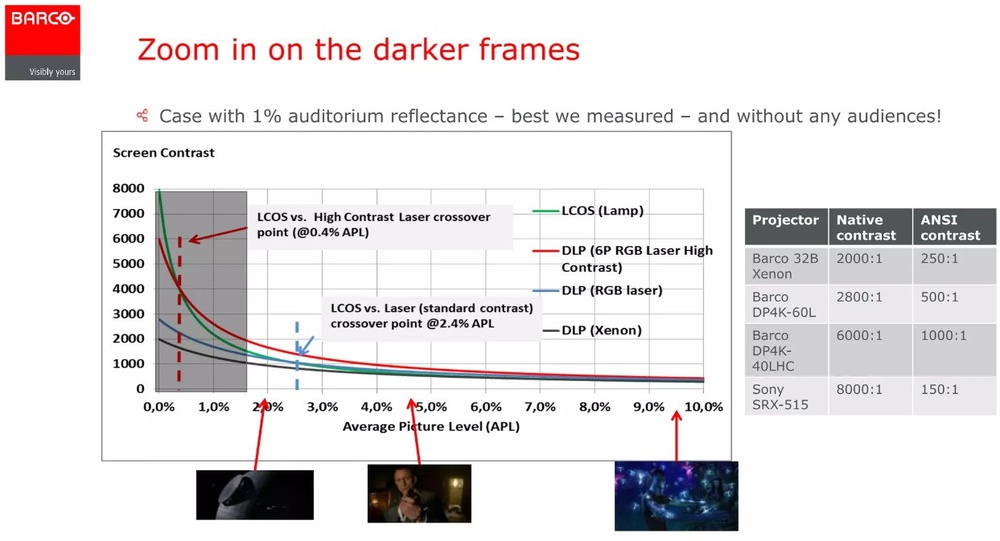
The relationship between APL and contrast ratio we've observed aligns with that which Barco has demonstrated in a presentation they've made on projector contrast. It's important to note that although contrast drops sharply with a rising APL, the end result is still good for most people due to the immersion projectors can create due to sheer projection size.
|
Slide from a Barco presentation showcasing how contrast drops when the APL increases
|
Why We Launched Our Reviews With 50% APL Native Contrast
The reason we launched our projector reviews using a 50% APL native contrast is simple. It's stringent, and although imperfect, it's significantly more representative of the contrast ratios you'll experience in real content than what is specified by FOFO or dynamic contrast. Even if some movie content may hover around ~8-15% APL, not all content or scenes you'll watch are that low. You'll likely often experience a contrast ratio that's better than 50% APL native contrast, but it won't be consistent either.
Nonetheless, we know that there are limitations that stem from the fact we've concerted our efforts on evaluating 50% APL contrast as a means of stress-testing our projectors. As part of our next test bench updates, we're already planning on adding contrast tests at varying APL levels to offer a more comprehensive coverage of how the contrast ratio a projector yields is influenced by the content displayed.
Projector Contrast: Limited Due To How Projectors Work
Why are base figures for contrast ratios so low for projectors compared to emissive displays like TVs? It comes down to projectors not being perfectly efficient at controlling the flow of light from their light sources to the screen. Internal light loss (or leak) occurs due to the optics of the projector itself (lens, optical coatings, etc.) and also because of the light-modulating technology used (LCD, DLP, or LCoS).
The good news is that manufacturers can control internal light leak to a certain extent by choosing different construction materials and designs, and it's reasonable to expect that an entry‑level projector will use lower-quality parts than a high-end projector and thus have worse contrast performance from the get-go.
Below is a simplified diagram of what's going on within a bulb-based LCD projector. In the case of such a projector, the light source is on a predefined brightness setting (usually max or "eco") and isn't modulated during use. Rather, an LCD panel blocks areas of the projected light. The amount of light these LCD panels must block (relative to their surface areas) is significant.
|
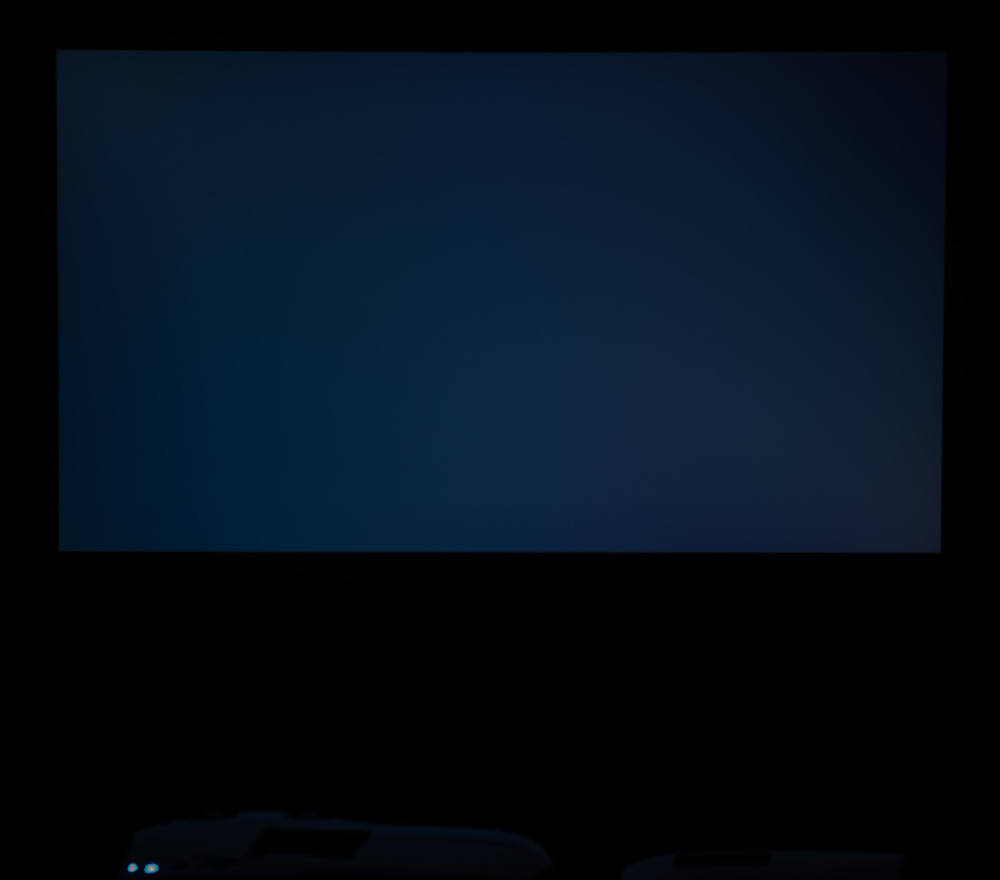
The effect looks something like this when we send a 100% black frame to the Epson Home Cinema 3800. The measured black brightness of the full black frame was 0.562 cd/m² on a 55" projection. As discussed previously, it's possible to get a much deeper black on a 100% black side if dynamic contrast settings are enabled, but in real content, this isn't as effective and would also lower the brighter part of the images. In contrast, LCD panels in TVs need to block a substantially lower amount of light per unit area, which helps even affordable TVs have better native contrast than most projectors on the market. But in practice, projectors don't need to offer OLED-like contrast to offer a compelling experience. What they currently lack in pure contrast performance is made up for by the immersion they deliver at big picture sizes. |
Epson Home Cinema's native black level (auto-iris disabled)
|
Your Viewing Environment Has The Most Impact On Your Contrast Experience
|
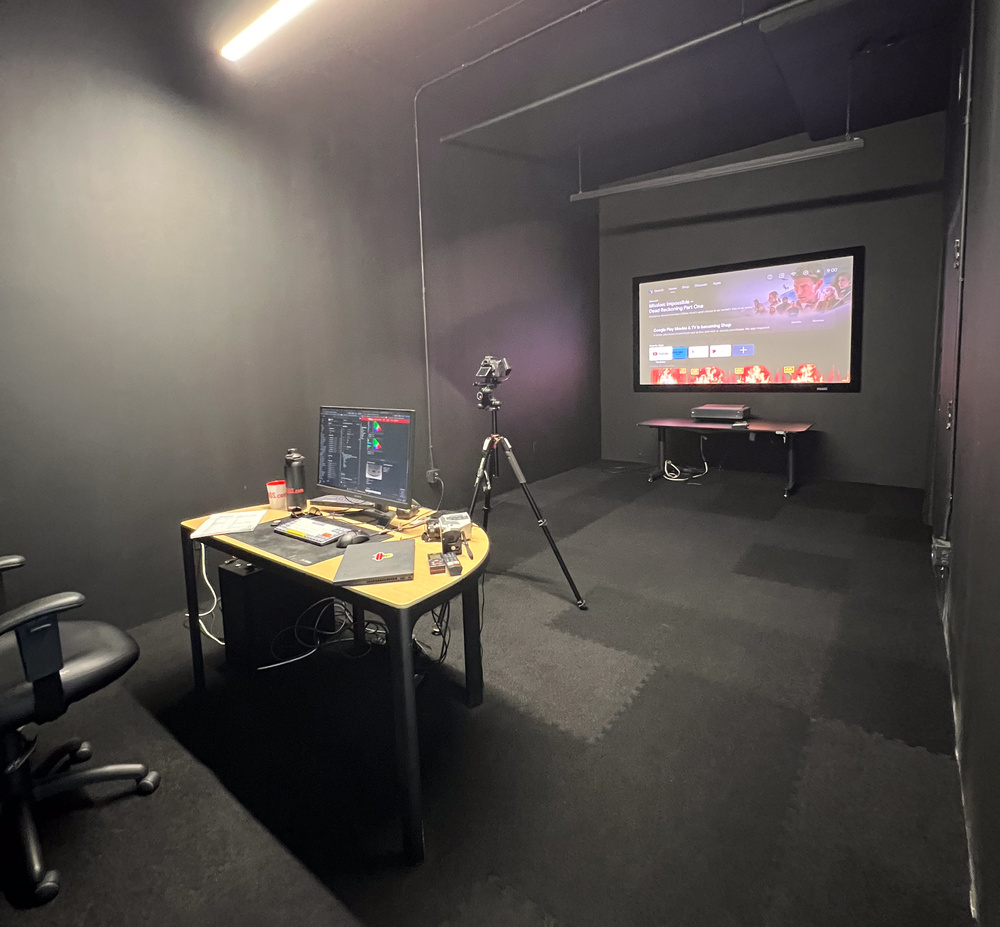
Overview of the testing room setup
|
Beyond the projectors themselves, what has the most impact on the contrast experience can't be controlled by manufacturers: the viewing environment. We put considerable effort into designing a testing room with minimal reflections to avoid light bouncing back towards our Stewart StudioTek 100 screen. This room is painted completely black and features a low-reflective carpet, helping tremendously to keep reflections to a bare minimum. Although we didn't go so far as to cover every surface with light-absorbent fabric, we nonetheless achieved such darkness that we had to add fluorescent safety tape around the door and light switch to not get lost in the room should the power go out. |
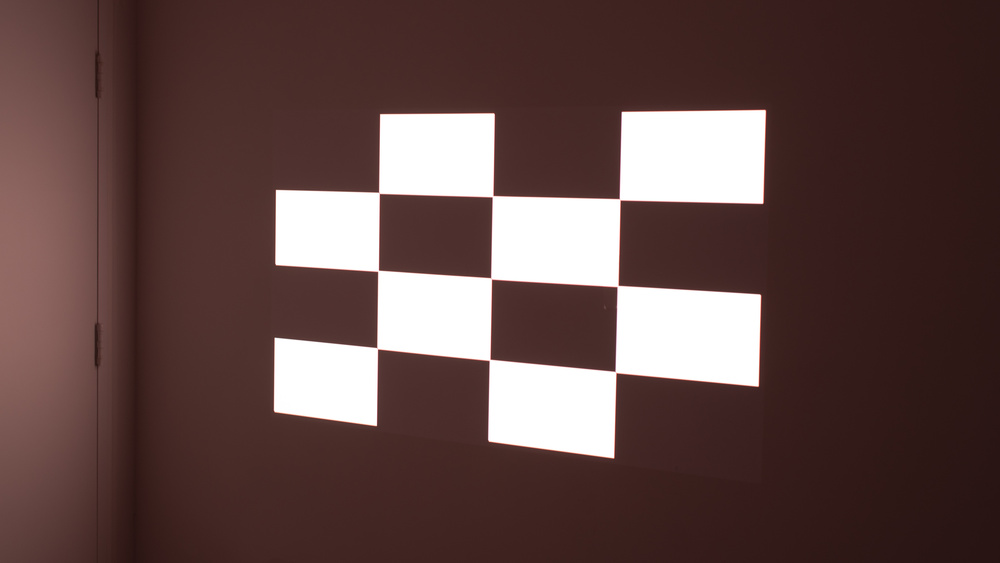
While not quite a lab, our testing room is a great simulation of an ideal (albeit not so stylish) home theater. As most home theaters should have a little more reflections than our setup, we expect real-world contrast performance to be somewhat lower as black levels raise from light being reflected onto the screen from the surrounding environment. As an example, compare contrast figures from the Hisense C1 laser projector measured in our pitch-black testing room (50% APL C.R. = 156:1) vs. a similar room with white walls and concrete flooring (50% APL C.R. = 53:1). Note that the surface finish of the wall itself is also impacting the perceived luminance of the image when compared to our projector screen, which has a 1.0 neutral gain.
|
Hisense C1 - 50% APL checkerboard in our testing room (Contrast ratio = 156:1)
|
Hisense C1 - 50% APL checkerboard in a standard testing room (Contrast ratio = 53:1)
|
It's worth mentioning that an emissive display's contrast performance (like a TV) is unaffected by this environmental change, while the opposite is true for a projector. For comparison, we can look at how the Hisense PX1-PRO laser projector compares to a budget 65" TCL Q650G in our testing room with no ambient light (left image) vs. with a light on in the room (right image). As we can see, since the TV emits its light off the screen, it is unphased by the ambient lighting, whereas the projector's image is washed out, highlighting the impact of how the viewing environment highly impacts a projector's contrast performance.
|
Hisense PX1-PRO vs TCL Q650G comparison (lights off in our testing room)
|
Hisense PX1-PRO vs TCL Q650G comparison (lights on in our testing room)
|
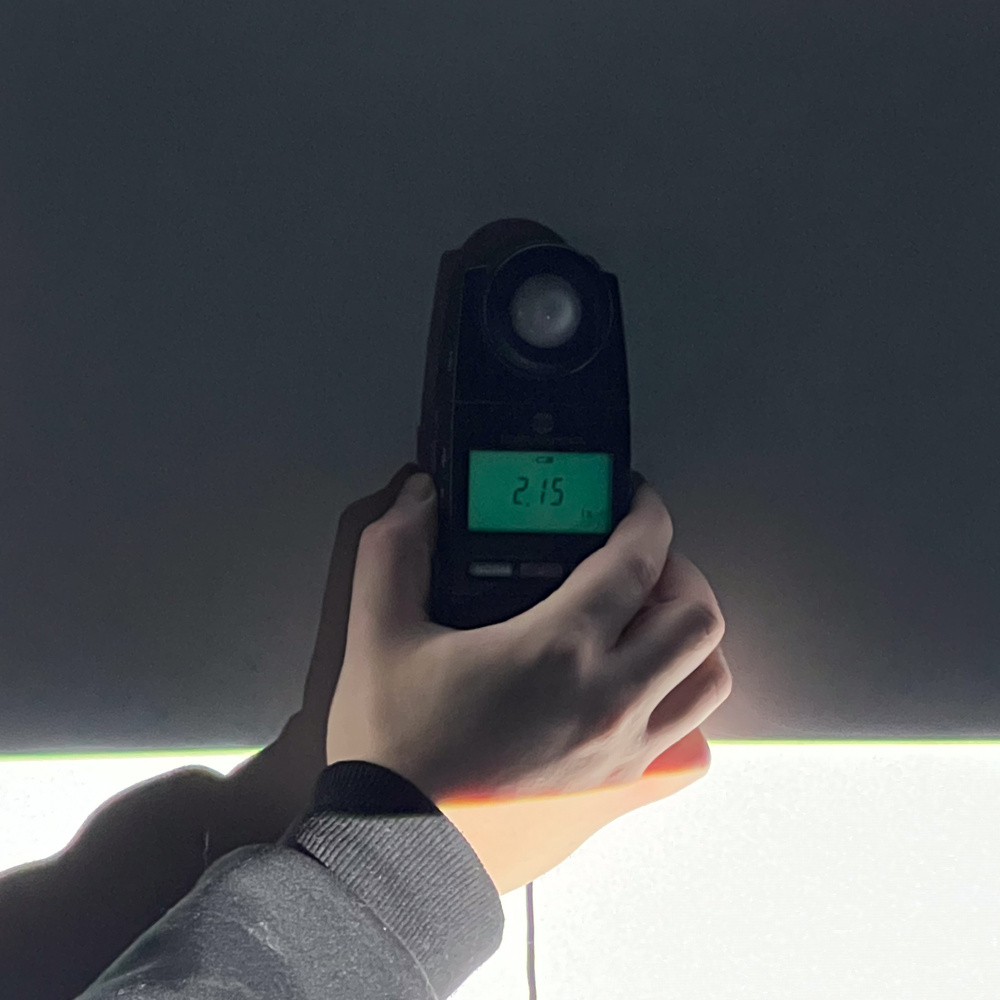
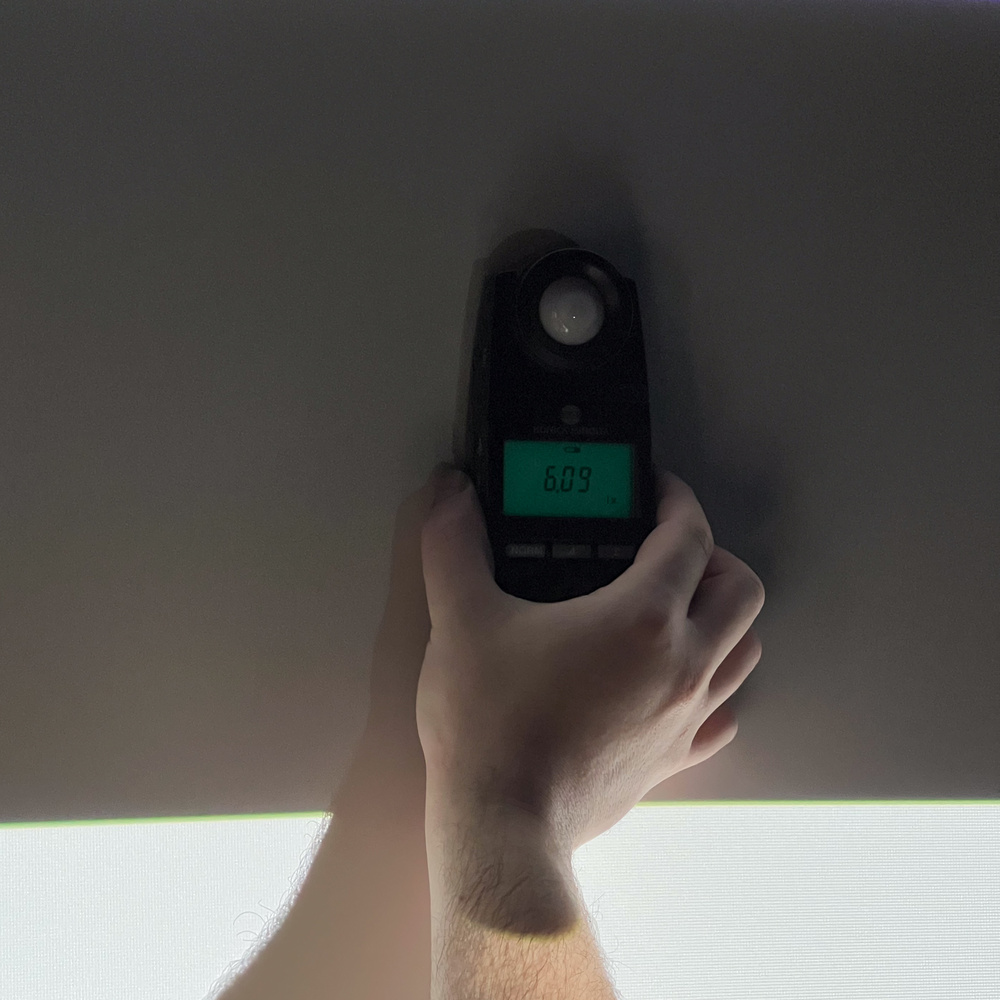
Even in our well-controlled dark testing room, we initially underestimated how black levels could be impacted by light being reflected toward the screen. For results to be comparable between projectors, everything had to be standardized, even the tester's clothing! Just take a look at the difference in illuminance readings we get if our tester wears long-sleeved black clothing (left) instead of a t-shirt (right):
|
Black illuminance measured while the tester is dressed in long-sleeve black clothing.
|
Black illuminance measured while the tester was wearing a light-colored t-shirt.
|
While that may not seem like a significant increase in the raw measured value (≈ 4 lux), the effect is compounded when used to calculate the final contrast ratio of the entire projected image. We'd have found a native contrast ratio of more than 50% lower if we'd taken all the measurements while wearing a t-shirt!
Testing a projector's contrast using our methodology really begs the question of applicability in a real-world setup, say, in a living room with white walls or a window. These questions are important, but to fully understand the nature of our testing, it's important to remember that if the environment has that much influence over the results, standardizing our environment and methodology is the only way to ensure our results are comparable across products. This means reducing the reflections to a strict minimum through the room's design and imposing a dress code on our testers. Our results are meant to be compared to each other as they will differ from those taken in different measurement environments and can give you a sense of how this product performs in the most ideal environment.
Beyond all of this, although the native contrast performance of projectors can't match what emissive displays like TVs can deliver, there's a lot that the numbers don't tell. For starters, your eyes will adjust to a projector's lower brightness level, and the contrast experience, although less than what a TV delivers, won't be as bad as the numbers suggest in real content.
Even if TVs can achieve incredibly high contrast ratios, not all content takes advantage of this. For example, outside of letterboxing, OLEDs rarely show 100% black over extensive areas in real content.
How To Interpret Our Numbers
Before we conclude this R&D article, we must add some context to our results. We can observe a certain degree of variance in brightness and contrast readings that come from a combination of human error and instrument sensitivity. For both the White Light Output, Color Light Output, and Native Contrast tests, we use a Konica-Minolta T-10A illuminance meter. The instrument has an excellent accuracy of around ±2% in ideal conditions, and the testing room also plays a role since any light source other than the projector will raise light levels and impact our results. Some impacts of the variance can be seen when comparing WLO to CLO measurements as, assuming perfect color accuracy, CLO should never exceed the projector's WLO, while we have some cases in which they measure slightly higher in the former. CLO measurement requires a total of 27 measures using the T-10A, compared to 9 for WLO, so there's an accumulation of errors during the process.
|
A table showing color light output being different from white light output on 3LCD projectors, mainly due to the accumulation of errors during the measuring process.
|
Our test results are also limited by the fact we conduct them in our ideal testing room. Our contrast values are almost certainly better than what you would experience in your home, and so are our color gamut numbers, as ambient light washes out color and reduces the measured gamut. Another limitation to consider is that we test our projectors in their most accurate picture mode after they've been calibrated, and this results in a significant drop in brightness, among other things. If you don't mind a less accurate picture, you'll get a brighter image from picture modes like "Vivid" than the ones we use for our testing!
Conclusion
Our projector test bench is limited in scope for its launch, but we covered the essentials of brightness and contrast so that consumers can see through the marketing and make informed purchase decisions. The good news is that from here on out, we'll make future test bench updates for our projector reviews on a coverage expansion basis, and we already have plans to update our current contrast test in the near future. We already plan to add other performance criteria later, including picture quality and motion handling.
Beyond the marketing, just by looking at performance metrics, it could be easy for most people to write off projectors as soon as they're compared to emissive displays like TVs. However, we've realized that hard comparisons don't always hold up as projectors inherently offer more flexibility with their varying throw ratios and compact sizes while being more affordable past a certain projection size than a similarly-sized TV. You'll also likely have an easier time setting up a projector in your basement than getting a friend to help bring a 115" TV down there.
And even if we look at pure numbers, they don't tell the whole story either. For example, consider that while the contrast ratios you experience on a movie theater screen are quite low, especially since they drop depending on the average picture level of the scene (as seen in the slide below from a Barco presentation), the overall experience is arguably still great. Numbers don't account for immersion, which is where projectors really shine.
From now on, we've got your back regarding projector reviews and seeing through the marketing shroud. We're eager to hear your thoughts and suggestions for how we should expand this new review category. Thanks for reading!
Revision History
03/04/2024: Reworked article to focus on how projectors perform vs. their marketed specs.
Comments
Beyond the Marketing: How Projectors Really Perform in Terms of Brightness & Contrast: Main Discussion
What do you think of our article? Let us know below.
Want to learn more? Check out our complete list of articles and tests on the R&D page.
- 21010
Hi NathanH7, Thanks for taking the time to write to us with your feedback! You make an excellent point about a substantial part of real content being lower than 50% APL. We’re planning on expanding the coverage of our contrast test quite soon in order to add contrast measurements at lower APLs (e.g., 1%, 10%, etc.). We expect this to give a more comprehensive representation on how projectors perform over a broad range of content. Let us know should you have any other suggestions or feedback for us. Regards Perhaps even lower ADL ranges as well between 1-10% thank you
- 21010
I’ll second the request for projector screen reviews–or just your recommendation of one quality screen that you test on. My 83" TVs are the largest I think I am going to go. One of those short throw 100"+ projectors will probably be my next step but I’ve seen some really good screens and some that are really, well, not good. A recommendation of one screen that you guys think is excellent would be helpful.
Hi mpmp0,
Thanks for reaching out with your suggestion!
Although testing projector screens isn’t currently in our plans, it doesn’t mean we won’t eventually get to it. :)
We’re very curious ourselves about the impact projector screens can have on a projector’s performance, especially the cost-to-benefit ratio as some screens cost thousands while there are many options available at a few hundred dollars.
We can’t currently recommend any screen over another as the projector screen one chooses should depend on the viewing environment and performance expectations (e.g., ambient light rejection, positive/negative gain, etc.).
Let us know should you have any other suggestions or feedback for us!
Regards
- 21010
I’ll second the request for projector screen reviews–or just your recommendation of one quality screen that you test on. My 83" TVs are the largest I think I am going to go. One of those short throw 100"+ projectors will probably be my next step but I’ve seen some really good screens and some that are really, well, not good. A recommendation of one screen that you guys think is excellent would be helpful.
- 21010
First off I have to start by saying I am so happy you all have decided to begin reviewing projectors! As a guy who has been a long time window shopper, your reviews have finally given me the confidence needed to choose which projectors I’m interested in. The projector reviews are extremely valuable but I feel like they are missing half of the equation - the projector screen. Do you have any plans on adding projector screen reviews, or potentially on each projector review, include a section where you use it on a few different screen offerings of varying budget? If not I would really love that as an addition to your review process.
Hi! Unfortunately projector screen reviews is not currently something that we’re considering, although we are talking about it internally. Our primary focus at the moment is expanding our projector tests, and when we feel like our projector silo is robust enough we might consider expanding into screens. We’re always looking for new ideas, however, and if there’s enough demand we’ll seriously consider it! We’re happy that you’re enjoying our projector reviews so far, and stay tuned for more tests in the future.
- 32120
Noise is a tangible factor when it comes to projectors. Many people complain about projector noise, and it’s especially prevalent in close-in situations like the living room and a high-powered projector at max brightness output. Could you use one of your existing decibel testers from your Speaker testing and use it to measure each projector’s noise at 100% white window display? This may be a valuable testing metric to add
Hi! We agree. Our launch included a limited number of tests to ensure, but going forward we’ll be expanding the tests done on our projectors, and noise is absolutely something that we are looking to test in the future. Thanks for your interest!
- 21010
I’m SO glad you’ve started rating projectors, thank you! I do have one ask, and that is to measure input latency. This this a critical metric for people who plan to use (especially the portable units) them with gaming consoles, or people who use home theatre systems and need to calibrate the audio signal. I was looking at getting the EF12 as I will soon be in a situation where a TV is impractical, but I’ve seen reports of latency from 30ms to 250ms - and I don’t trust reviews outside of the methodical data points captured by RTings.
Hi! It’s certainly on our list for a future test bench. Many of our projectors are marketed primarily for gaming, and we’re really looking forward to expanding our tests to include more gaming specific categories. Stay tuned in the next few months for more on this!
- 21010
Hello! Sorry for the delay on our end. Pascal, a member of our R&D team in charge of displays has been away and will be retuning next week. He’ll aim to catch up on all R&D related questions in this thread once he’s back!
- 32120
Noise is a tangible factor when it comes to projectors. Many people complain about projector noise, and it’s especially prevalent in close-in situations like the living room and a high-powered projector at max brightness output. Could you use one of your existing decibel testers from your Speaker testing and use it to measure each projector’s noise at 100% white window display? This may be a valuable testing metric to add
Completely agree! Projector noise is an important data point and one that’s rarely in projector marketing material. People in smaller homes or who would be watching dialog-heavy content would likely want to prioritize noise over image quality to some extent.
