SDR color volume is a representation of a TV's color performance when displaying SDR content. Ideally, you want a TV with large coverage of the DCI-P3 and BT.2020 color spaces so your SDR content is as colorful and accurate as possible. Instead of showing a TV's color volume performance with a 3D graphic as we do with our HDR Color Volume test, our SDR color volume test shows us a display's capabilities with an easier-to-understand 2D image, which is broken down into slices called gamut rings.
Test results
Test Methodology Coverage
We added this test as part of our 2.0 test bench update. Before that, we had no equivalent test, so TVs that haven't been tested on 2.0 or later don't have these results. Learn how our test benches and scoring system work.
| 1.11 | 2.0 | |
|---|---|---|
| SDR Color Volume | CIELAB DCI-P3 Coverage | ❌ | ✅ |
| SDR Color Volume | CIELAB BT.2020 Coverage | ❌ | ✅ |
When It Matters
Although the vast majority of SDR movies and shows utilize the smaller Rec.709 color space, there are some that take advantage of the wider DCI-P3 and BT.2020 color spaces. Most video games only utilize the narrow sRGB color space, but if you manually change your TV's color gamut to a wider color space for more saturated colors, then SDR color volume in the DCI-P3 and BT.2020 color spaces is important.
Our Tests
We start off by calibrating the TV and setting diffuse white to 100 cd/m², as that's the consensus value for SDR content. We then make sure that the TV is fully warmed up. After that, we calibrate our Colorimetry Research CR-100 colorimeter to the TV using a Colorimetry Research CR-250 spectroradiometer. For this test, we set the TV to its largest color space, which is typically the Native setting.
With our CR-100, we take 602 individual measurements in a dark room through our Calman software workflow. Once these measurements are complete, we're left with Cube Data as well as Target & Intersect Data for the DCI-P3 and BT.2020 color spaces, giving us objective measurements of the TV's SDR color volume performance.
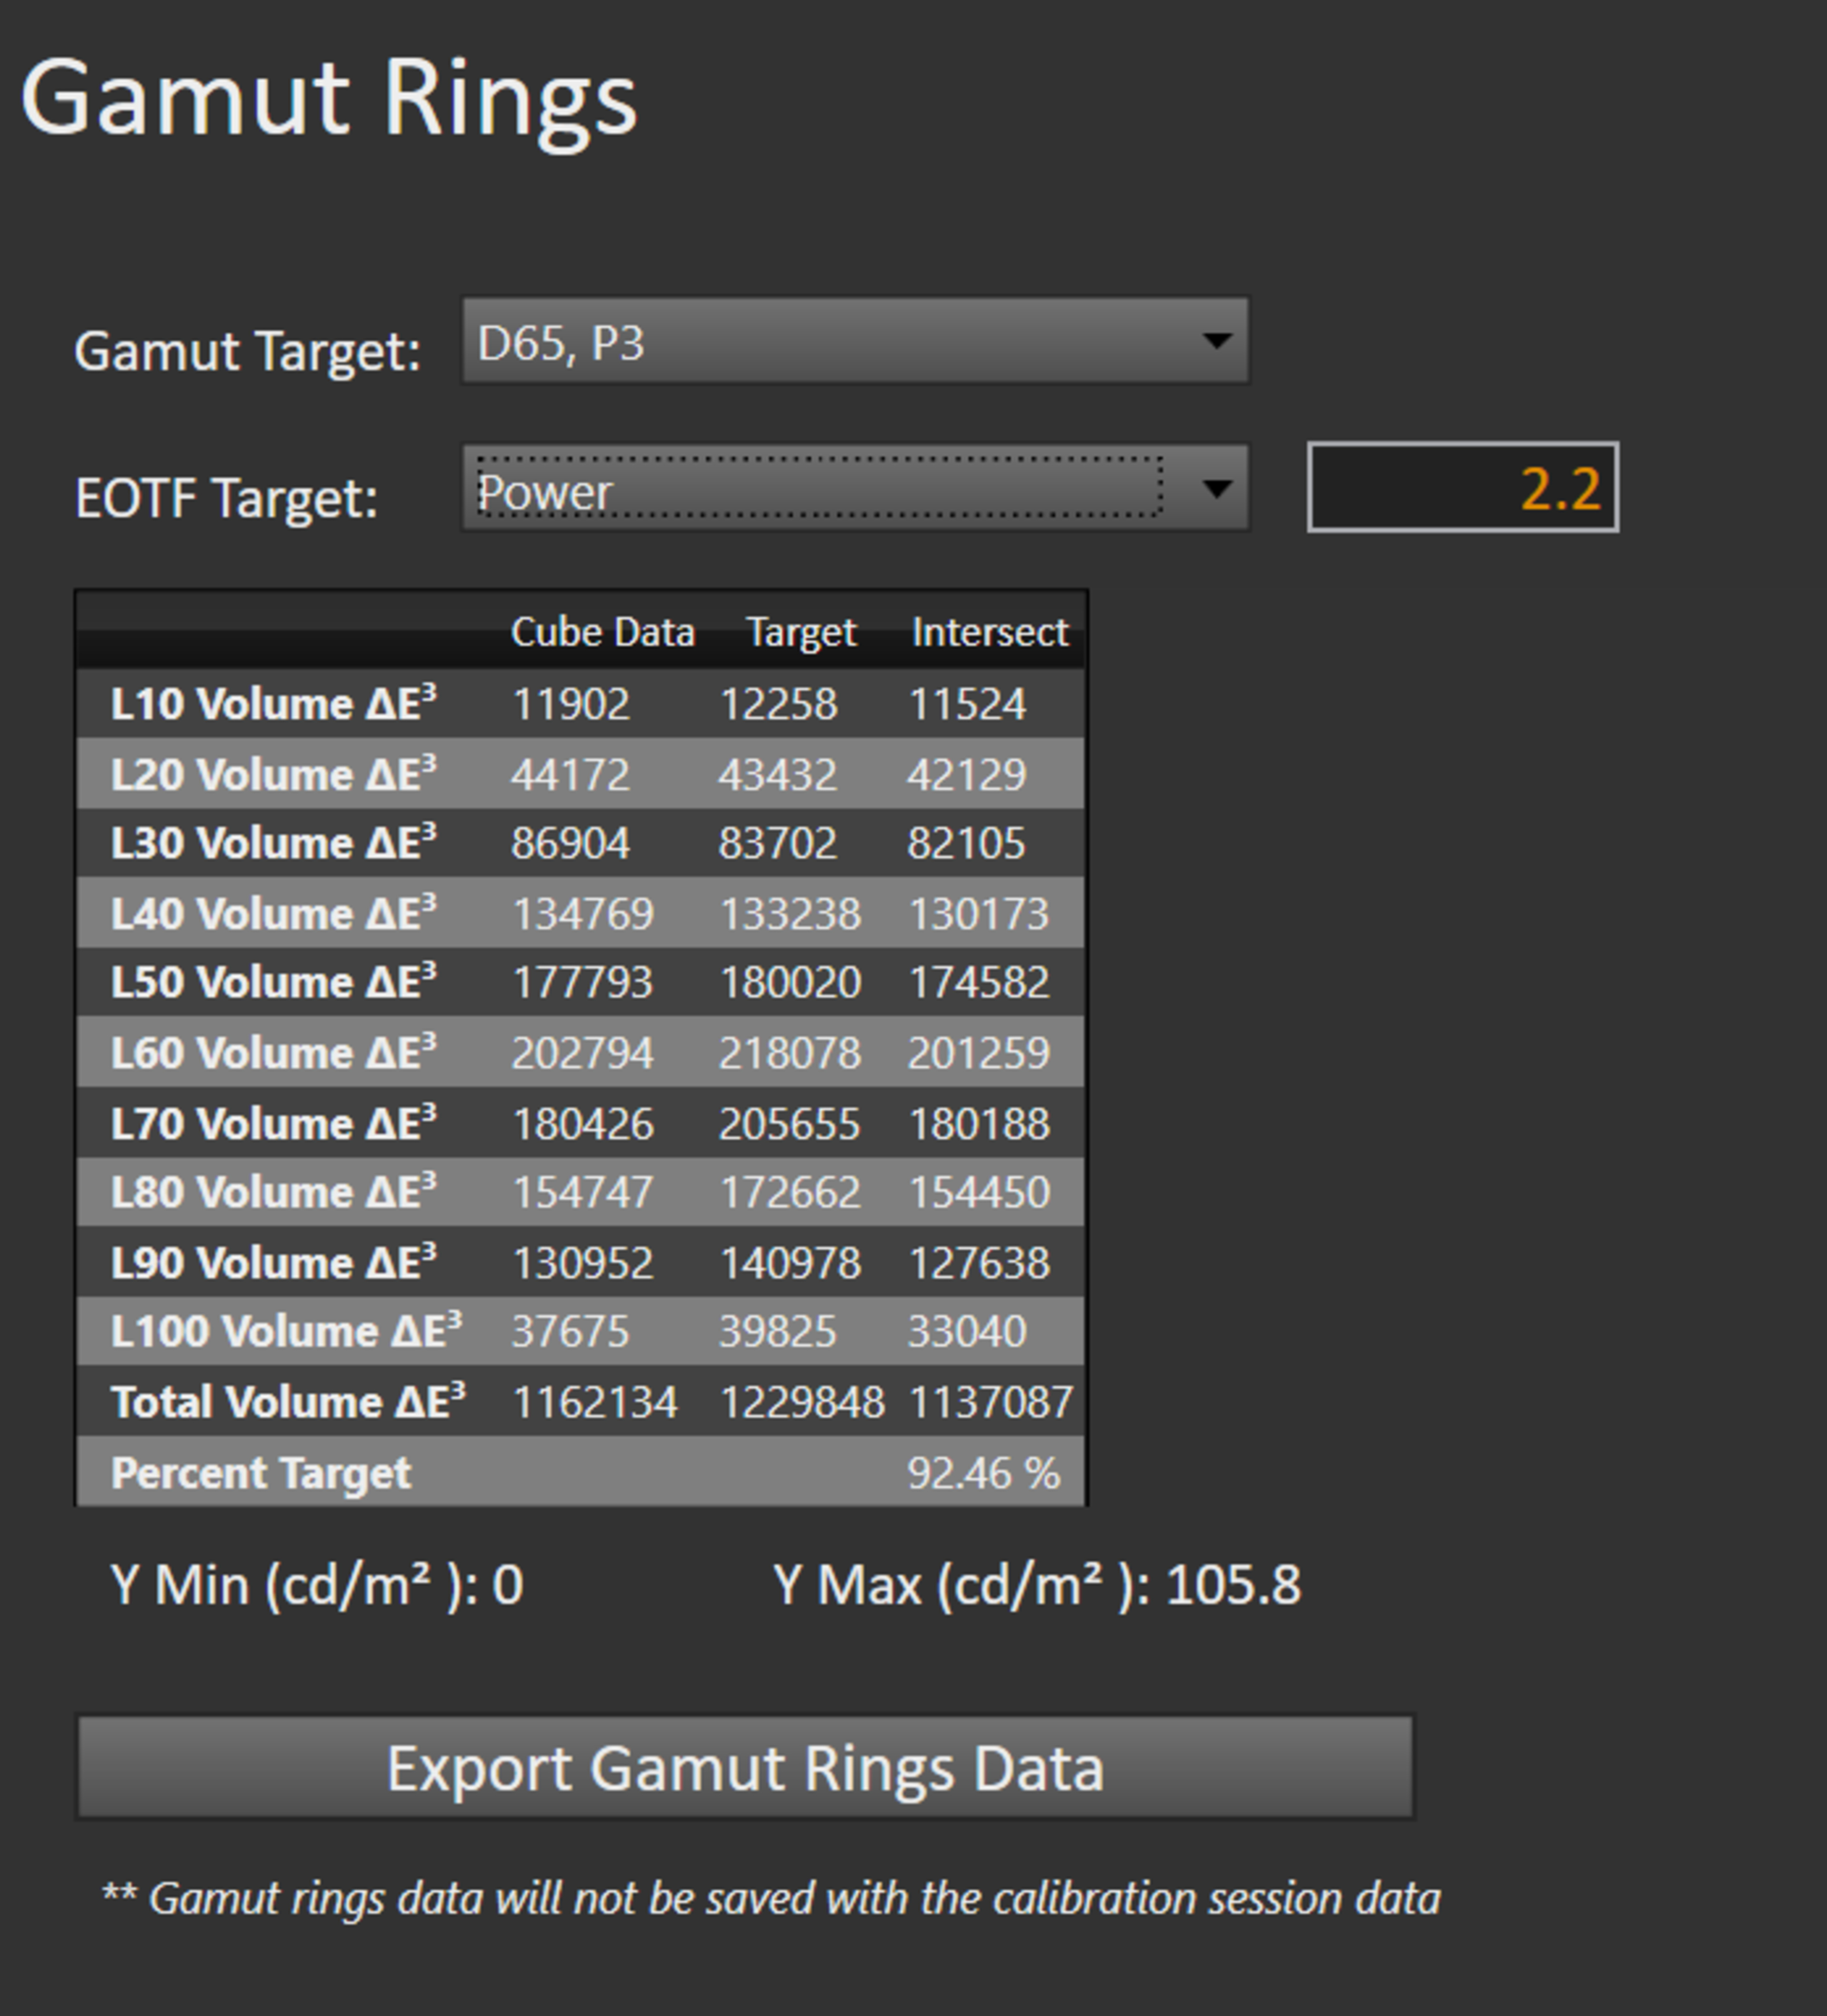
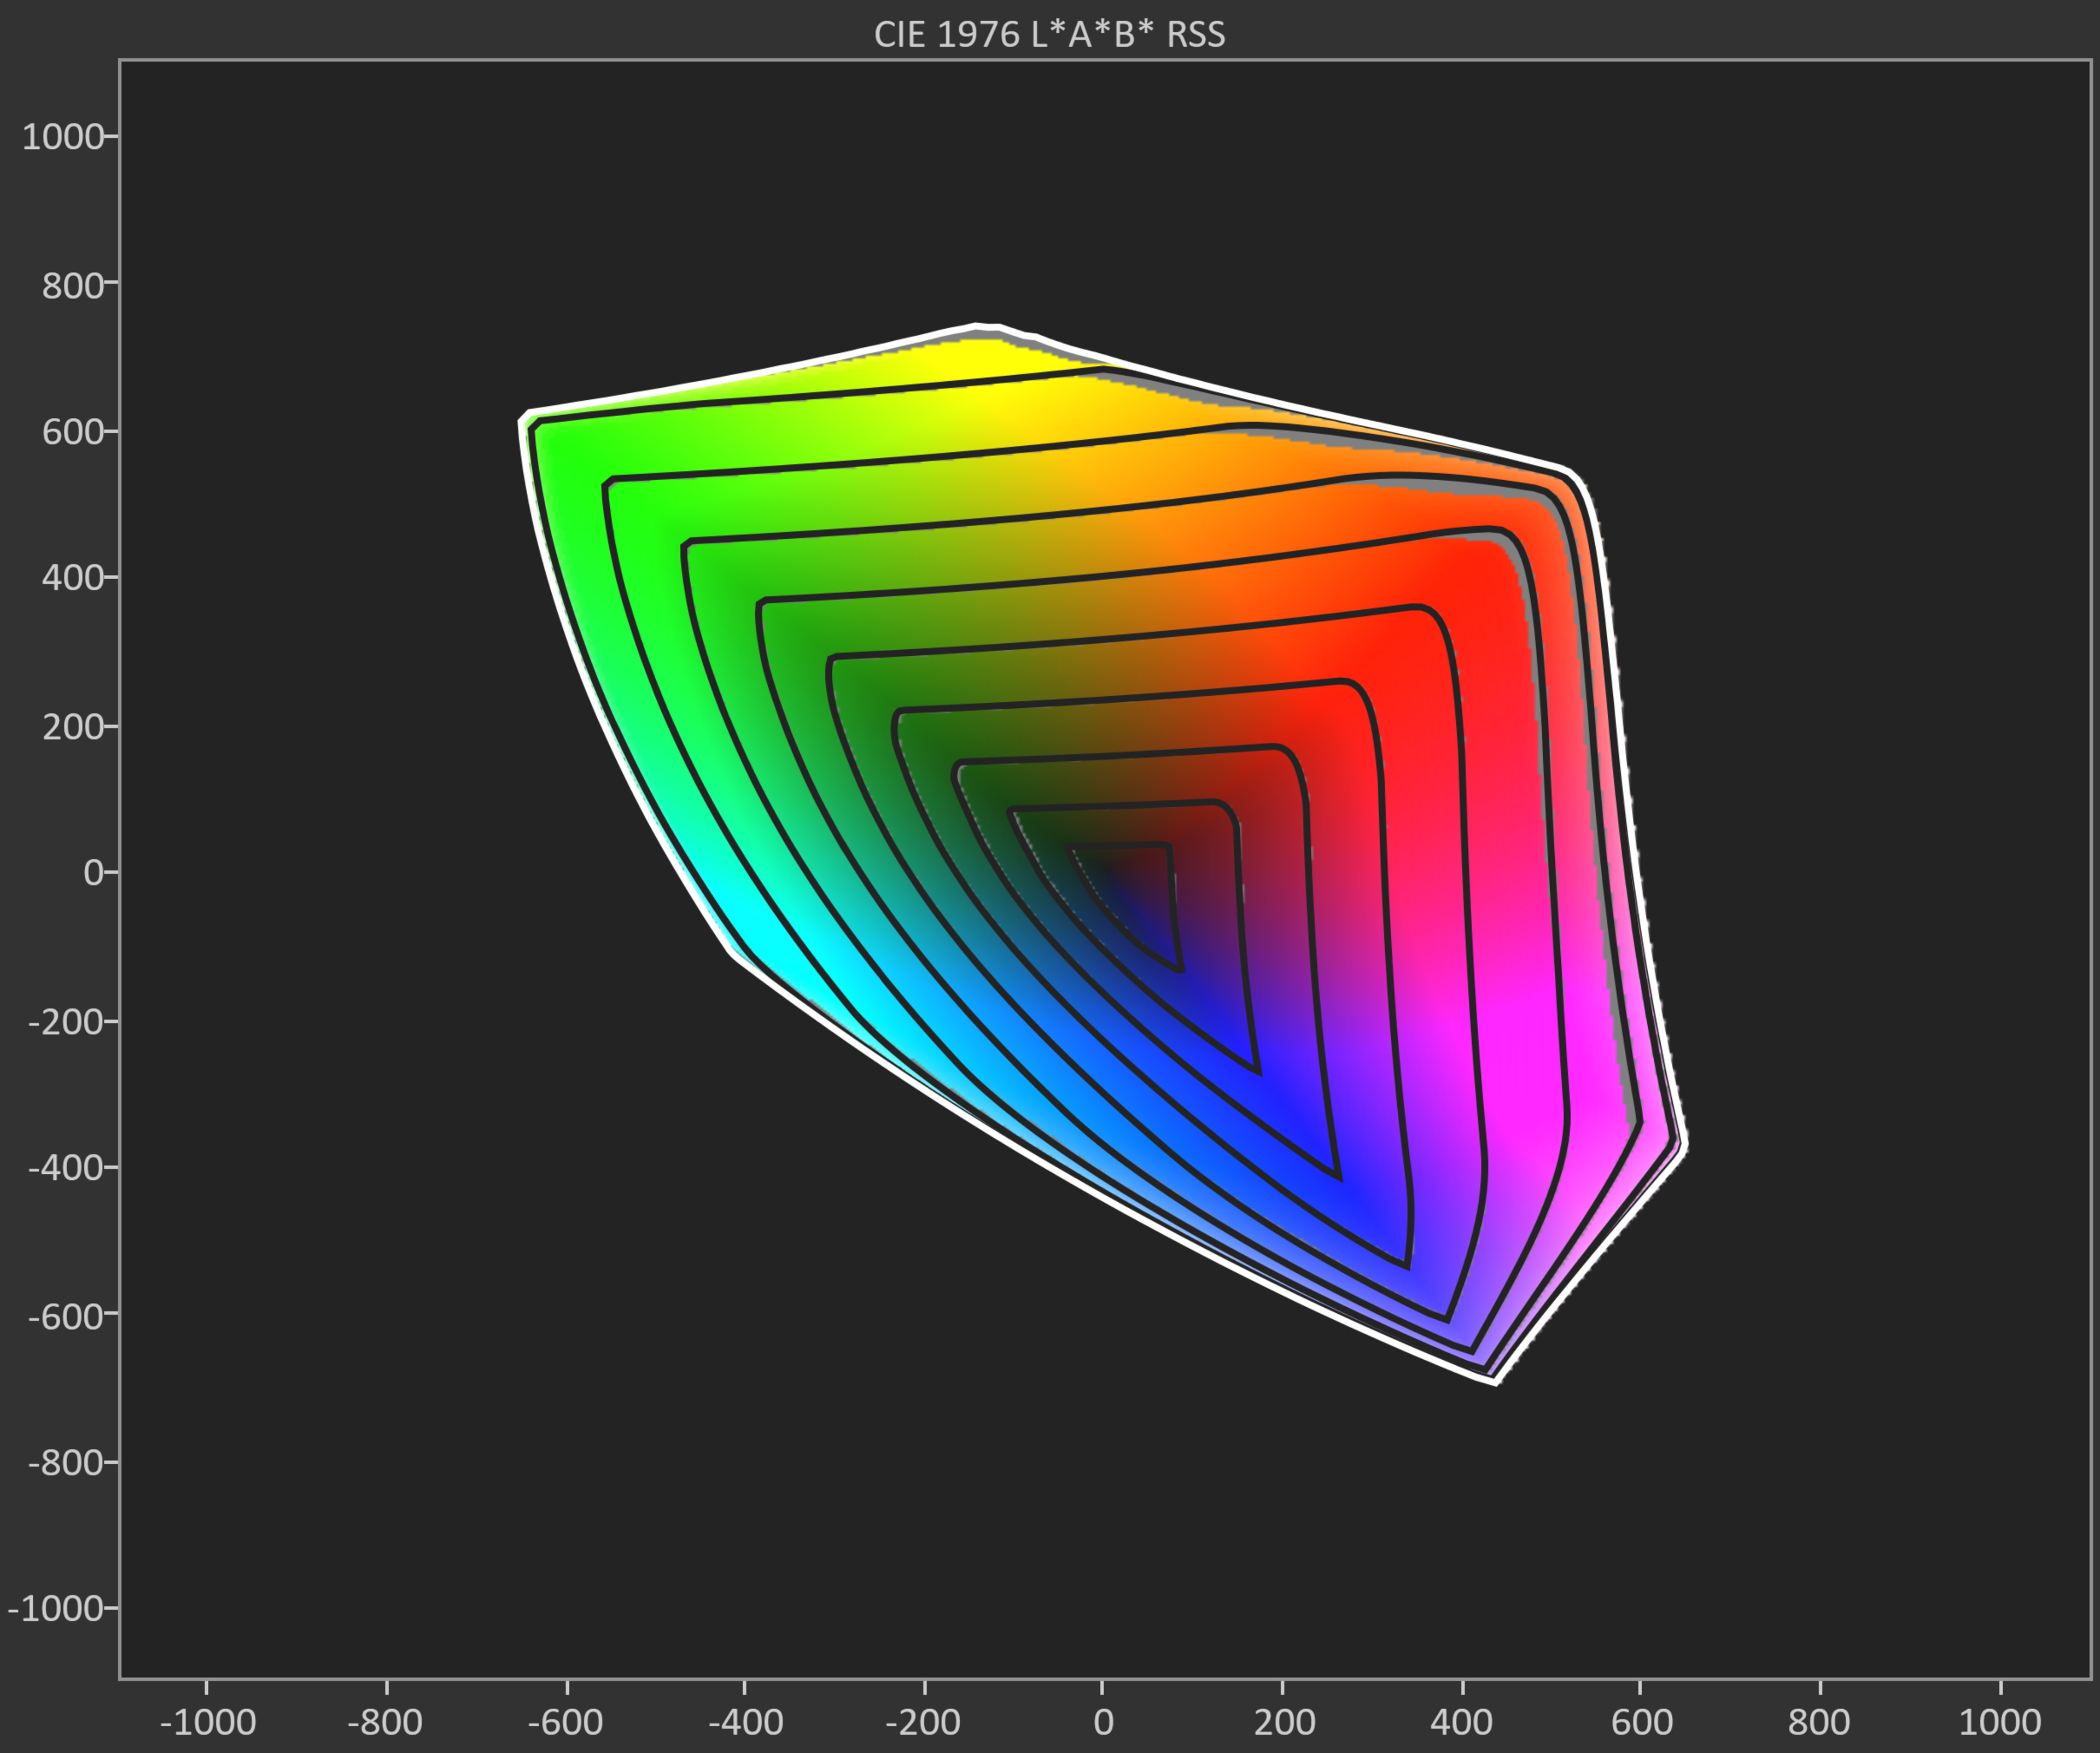
CIELAB DCI-P3 Coverage
Once we have the data for the DCI-P3 color space, Calman generates the 2D gamut rings diagram, which shows how much of the color space can be shown by the TV. The gray areas around the edges of each individual ring show the space that a TV can't fill. Using the Panasonic Z85A as an example, we can see that the data shows the TV covers 92.46% of DCI-P3, and by looking at the graph, we can easily see that it can't display very light colors.
| Data | Final Results Visualized |
 |  |
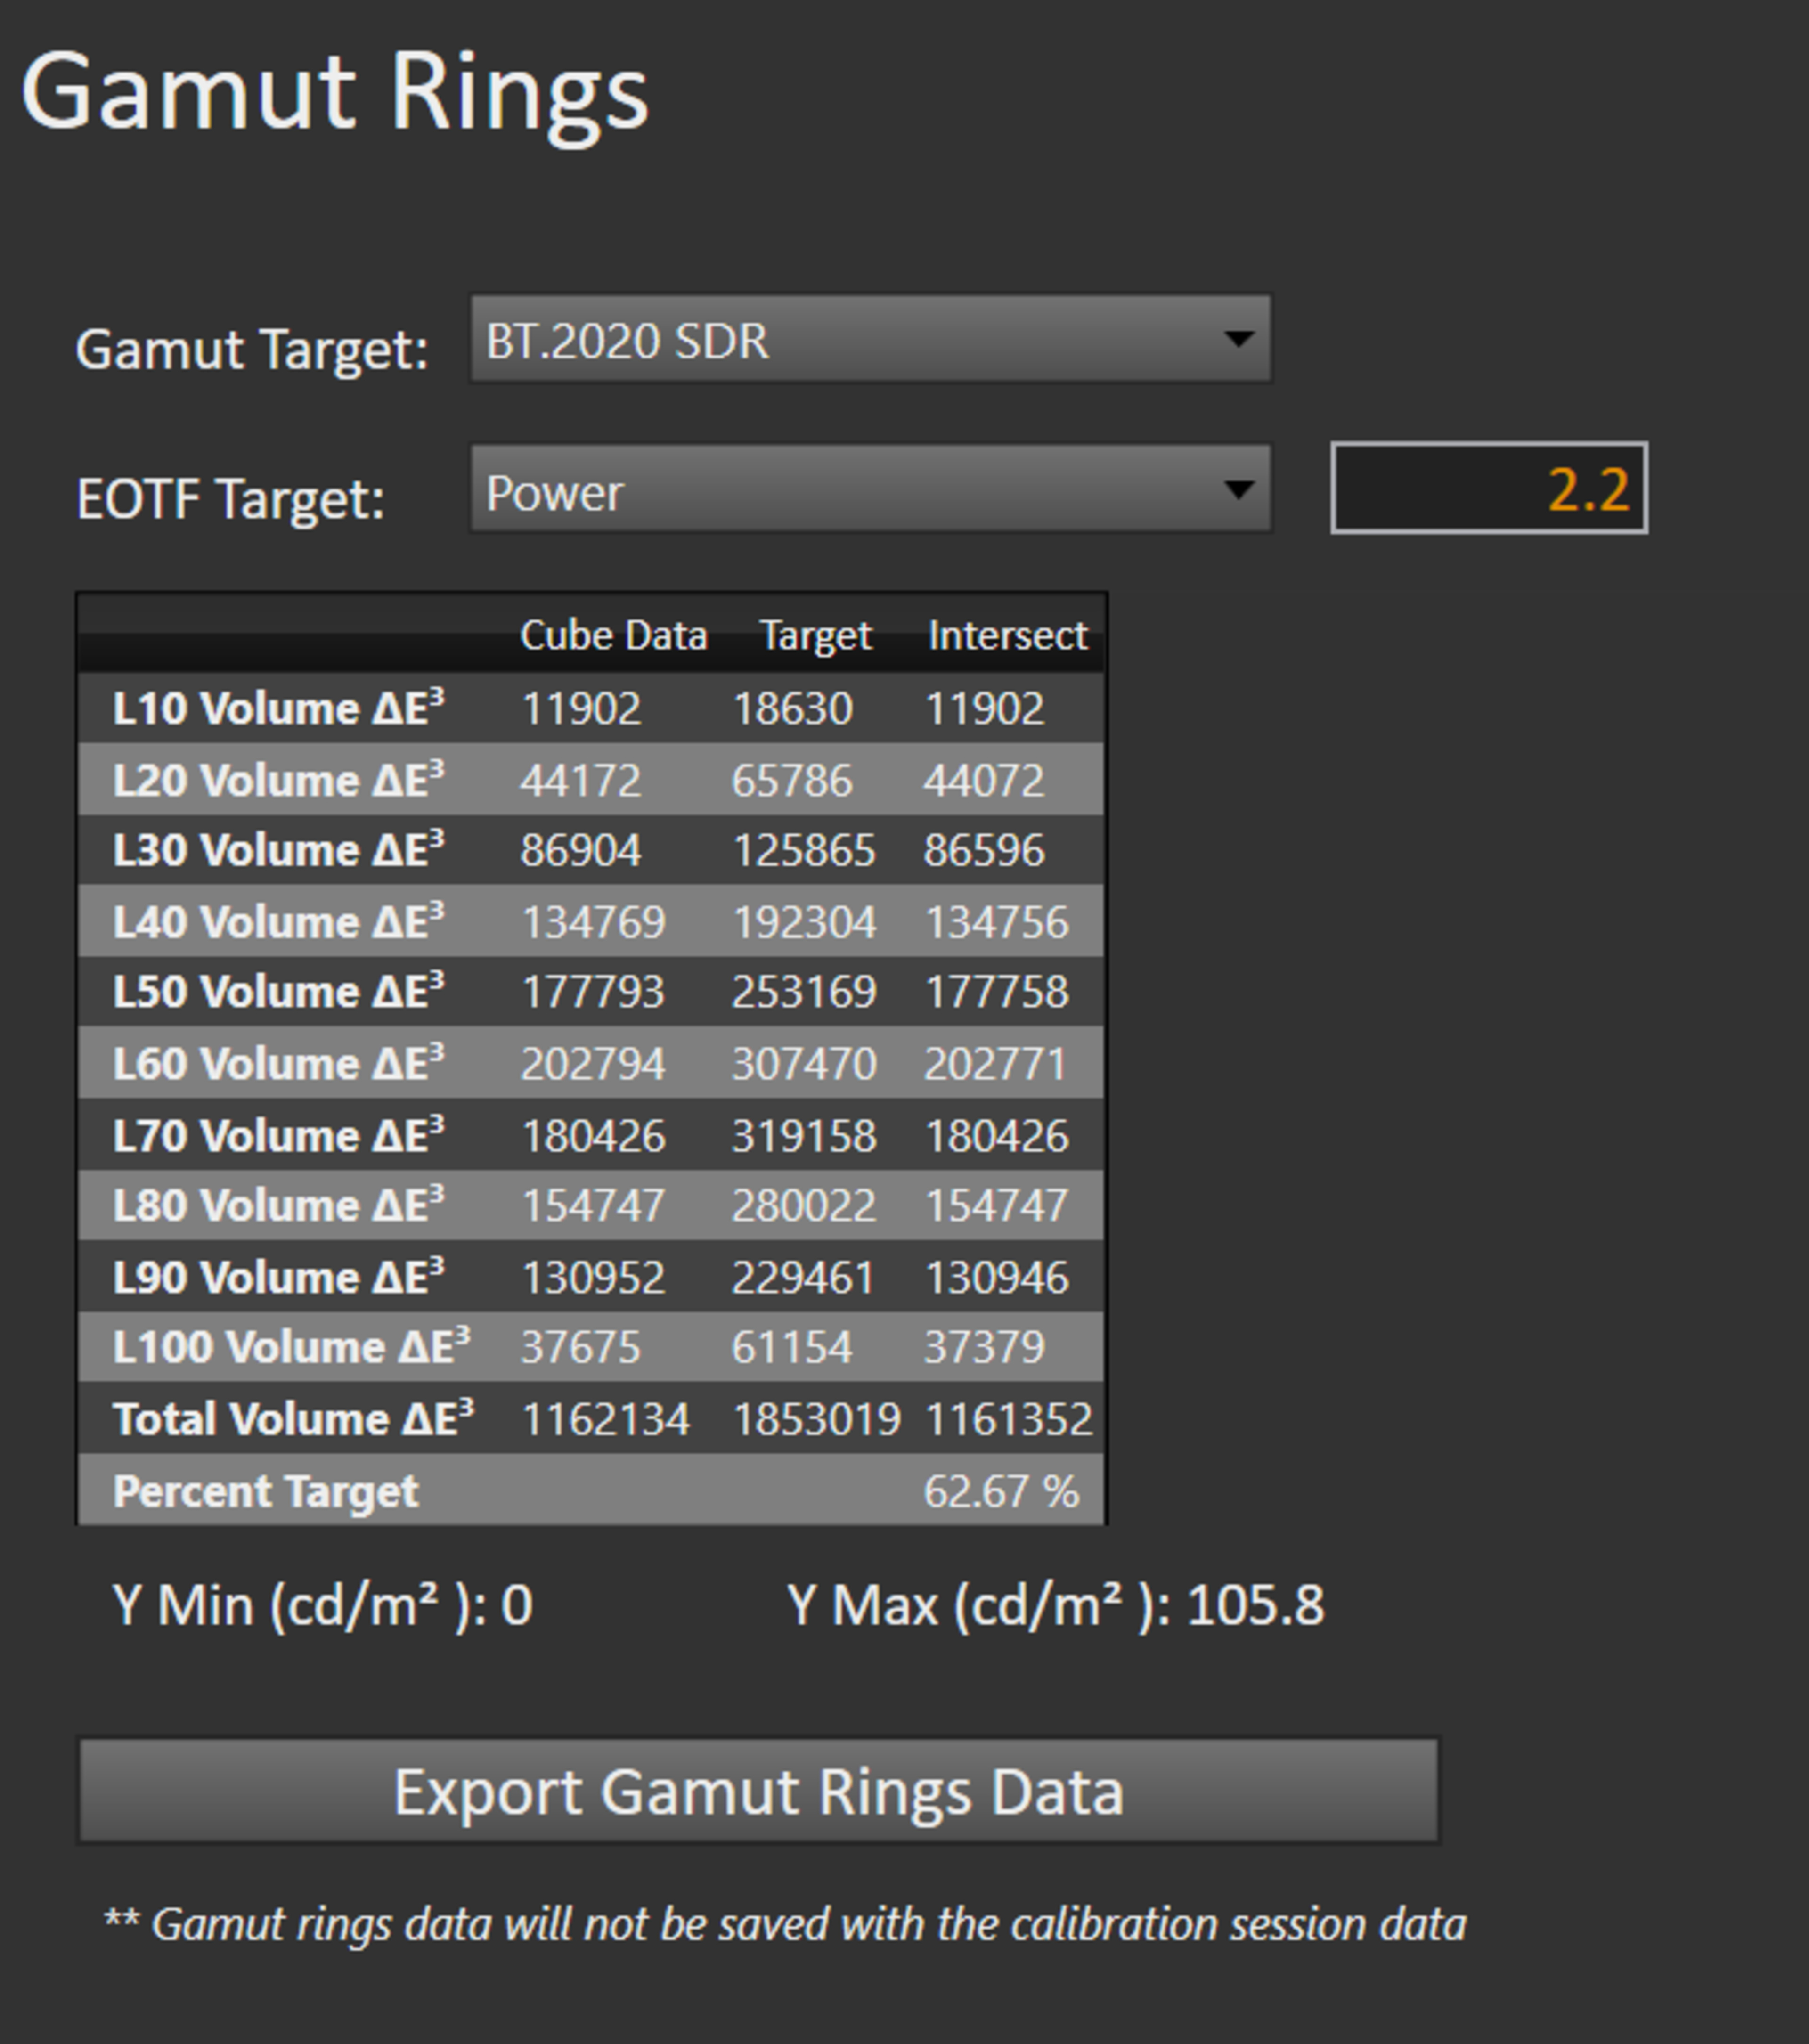
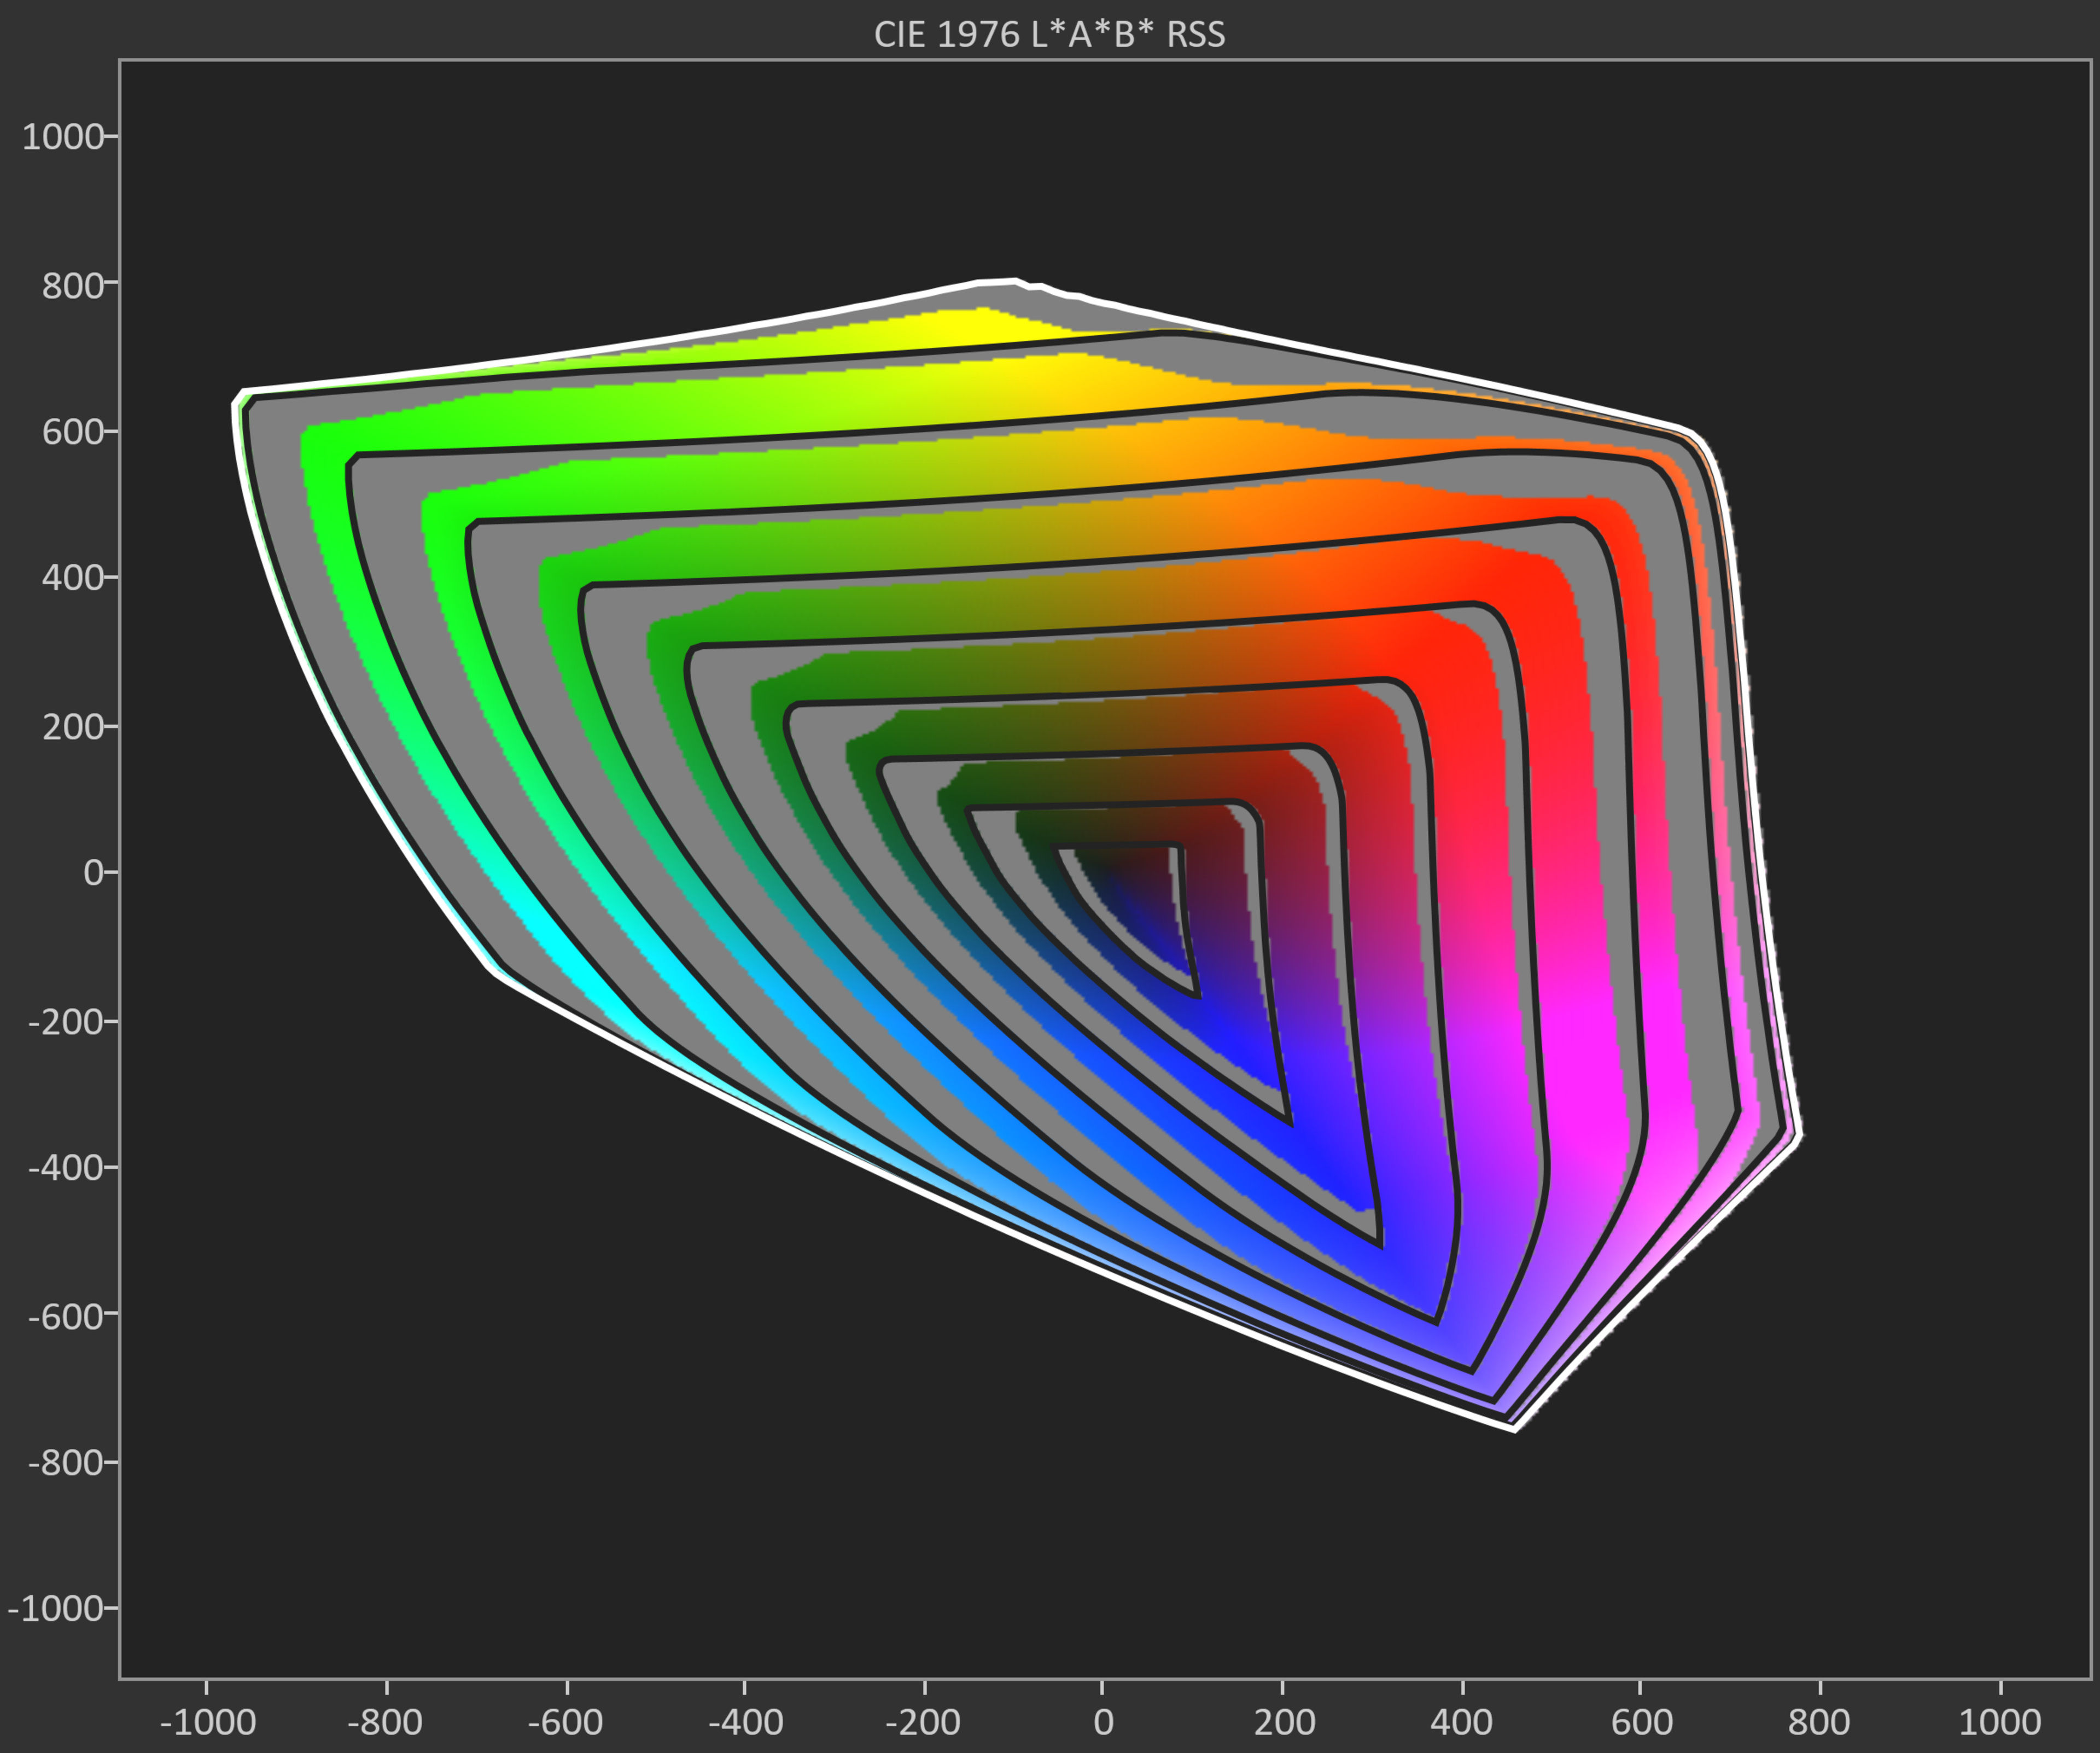
CIELAB BT.2020 Coverage
Since the data for both color spaces is generated when the initial measurements are taken, there are no additional steps for the BT.2020 color space. By looking at the data, we can see that the Panasonic Z85A covers 62.67% of the BT.2020 color space. The 2D diagram shows that even with darker colors, the TV struggles a bit. However, we can plainly see that as colors become lighter, the TV's coverage of each individual ring decreases drastically.
| Data | Final Results Visualized |
 |  |
Additional Information
The SDR Color Volume test uses the CIELAB color space, which differs from the ITP color space we use for the HDR Color Volume test. As of the time of this article's publication, the general consensus is that ITP should be used to analyze the color performance of displays in HDR using the PQ EOTF. On the other hand, the general consensus is that CIELAB is appropriate for characterizing the color performance of displays in SDR. The primary reason is that CIELAB doesn't use brightness, but rather Lightness (L*).
At its maximum value, L*=100 should be equal to diffuse white, meaning the white level to which the observer is adapted when watching content. In SDR, the consensus value for this is 100 cd/m². CIELAB doesn't have a defined value above L*=100, and there is no consensus on the luminance level of diffuse white in HDR, so CIELAB is best suited for SDR.
It's important to note that the industry is constantly evolving, and there are regularly new developments in evaluating a TV's color performance. We want our tests to be as useful and up-to-date as possible, so we keep a close eye on breakthroughs in the academic field. For example, there's currently uncertainty in the industry about whether gamut rings are appropriate for HDR color performance. If the general consensus shifts, we would be completely open to exploring HDR gamut rings.
Conclusion
Our SDR color volume test shows how well a TV can display the range of colors in the DCI-P3 and BT.2020 color spaces. With whites calibrated to 100 cd/m², you can see the exact percentage of colors a TV can show in each of these wide color spaces. Instead of looking at a complicated 3D graphic, gamut rings allow you to see the range of colors a TV covers in SDR with a simple 2D diagram.
Acknowledgments
We'd like to acknowledge Dr. Kenichiro Masaoka of the NHK for his pioneering work in developing gamut rings. His contributions have significantly advanced our understanding of color gamut visualization, helping researchers and industry professionals analyze and compare color reproduction more effectively. We would also like to acknowledge Dr. Euan Smith for the development of the gamut rings intersection diagram we use in this test.
Recommended Articles


Comments
Our TV Picture Quality Tests: SDR Color Volume: Main Discussion
What do you think of our article? Let us know below.
Want to learn more? Check out our complete list of articles and tests on the R&D page.
- 21010
Thanks for the explanation about switching to DCI-P3/REC2020. I don’t understand though how a display could score so well in HDR color volume while doing only so so in SDR. Can you elaborate?
Hi chairman_mao,
Great question!
Aside from differences between the ITP and CIELAB color spaces, much of the discrepancy comes down to how we score HDR vs. SDR Color Volume.
In the case of HDR Color Volume, 100% of the score is based on a TV’s color performance when receiving a 10 000 cd/m² BT.2020 signal. As you may expect, covering 100% of BT.2020 @ 10 000 cd/m² isn’t something we’re likely to see anytime soon in any consumer display. Most TVs have a rather limited coverage of 10 000 cd/m² BT.2020; in fact, the best we’ve tested so far is the Samsung S95D QD-OLED and it got 59.4%. The scoring spline used for HDR Color Volume is thus very lenient.
On the other hand, for SDR Color Volume, we test at a reference white point of 100 cd/m², which any TV can achieve. The scoring splines used for CIELAB DCI-P3 and BT.2020 are thus significantly harsher than the one we use for HDR Color Volume, since we should expect most TVs to at least perform acceptably in this test.
So in short, the apparent scoring imbalance often reflects how we tune our expectations: our SDR Color Volume testing assumes mature performance, while our HDR Color Volume testing still accommodates significant room for growth. As display tech keeps improving, we plan to revisit the HDR Color Volume scoring to gradually make it more demanding.
Hope this clears it up! Feel free to reach out if you have more questions or suggestions.
- 21010
Thanks for the explanation about switching to DCI-P3/REC2020.
I don’t understand though how a display could score so well in HDR color volume while doing only so so in SDR. Can you elaborate?
- 21010
Rtings, I like the Gamut Ring measurement idea and commend the update. Despite the explanation, I don’t quite understand why you are measuring DCI-P3 and Rec2020 for SDR color volume. It seems like BT601 and BT709 color space would make more sense for SDR, and that most readers might confuse the Gamut Ring as representing the HDR color space.
Admittedly, it’s possible one could be watching 4K SDR content with wide color, but that seems less frequent than SD or HD content. I don’t have a sense of how many SDR video games would use wide color – can you provide some context and examples? It also makes sense to cap the brightness at 100nits (though it does seem unlikely that a user will do the same) as some HDR TVs do not maximize the SDR brightness at the same level as HDR, but in a TV that offers local dimming, is that 100 nits measured on a small window, which represents a peak brightness, or on a full field white? Thanks,Hi Amazon_Fan,
Thanks for taking the time to reach out and share your thoughts on our new SDR Color Volume test—we really appreciate your detailed feedback and questions!
You’re absolutely right that BT.601 and BT.709 are the standard color gamuts for SDR content. However, one of the key reasons we opted to use DCI-P3 and BT.2020 for our new SDR Color Volume test is that modern TVs already cover BT.709 so completely—often 100%—that measuring within that gamut offers little to no differentiation between models, even lower-end ones. In contrast, using larger color gamuts like P3 and BT.2020 allows us to highlight differences in color rendering capabilities between displays in SDR picture modes.
It’s true that traditional SDR content rarely exceeds BT.709. But there are still relevant scenarios where a TV might display colors outside of BT.709 in SDR picture modes. For instance, some users choose to set their TV to a wider gamut manually by personal preference, a notable one is when gaming in SDR to get more saturated colors (e.g., setting the TV to P3 color when using a Nintendo Switch which outputs BT.709). In regular video content, it’s possible that some pixels on screen may fall beyond the limits of the BT.709 color space, depending on how it was encoded. This is something we also often see in HDR, where a lot of content mastered in P3 will have pixels falling into BT.2020 territory. We’ve updated the test’s tooltip to make this nuance clearer—thanks for bringing it to our attention!
The brightness cap at 100 cd/m² is intentional since it’s the reference diffuse white point for SDR content. More importantly however is the fact that it’s a luminance output any TV can easily reach, which is crucial to ensure the comparability of our gamut rings results. At different diffuse white luminance points, results lose their comparability as the measured coverage of the color spaces will differ. We measure it with a test window with constant APL to ensure brightness stability across TVs, especially OLED models.
At a broader level, the motivation behind adding SDR Color Volume isn’t about emphasizing the presence of wide color in SDR content itself, but rather addressing a gap in how we assess color volume. Our current HDR Color Volume test uses the ICtCp (ITP) color space, which is excellent for HDR but not applicable to SDR gamma transfer functions. This means our HDR Color Volume results only reflect performance in HDR picture modes. Gamut Rings, however, are specifically suited for SDR gamma, making them ideal for evaluating SDR modes regardless of the color gamut of the content.
We’re also closely following industry efforts to expand Gamut Ring methodologies for HDR applications. There’s promising work underway, but no finalized standard yet. Until then, combining SDR and HDR Color Volume results provides the most complete picture of a TV’s overall color output capability, across all picture modes and content types.
I hope this gives you clearer insight into why we designed the test the way we did, and we’re grateful for your thoughtful engagement with it.
Cheers
Edited 2 months ago: Typo - 21010
Rtings,
I like the Gamut Ring measurement idea and commend the update. Despite the explanation, I don’t quite understand why you are measuring DCI-P3 and Rec2020 for SDR color volume. It seems like BT601 and BT709 color space would make more sense for SDR, and that most readers might confuse the Gamut Ring as representing the HDR color space.
Admittedly, it’s possible one could be watching 4K SDR content with wide color, but that seems less frequent than SD or HD content. I don’t have a sense of how many SDR video games would use wide color – can you provide some context and examples?
It also makes sense to cap the brightness at 100nits (though it does seem unlikely that a user will do the same) as some HDR TVs do not maximize the SDR brightness at the same level as HDR, but in a TV that offers local dimming, is that 100 nits measured on a small window, which represents a peak brightness, or on a full field white?
Thanks,
Edited 2 months ago: Edited for clarity