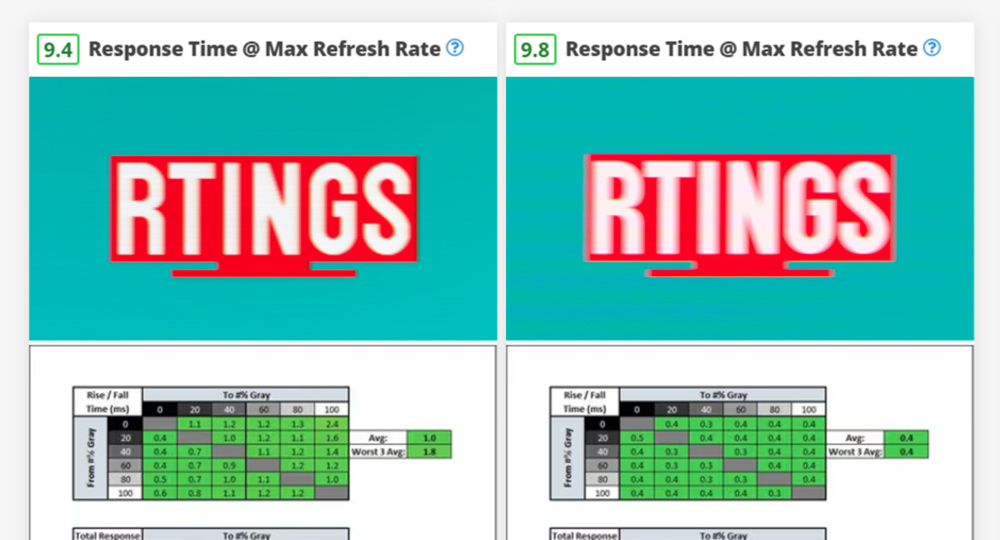
Everyone at RTINGS.com is incredibly excited by the new, extremely detailed response time testing in our Test Bench 2.0. However, reading, interpreting, and using these results to compare different monitors, from VA to IPS to OLED, can be a real challenge. They say a picture is worth a thousand words, but a good picture—a pursuit photo—could be worth a thousand response time measurements! This is the first part of two to cover our new testing, and you can read about the second part here.
On top of this new pursuit pattern, we've changed several tests and testing procedures in Test Bench 2.0, too. We're now using gamma-corrected response times to measure Cumulative Absolute Deviation (CAD) with more transitions for more comprehensive motion testing. We've also added tests for motion performance across a monitor's VRR range, its refresh rate compliance, and VRR flicker, which we'll cover in part two of these articles. All these new tests have also changed our scoring system to include performance scores, and you can see all the changes in the Changelog.
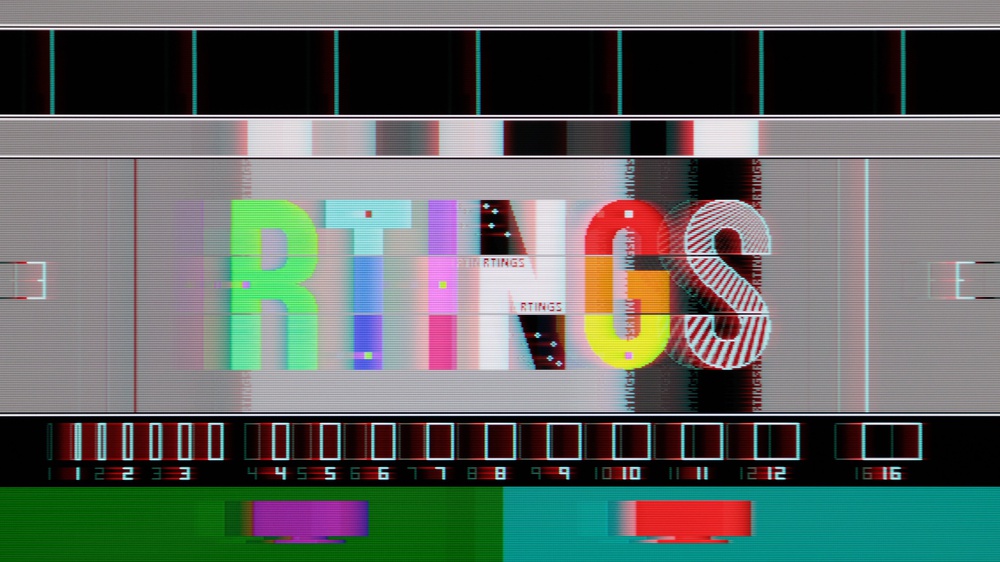
Pursuit photography is an amazing tool that bundles all that myriad response time data into something easy to see, interpret, and compare. We designed our new pursuit pattern specifically to do just that. You can even check out an interactive version of our pursuit pattern to get a better understanding of your monitor's motion handling performance.
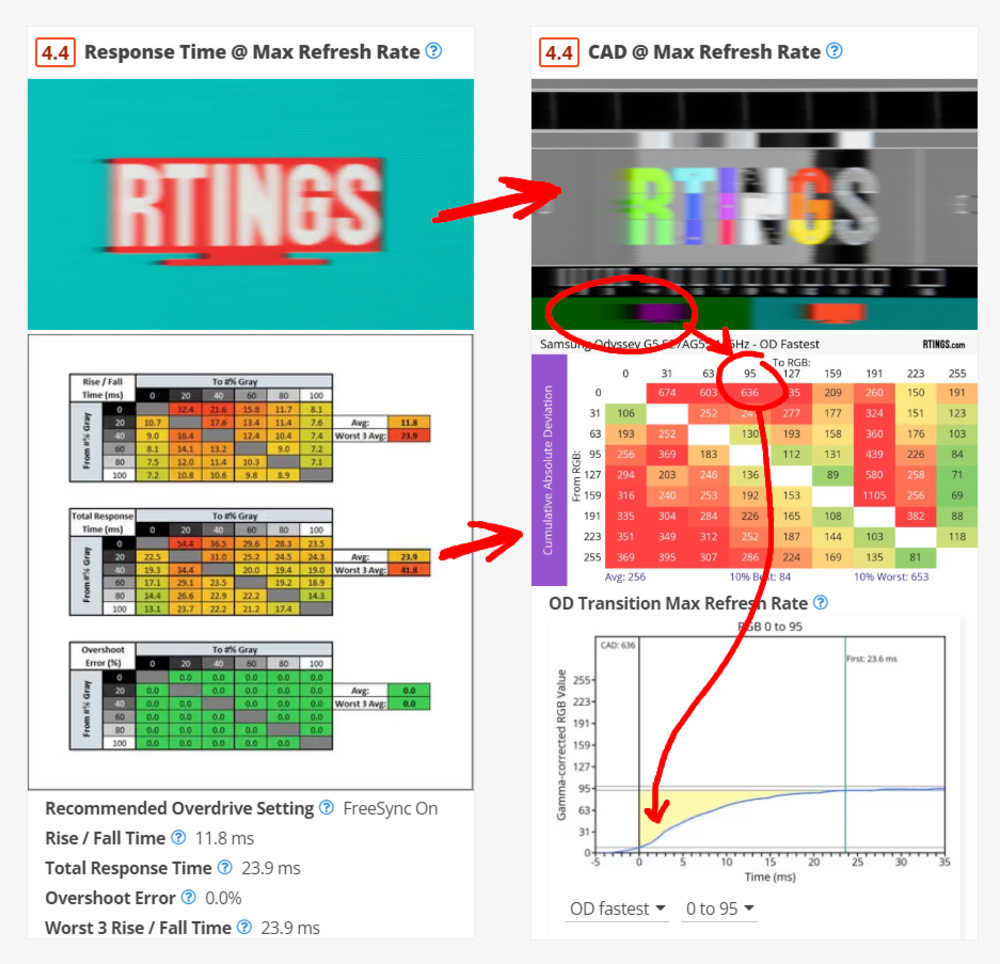
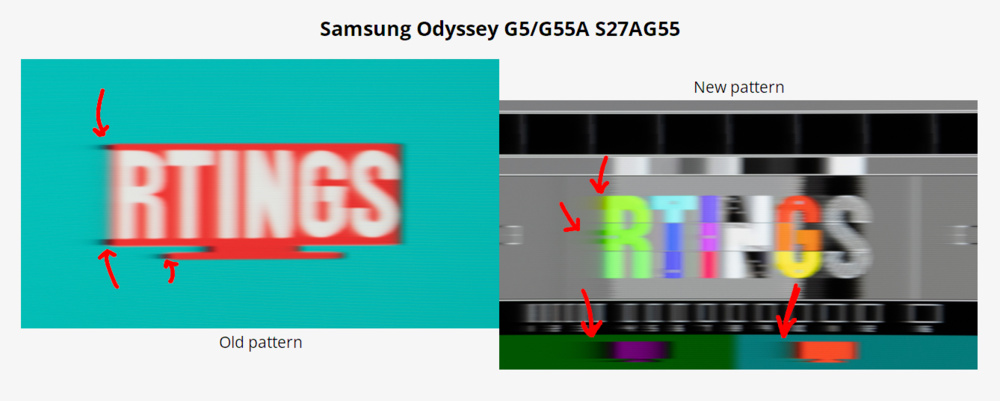
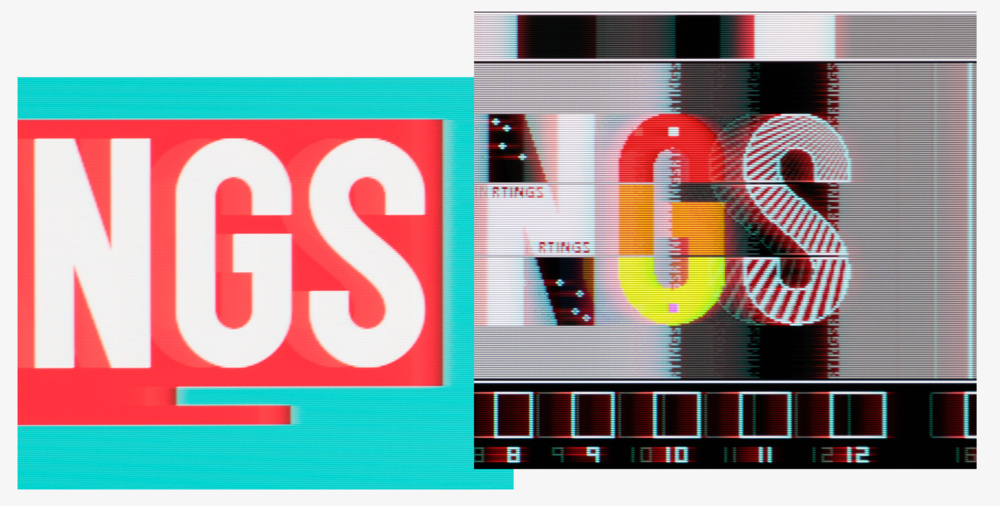
Samsung Odyssey G5/G55A S27AG55: Old vs new pursuit photo
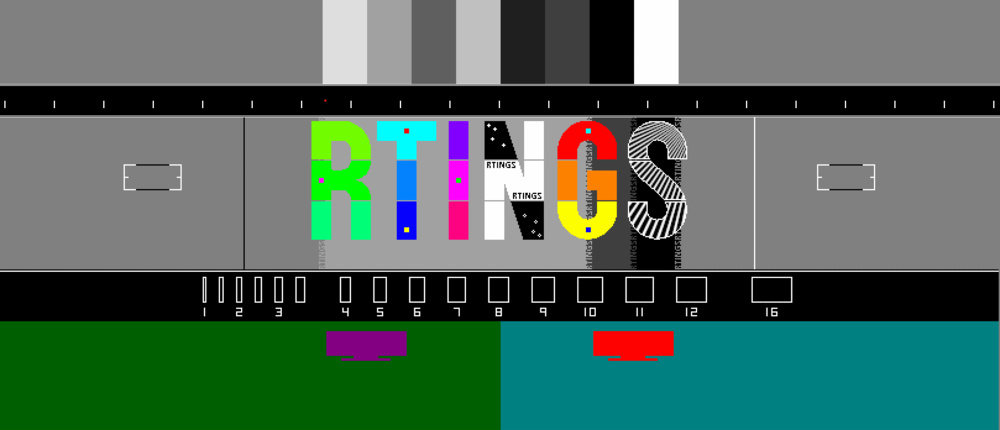
The new pattern represents a substantial improvement from the red, cyan, and white RTINGS logo we've used for many years, and it incorporates many new features and aspects that'll help us make finer distinctions between monitors. It may look complicated, but each element is there for a reason.
This article will cover the problems with our old pattern and the research we undertook to understand and remedy those issues. We'll also look at the unique characteristics of the new pursuit pattern that enable us to capture unusual or unexpected panel behavior for OLED, VA, IPS, and even TN panels, the pixel-level details we added to capture persistence blur differences between ever-faster gaming monitors, and how all of these aspects can help us make sense of response times.
The Blur Busters Law And MPRT
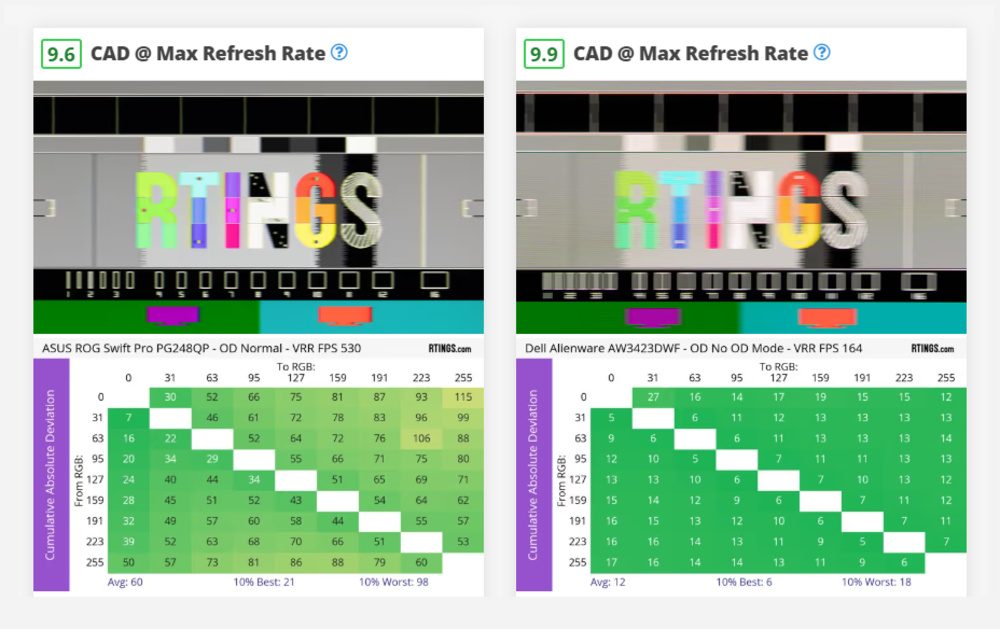
ASUS PG248QP at 540Hz blur compared with the Dell Alienware AW3423DWF
We use the same process to capture all the pursuit photos on our site, from monitors to televisions and even laptops.
For each display, a moving test pattern is panned horizontally across the screen, and we then precisely match this speed with a high-resolution camera attached to a slider. Once the pattern and camera move at identical speeds, like we do when we track the pattern with our own eyes, they capture a photograph, and the resulting pursuit photo serves as an excellent visual match for the blur we see.
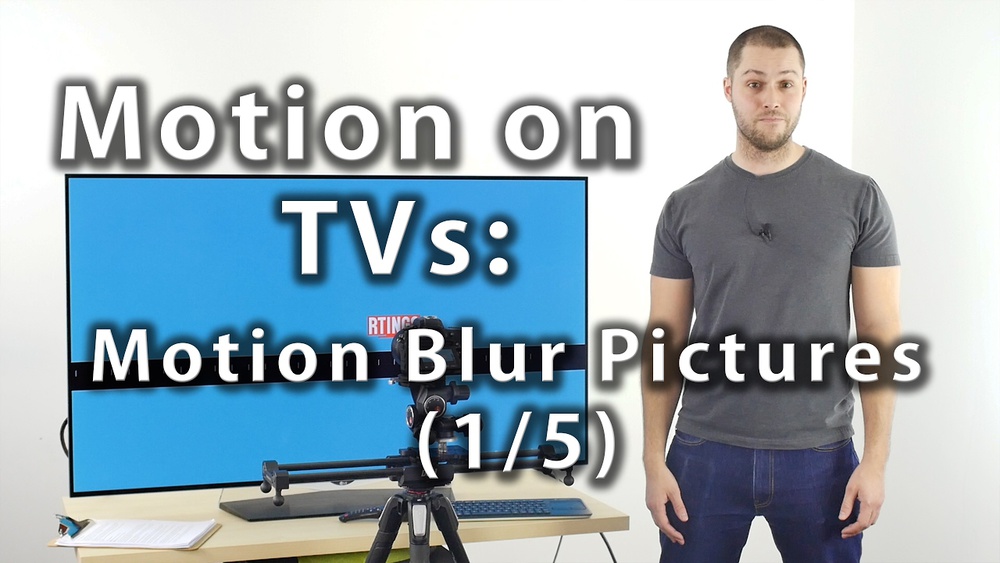
Why go through all this trouble? This eye-tracking blur, or persistence blur, is the most important characteristic of a display's motion performance, and it isn't something you can capture with a camera in a fixed position. For more information on how we capture these pursuit photos, you can check out this video from way back in 2017:
RTINGS.com's pursuit photo explanation/demonstration video
Surprisingly, most of the blur we capture in these photos isn't from slow response times, except in some specific circumstances, which we'll get into soon! Two primary factors govern the amount of blur we capture and see:
- The amount of time the display holds its image is stationary as our eyes (and camera!) track past.
- How fast the pattern moves.
The first is relatively straightforward for all modern sample-and-hold displays: a display's persistence is equal to its frame time. For example, a 60Hz display will always show each frame for 16.67 milliseconds. A faster 120Hz display will cut that time in half, down to 8.3 milliseconds. As the refresh rate or frame rate increases, each frame is held in place for a shorter and shorter duration, leading to less eye-tracking blur!
The second equally important factor is speed. The faster the pattern moves, the more blur we see. This is intuitively true, right? If the pattern were stationary, we'd see no blur at all.
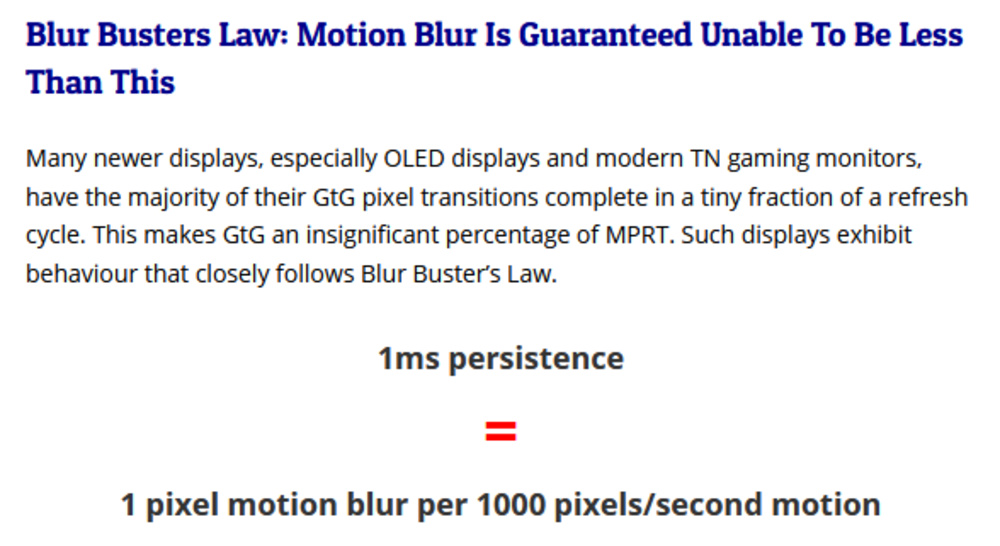
These two factors can be formalized with Mark Rejhon's Blur Busters Law. The Blur Busters Law states that displays with one millisecond of persistence will show 1 pixel of motion blur when a pattern pans at 1,000 pixels per second (PPS).
Blur Busters Law for motion blur on panning test patterns
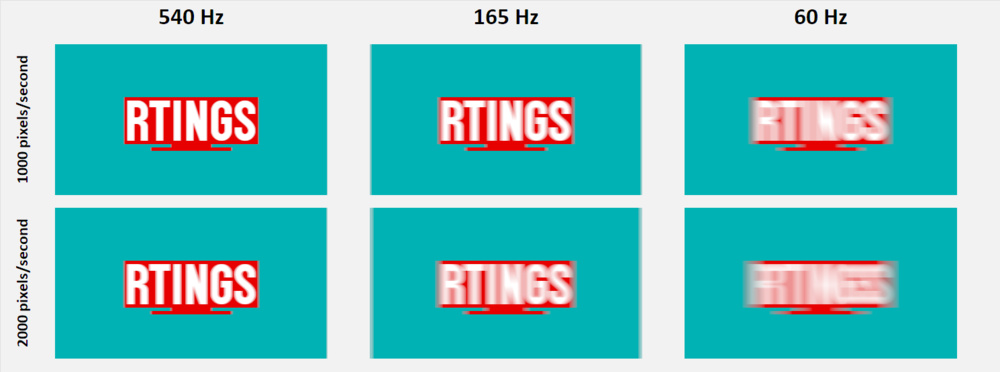
This law tells us the amount of pixel blur visible when eye-tracking or capturing pursuit photos of a moving test pattern at any panning speed. Going back to our 60Hz example, any display that holds its image for 16.67 milliseconds (equivalent to 16.67 ms of persistence) would thus have 16.67 pixels of motion blur when tracking a pattern moving at 1,000 pixels/second.
The ultra-fast ASUS PG248QP 540Hz monitor displays 16.7 pixels of blur at 60Hz in our pursuit shot when panning at ~1,000 pixels/second, 33.3 pixels of blur at ~2,000 pixels/second
How fast does our RTINGS.com pattern pan? Following the lead of Blur Buster's TestUFO.com, the industry conformed to 960 pixels per second.
If you see a pursuit shot from any review, be it a text review or a YouTube video, even one of ours, it was likely taken with the pattern moving at 960 PPS. And while 960 pixels per second may seem fast (it tracks across the full width of an FHD screen in only two seconds!), as gaming monitors ship with higher and higher refresh rates, with consequently lower and lower persistence blur, the limits of our current testing speed are becoming clearer.
Based on the magnification we use when capturing pursuit shots for our reviews, the nearly 17 pixels of blur at 60Hz persistence is easily visible, even at thumbnail size. But we've begun to run into a problem as displays get faster and faster. If we continue to run our test pattern at 1,000 pixels per second:
- A 540Hz monitor, with 1.9 ms of persistence, will have 1.9 pixels of blur in our pursuit shots.
- A 175Hz monitor, with 5.7 ms of persistence, will have 5.7 pixels of blur in our pursuit shots.
- A 60Hz monitor, with 16.7 ms of persistence, will have 16.7 pixels of blur in our pursuit shots.
At a glance, the distinction between a remarkably fast 540Hz monitor and a standard, high refresh rate 165Hz monitor doesn't suitably match our experience of the stark and profound difference in motion clarity of each. Because each monitor has a fixed persistence based on its max refresh rate, the only way to increase the apparent blur is to move the pattern faster! Doubling the pattern speeds also doubles the pixel blur. That's the utility of using the Blur Busters Law.
We Built An MPRT Indicator Into The Pattern
Double strobe artifact in the MPRT indicator for the BenQ ZOWIE XL2566k at 60Hz
The Blur Busters Law also gives us a way to calculate the panning speed required to show differences in persistence below one millisecond, which is common with backlight strobing modes. At 1,000 pixels per second, any persistence less than one millisecond produces less than 1 pixel of blur. For example, a pursuit photo of a CRT with less than 0.3 ms of persistence would look nearly identical to an LCD with a backlight being strobed for 1 ms, even though the CRT is much clearer in practice.
Doubling the speed to 2,000 pixels per second allows distinctions to be made down to 0.5 ms of persistence. Doubling the speed again to 4,000 pixels per second increases the precision of persistence we can capture with the pursuit photo now to 0.25 ms. However, camera tracking becomes very difficult at that speed, especially for FHD monitors.
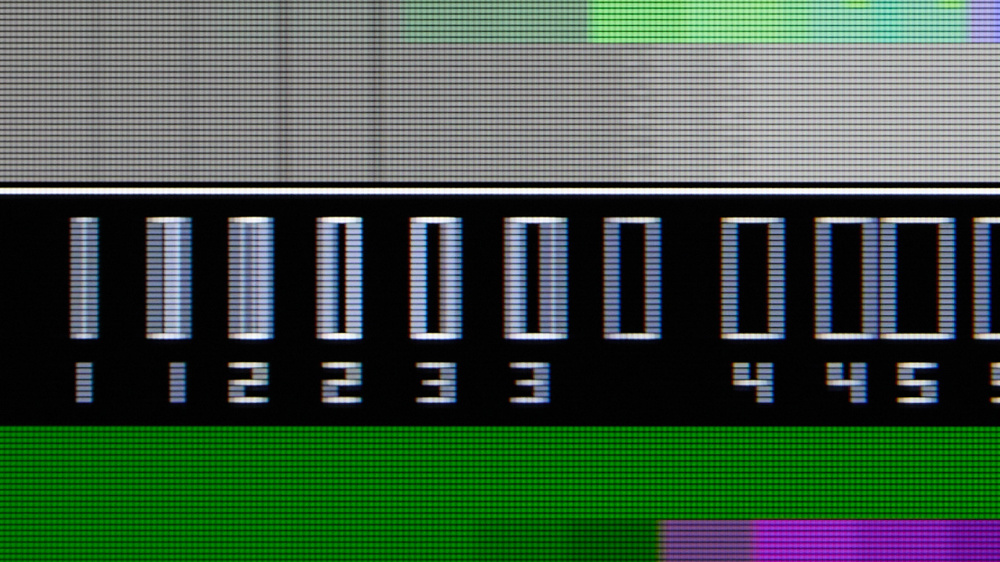
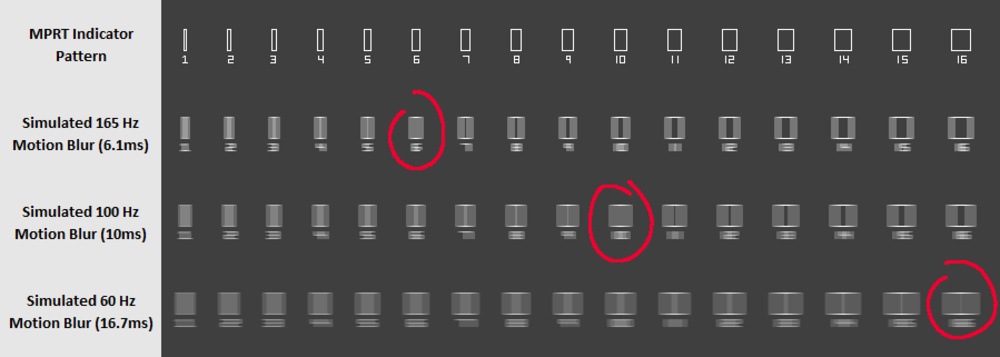
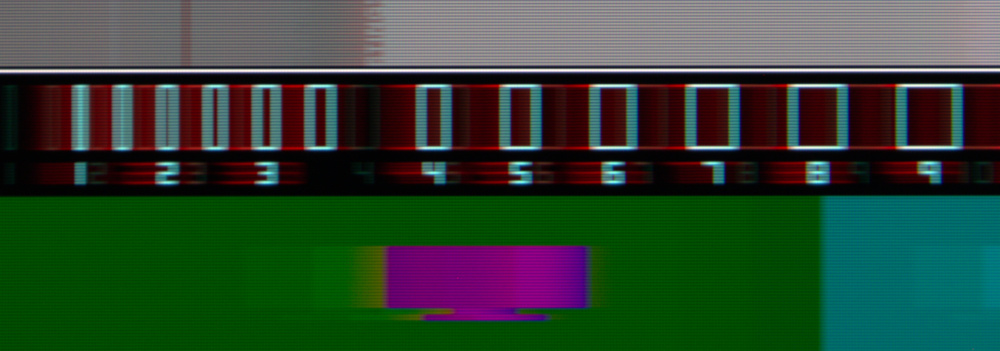
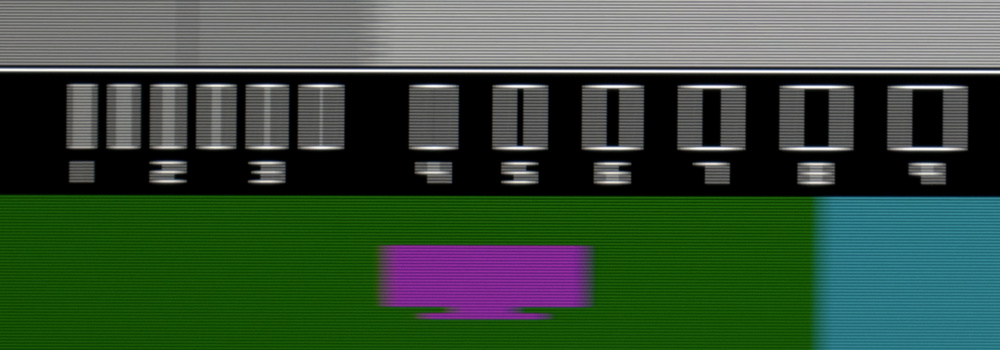
Without zooming in and pixel-peeping each of our pursuit shots to count the blurry pixels, is there an easier way to directly see MPRT (Motion Picture Response Time), or persistence, in the shots? We can make use of the fact that two vertical lines separated by X pixels will exactly converge if the persistence in milliseconds is also X. It sounds confusing, but it's easier to see with an example. The following pattern builds on the work of Josip Reponj and has 16 boxes whose sides are spaced from 1 to 2 to 3 all the way to 16 pixels apart.
For a 165Hz monitor, the walls of the box labeled "6" will cleanly converge due to the six milliseconds of persistence blur. The boxes labeled 1-5 will have over-converged, and boxes 7 through 16 under-converged. Similarly, this MPRT indicator can measure the persistence blur at 100Hz or 60Hz. Notice that at 60Hz, the 16 ms box is slightly over-converged because the frame time is slightly longer than 16 milliseconds.
Doubling the panning speed now to 1920 pixels/second with a small change to the pattern allows us to assess persistence in finer increments. To verify this technique works, we added the MPRT indicator to the pattern and tested the ViewSonic XG270QG, which has a strobing mode with variable pulse timing. With its pulse width set to 100, the pulse time, and hence its MPRT, equals 1.8 milliseconds. Here's the result of our pursuit tracking showing over-convergence at 1.5 ms and under-convergence at 2 ms. The MPRT indicator also does a fantastic job of showing the KSF phosphor trail.
Pursuit photo of the ViewSonic XG270QG at 120Hz backlight strobing, Pulse Width 100. MPRT pattern indicates persistence between 1.5 and 2 ms.
We also tested the pattern with various other monitors at different refresh rates. The Corsair XENEON 27QHD240 shows excellent convergence of the 4-box, indicating that this pursuit shot was captured with the monitor at 240 fps, which has persistence of around 4ms.
Pursuit photo of the Corsair XENEON 27QHD240 at 240Hz. Pattern convergence at box 4, indicating ~4 ms of persistence.
Building the MPRT indicator into our new pursuit pattern allows us to tag pursuit photos with their captured frame rate. We can immediately see what framerate the photo was taken at without reading the filename or even knowing where the picture came from. It also allows us to compare the pursuit photos more easily for monitors with different max refresh rates. Along with increasing the panning speed to 1920 pixels/second, this will allow us to showcase pulse duration MPRT differences in backlight strobing modes, something we're excited about.
Purple And Green: The VA's Worst Nightmare
One component of the RTINGS.com pattern that does work reasonably well to distinguish between panel types, especially slow VA panels, is the dark "shadow" visible on the red-to-cyan transition. When using the compare tool on the site to see side-by-side pursuit shots, this will likely be the biggest differentiator between the performance of IPS (or OLED) and VA panels. In our experience, we've also found that dark smearing, or the poor motion performance that some VA panels exhibit in dark scenes, correlates well with this artifact in the pursuit shots. If you see this trailing on the RTINGS logo, it'll likely be worse in dark games. But the red/cyan transition isn't the best way to capture this weakness! Purple on green is even better!
Samsung Odyssey G5/G55A S27AG55 pursuit photo showing extreme dark trailing in red/cyan transition and new purple/green transition
To improve our pattern's ability to show the slow, smeary dark transitions that many VA panels exhibit, we first needed to find suitable VA candidates to test, and our monitor comparison tool was a great place to start. One monitor stood out: the Samsung Odyssey G5/G55A S27AG55, a 165Hz 27-inch VA panel that scores so badly in our new response time testing that its Cumulative Absolute Deviation (CAD) is literally off the charts.
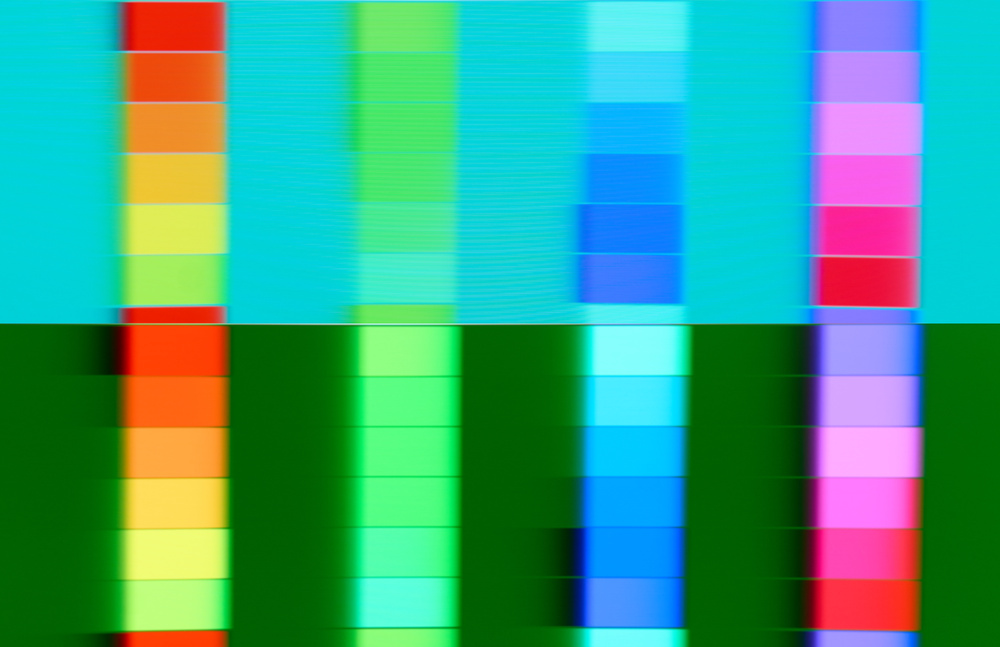
Next, we created a Python script to generate test patterns using a large variety of background colors and shades, from cyan to dark blue to maroon. With the G5 in our camera's sights, we methodically captured the smearing behavior via pursuit photography, and an unexpected discovery was made: using a dark green background, RGB(0, 0, 95), every hue from red to purple to blue displayed a deep, contrasty shadow in its wake, and the shadowy trail persisted well behind the color patches. The dark green background also works as well or better than the cyan background does for red to show the same trailing behavior!
Pursuit photos of various pattern background colors on the Samsung Odyssey G5. Dark green shows significantly more smearing than other colors.
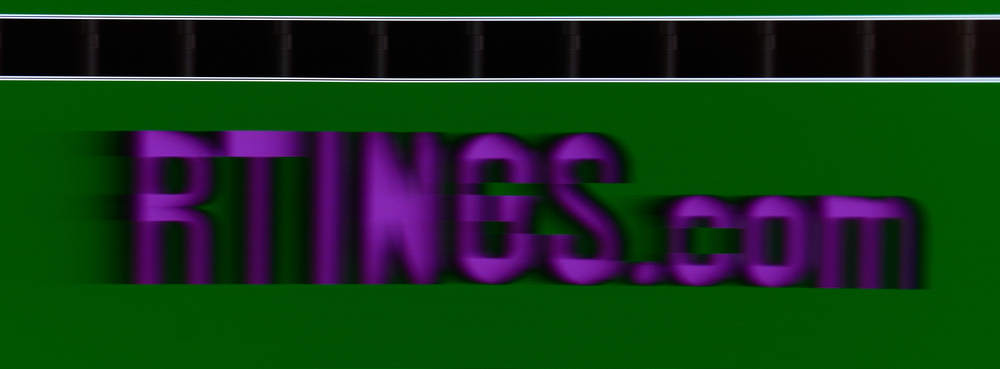
While this may look bad on this specific test pattern, how does it look in person? We quickly constructed a new test pattern that included a large, purple RTINGS.com logo against a green background and captured the following video of the G5 with the pattern in motion. We grabbed a few experienced employees to see what they thought of the performance, and they almost couldn't believe that the logo didn't have a dark border around it! Only after we stopped the motion of the pattern could they see that it was truly only two colors: purple and green.
Substantial dark trailing exhibited by the Samsung Odyssey G5 S27AG55
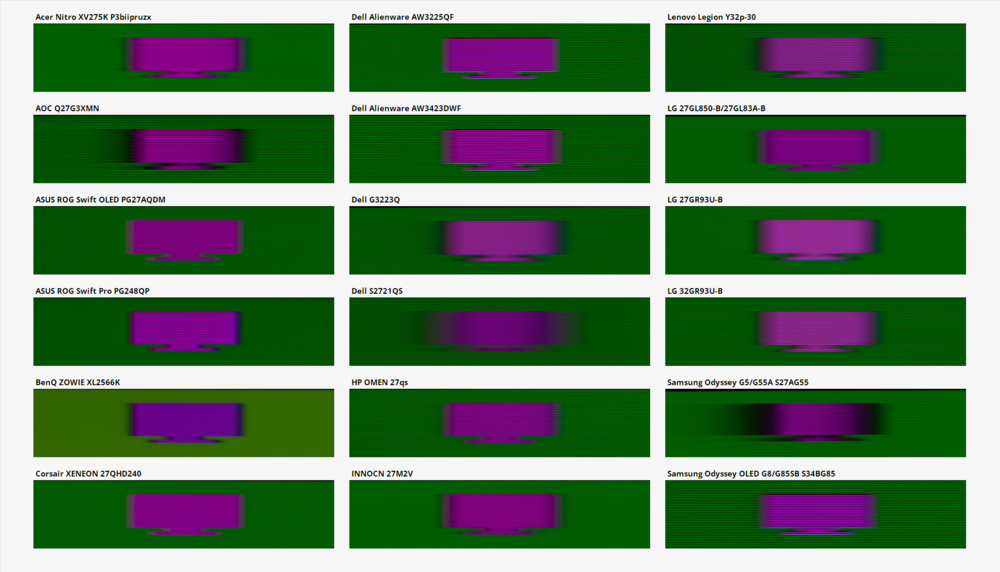
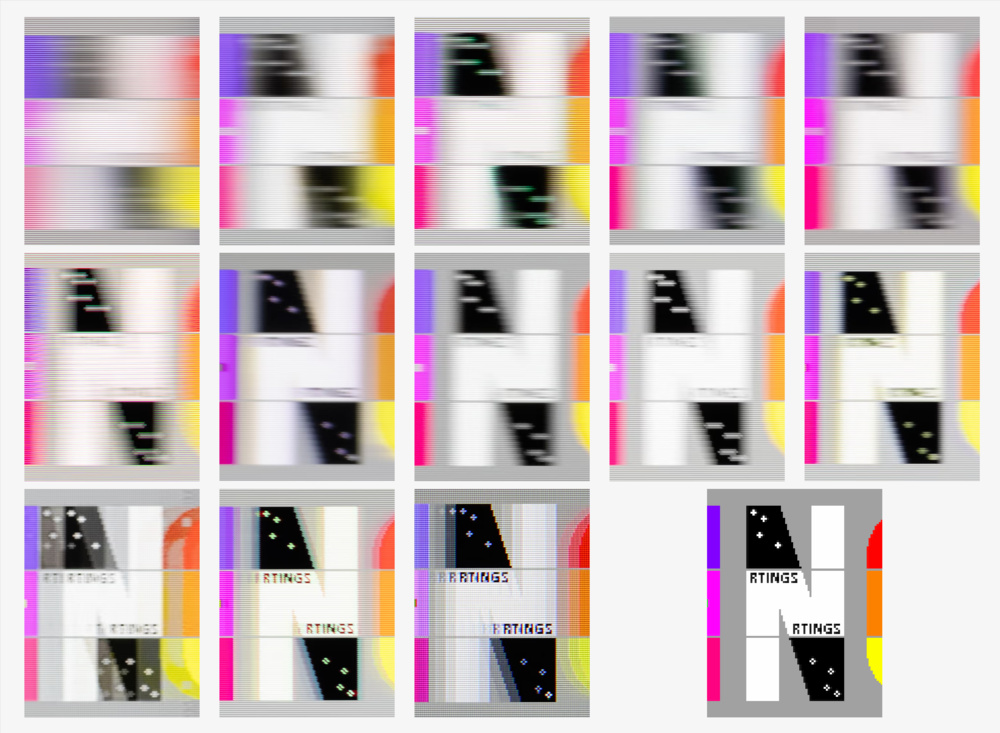
Right then, we knew this color combination had to be part of the new pursuit pattern, so the familiar RTINGS.com television made a comeback appearance, along with the cyan/red transition for legacy comparisons. The following figure has a selection of 18 purple televisions from our first batch of pursuit reshoots. Of these 18 monitors, there are two VA panels. Can you guess which?
100% crops of the purple/green television element in the new pursuit pattern showing distinct dark trailing on the two VA panels
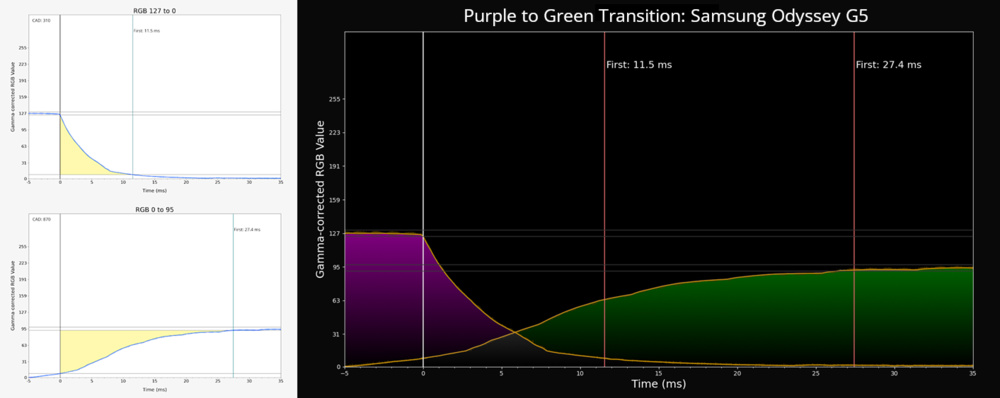
Why does this trailing happen? With our new gamma-corrected response time methodology, we can easily look at the individual responses that make up the purple-to-green transition and chart their behavior over time. Because the pattern is moving from left to right, the trailing edge of the purple letters (or televisions!) must transition from purple, RGB(127, 0, 127) to a dark green, RGB(0, 95, 0). The red and blue subpixels that make up purple both undergo a 127 to 0 falling transition. The green subpixel, however, needs to rise from 0 to 95.
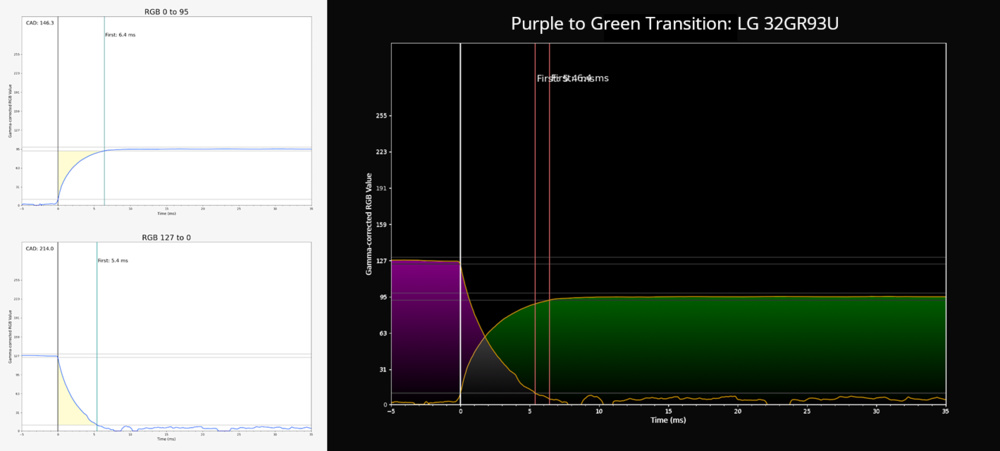
The following figure shows the two transitions and their slow but asymmetrical response times. VA panels tend to have slower rise times than fall times, and the G5 is no exception. We measured the RGB 127 to 0 fall time to be a slow 11.5 milliseconds, but the rise time from 0 to 95 is much worse: 27.4 milliseconds. With the two transitions overlaid, the total, additive light output of purple and green drops to near black while the green subpixel, which was completely dark, very slowly rises to its target level, leaving a long, dark trail. IPS panels, in contrast, typically have more symmetric responses, and their faster and more balanced transitions can reduce or eliminate dark smearing.
Slow, asymmetrical response times for the purple-green transition cause lingering dark trailing on the Samsung Odyssey G5.
The faster, more symmetrical responses on the IPS LG 32GR93U-B lead to much less dark smearing.
The takeaway? Our new pattern and a little purple television on a green background represent a drastic improvement for our pursuit photos to expose the slow dark transitions that often cause motion blur when playing dark games on VA panels.
The Devil's In The Details: What Our Previous Pattern Missed
The ASUS PG248QP's backlight strobing mode has exemplary motion clarity at 540Hz, something that wasn't fully captured with our previous pattern.
Now that our pattern is moving much faster, so fast that we now capture MPRT differences of half a millisecond, we had to address another issue with the RTINGS pattern: the lack of single-pixel detail.
As gaming monitors become faster and pixel persistence becomes lower, we needed some way to differentiate excellent motion clarity from clarity that's merely good. The MPRT indicator provides an excellent starting point, but the pattern itself must include details that are only a single pixel wide. For example, small text elements on a game's UI often follow a character, waypoint, or enemy, and making a quick distinction between friend or foe can be the difference between surviving a tense battle and queueing for the next round to start. Poor motion performance, whether from slow response times or from the inherent persistence blur based on a monitor's refresh rate, can often render these text elements completely unreadable—a mere blur. But it's not just text elements that benefit from increased motion clarity; it's everything that's in motion in a scene!
So, what does it take for a monitor to have CRT-like clarity? That's a question we wanted to answer with the new pattern.
Backlight Strobing: One Path To Crystal Clear Motion
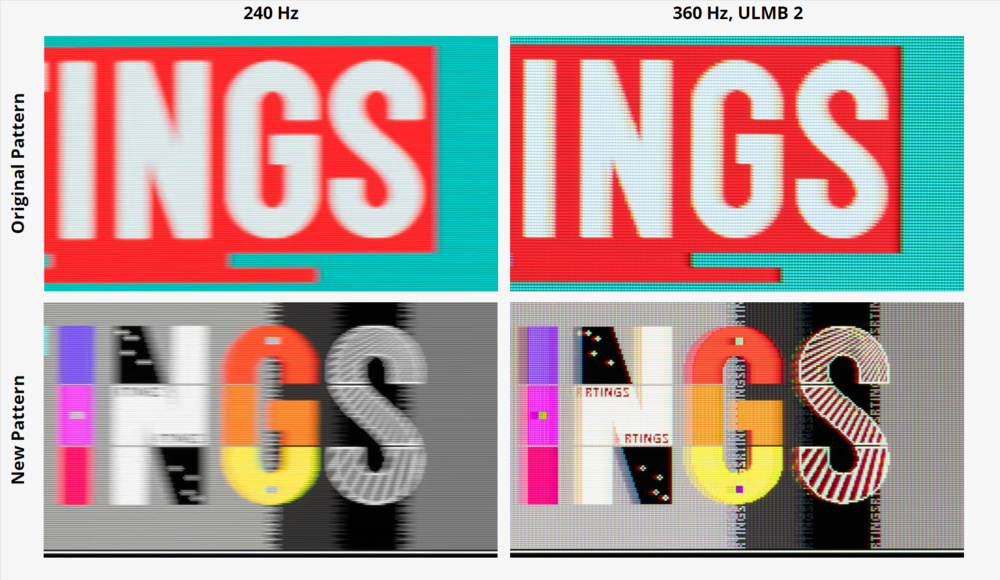
The answer, it turns out, is that persistence blur must always be below one millisecond for exceptional motion clarity. Even OLEDs, with perfect response times, are limited in the clarity they can show by their persistence blur. Happily, this is improving as we're seeing OLEDs begin to ship to with refresh rates beyond 240Hz. To demonstrate how our new pattern can elucidate minute differences in MPRT that we previously missed, we can compare two quite different monitors from ASUS: the PG27AQDM, a 240Hz OLED, and the PG248QP, a 540Hz TN panel. The OLED's motion clarity is limited only by its persistence blur, which, at 240Hz, is 4.17 ms, or around eight total pixels of blur in our new pursuit shots. For this comparison, we'll limit the 540Hz TN panel to 360Hz but use its ULMB 2 backlight strobing mode.
Details in the new pursuit pattern and the faster panning speed elucidate motion clarity differences that weren’t visible with the previous RTINGS.com pattern. Note that the original RTINGS.com pattern's pixel sizes differed based on the panel's resolution.
If we only look at the pursuit shots that were included in the original reviews, we agree that the PG248QP with ULMB 2 does have better motion clarity than the OLED PG27AQDM, but the difference doesn't seem huge, except if you see the monitors in person.
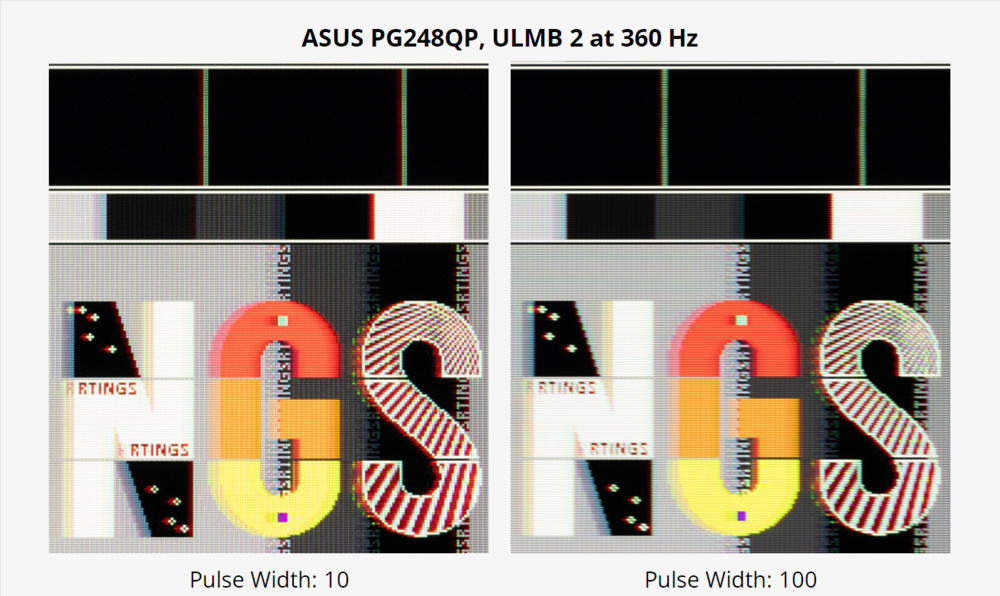
Only with the additional pixel-level detail we created in the new pattern, like the RTINGS.com texts in the background and on the 'N' character with its filled and hollow crosses, and the high-frequency, high-contrast radial burst inlaid in the 'S' character, can we see the massive, remarkable difference in motion clarity that ULMB 2 offers on the PG248QP. We were missing all this information with our old pattern. That's been remedied now.
The New Pattern: Inverse Ghosts, The Dreaded Red Phosphor, And Keeping It All Synchronized
Now that the pattern speed had been decided and pixel-level detail had been added, we next tackled the lack of color transitions that our current pattern exposes. To measure the full performance of a monitor's pixel response times, we previously measured 30 different gray-to-gray (GTG) transitions. With our new test bench update, however, we've more than doubled that to 72 unique GTG combinations so we can more comprehensively capture a full "picture" of a display's performance, even allowing us to measure dark color transitions that many VA displays struggle with.
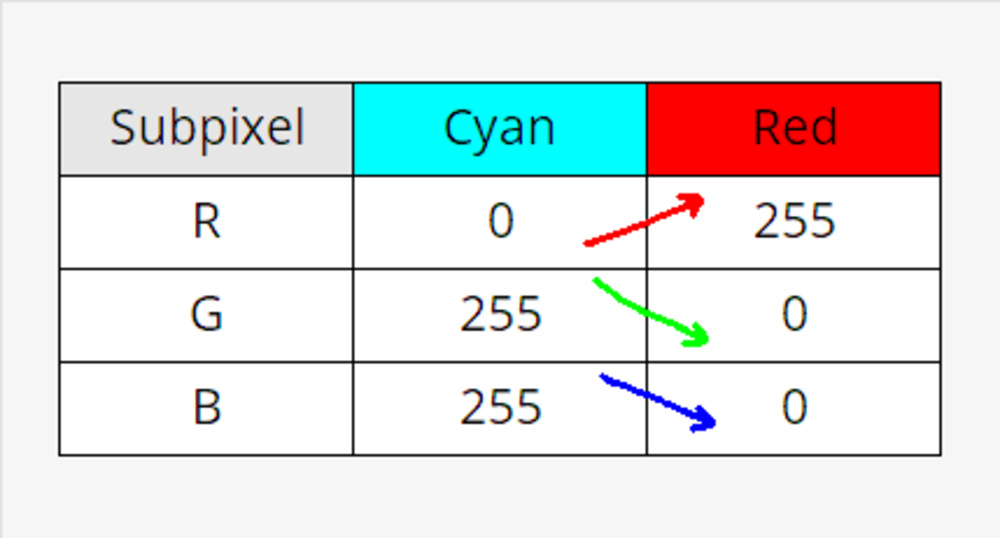
Why only measure grayscale transitions when games are full of colors? The individual red, green, and blue subpixels that make up each pixel are all based on the same technology, whether liquid crystal or organic LED, and in almost all cases, their performance is identical. For example, a cyan-to-red transition is composed of three separate subpixel grayscale transitions:
Grayscale response time measurements can accurately characterize a panel's motion performance, even in color! Any pursuit pattern, though, ought to use color to accentuate the response time data, and there are a few specific color transitions, like purple and green, that are especially good at showcasing bad response time behavior, whether that's excessive overdrive or slow pixel response. Unfortunately, our current pattern is missing most of these. Frustratingly, this leads to many monitors with vastly different response times having pursuit photos that look pretty much the same, even though, in reality, they look quite different when playing games.
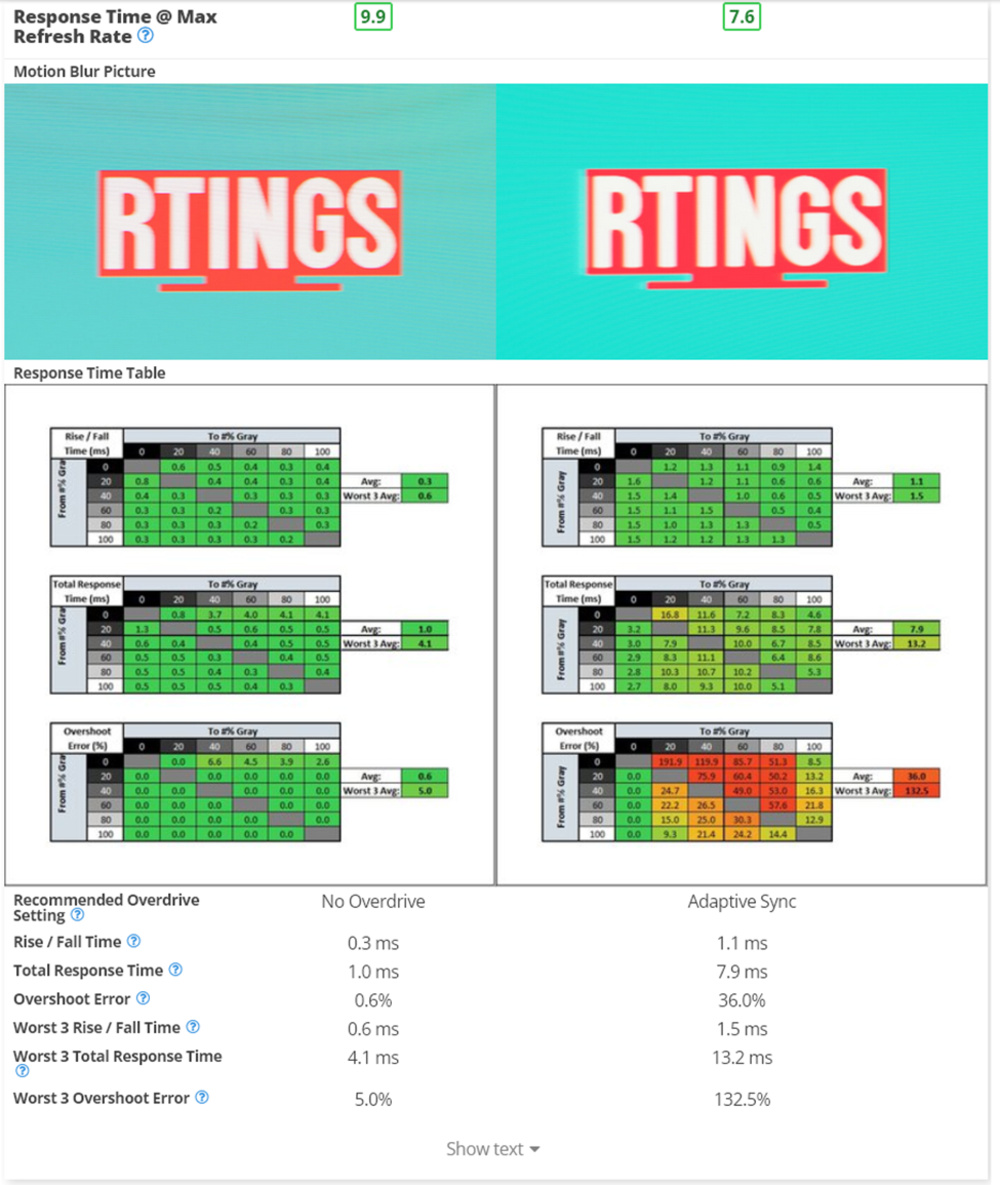
In particular, the old RTINGS.com pattern doesn't effectively show overshoot behavior. We started our investigation into overshoot by comparing the Samsung Odyssey OLED G9/G95SC S49CG95 with the similarly, and unfortunately named Samsung Odyssey G9, which uses a VA panel. The OLED scores a nearly perfect 9.9, with essentially instant response times and no overshoot. Its VA cousin, the regular Odyssey G9, has some of the worst overshoot and inverse ghosting we've ever measured. However, we found that the difference is barely perceptible when viewing their respective pursuit photos.
RTINGS.com pursuit photo comparison of the Samsung Odyssey OLED G9 and Samsung Odyssey G9
Finding The Perfect Colors For An Imperfect Display
The goal was clear right away: we needed to survey as many possible color combinations as we could, foreground and background, light and dark, and we needed to check how these appeared in motion on different panel types. Specifically, we tailored our search to find color transitions where overshoot, also known as inverse ghosting, has the most pronounced and visibly distracting appearance. Then, all we had to do was find a monitor with terrible, ridiculous, egregiously bad overshoot.
LG 32GR93U-B's Faster overdrive mode exhibits excessive overshoot which wasn't properly captured with our previous pattern
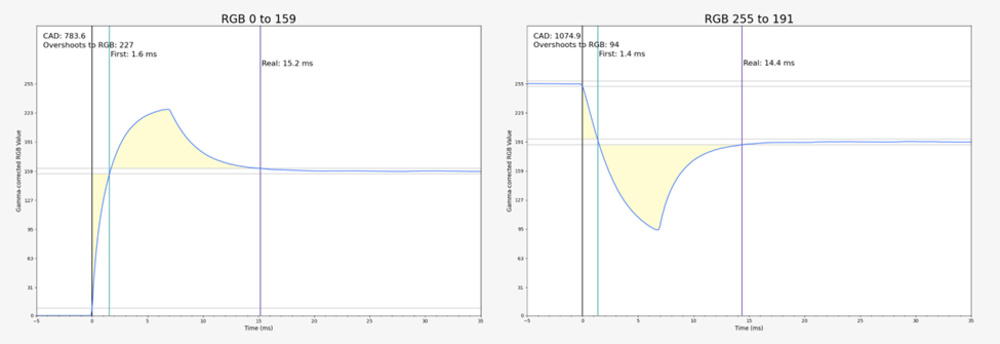
Gamma-corrected rise and fall transitions for the LG 32GR93U at overdrive Faster, 144 fps.
Our display of choice was the LG 32GR93U-B, an excellent 32-inch 4K gaming monitor that we rated quite highly. While this may seem odd, LG ships this monitor with an overdrive mode they call Faster, which excessively boosts pixels well past their target level to speed up the initial rise. Modes like this are common in many gaming LCDs because they allow the manufacturer to claim their display has 1ms response times, because, as you'll see in the gamma-corrected response time data we've captured, this is true. Many of the transitions easily reach their target level well within one millisecond, but almost invariably, the response overshoots well past its target! These "shark-fin" responses are responsible for the grotesque inverse ghosting we desperately want to avoid when playing games.
 Cyberpunk 2077 screenshot scrolling on the LG 32GR93U-B with the "Fast" overdrive setting on the left and "Fastest" on the right.
This mode is unusable in practice due to its severe and prolonged overshoot, but our old pursuit photo is deceptively good, or at least not bad enough! This leads to a mismatch between what we're presenting visually with the photo and our objective response time measurements, something we were eager to correct.
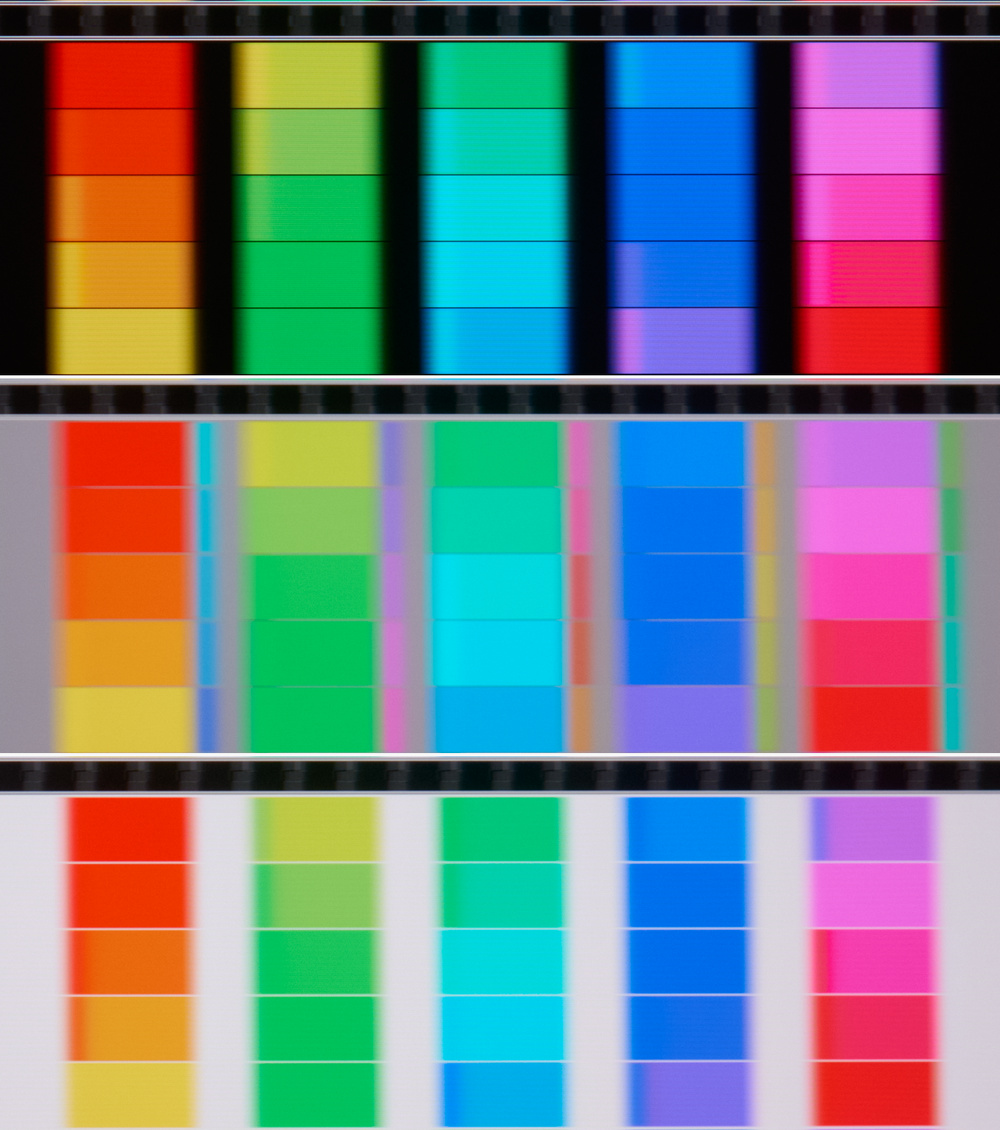
With our pursuit camera set on its slider, we loaded Smooth Frog and captured photos of the Python-generated color patterns against black, grayscale, and white backgrounds. Note that these patterns are moving to the left, opposite the direction our RTINGS.com pattern moves.
Hue cycle patches in pursuit photo of LG 32GR93U-B at 144 fps, overdrive Faster. Panning speed 2160 px/sec.
Against the white and black backgrounds, no overshoot is possible on the trailing edge (right-hand side) of each patch, so any overshoot we see is on the rising edge as black and white transition to each color. A few trends stand out. The primary additive colors (red, green, and blue) have almost no visible overshoot, even though we know from measurements that they do. Similarly, the secondaries also have little to no visible overshoot. However, the tertiaries (orange, chartreuse, spring green, azure, violet, rose) have easily visible overshoot.
More powerfully, though, the colors against the mid-gray background produced visible inverse overshoot for every test patch. In particular, the blue-to-yellow and red-to-cyan overshoot conditions were the most visually striking. Because the RTINGS.com pursuit pattern is primarily red on cyan, this inverse overshoot was, unfortunately and inadvertently, hidden! This explains why the pursuit shot of the 32GR93U-B with overdrive Faster was deceptively good. But what grayscale value showed this "inverse ghosting" behavior the clearest? In our testing, a background of RGB 159 produced the "best" results (meaning visually, the worst!).
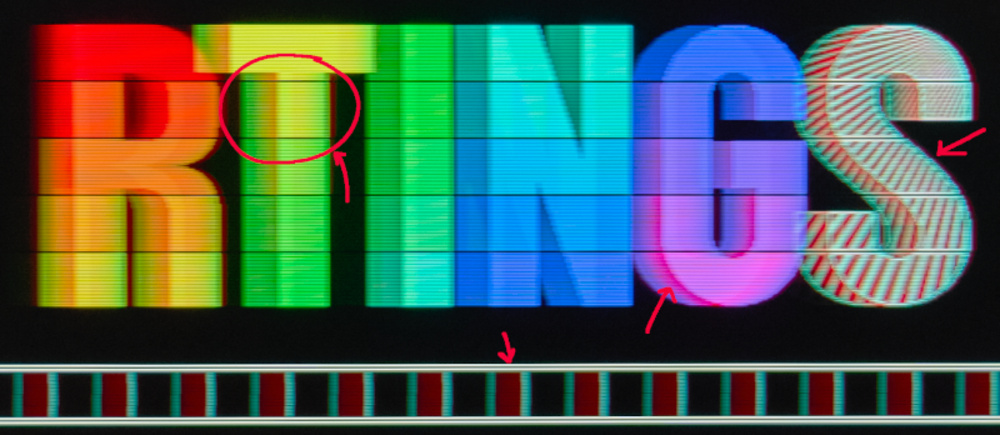
Because of this additional testing, we knew that our new pattern must contain a variety of colors, including those tertiaries, preferably on a mid-to-light gray background. Early development patterns included all 25 colors from our python-generated patches, but as the pattern grew in complexity due to the additional pixel-level detail required, we made a decision that only 12 unique colors, spaced apart by 30 degrees of hue, would fill the R, T, I, and G characters. Each character, except for the trailing edge of the R, would be placed against an RGB 159 background to maximally expose the inverse ghosting problem we see with so many monitors!
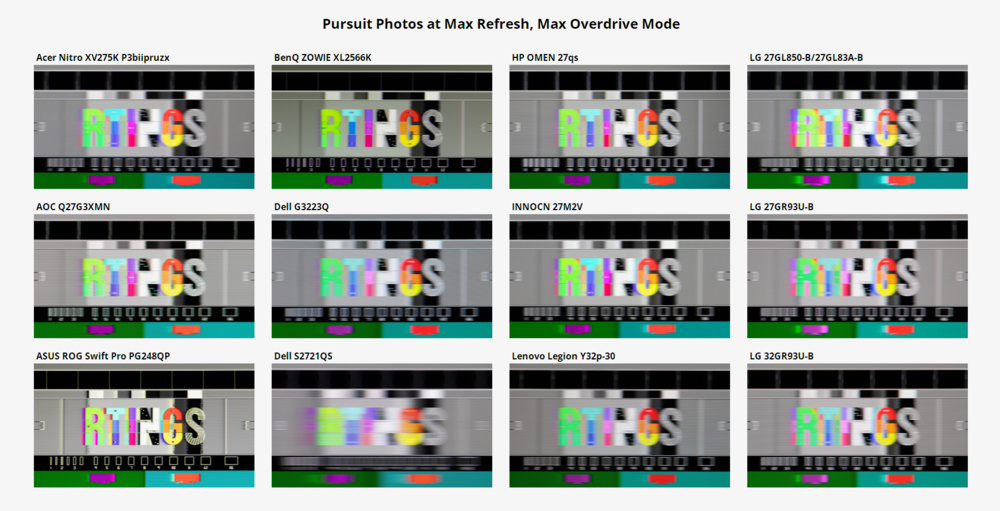
A selection of LCD monitors at their max refresh with the highest selectable overdrive mode. Overshoot, or inverse ghosting, causes distracting visual artifacts in motion.
So far, we've retested more than 25 monitors, many of which are LCDs with selectable overdrive modes. Nearly every tested monitor has grotesque and excessive overshoot at their highest overdrive modes. These modes offer no benefit to the consumer, ruining motion clarity for the sake of deceptive response time marketing. With its larger selection of colors and transitions, we're confident that our new pattern will highlight this bad behavior and hopefully discourage manufacturers from including these modes. It'll also enable us to make much better decisions about which overdrive modes we recommend because any irregularities or problematic inverse ghosting will be easier to discern.
Potassium Fluorosilicate Phosphors Ruin Backlight Strobing
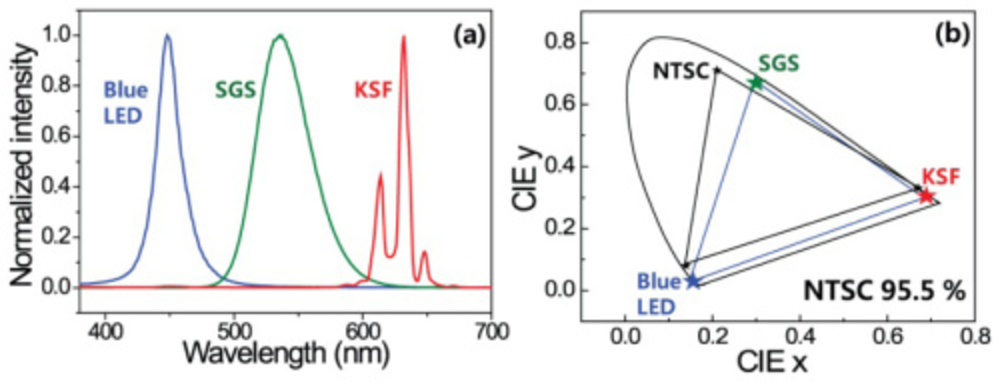
Potassium fluorosilicate (KSF or PSF)phosphors are often used in the construction of backlight LEDs to extend their gamut coverage in the red channel. Excited by ultraviolet light, the KSF phosphor emits deep red light in very narrow spectral peaks. But unlike the Yttrium Aluminum Garnet (YAG) phosphors that produce white light from blue excitation, KSF phosphors have a significant decay time after the exciting light is removed, which means they still glow red for several milliseconds even after the exciting light source has been removed. Normally, this is not a problem because most monitors and televisions operate in sample-and-hold mode, which means their backlights are always illuminating. But many monitors offer blur reduction modes by utilizing backlight strobing (BFI, ULMB, ELMB, etc.), where the backlight is cycled on and off to mimic the behavior and increased motion clarity of CRTs. For monitors that use this gamut-extending KSF phosphor, each new backlight pulse excites a brilliant glowing red. However, as soon as the pulse is over, the slowly decaying red emission can still be seen in the periods where the backlight should be completely dark. We see this as a phantom red trail. Or, more accurately, we should see this, but with the old RTINGS.com pattern, we don't.
Pattern detail: old vs. new. Red KSF phosphor trails went from nearly impossible to notice to easily visible on the Lenovo Legion Y32p-30 during strobing at 120Hz.
Our goal for creating a new pursuit pattern was to catch and capture any aberrant response time or backlight behaviors so that we could present a full and accurate picture to our audience. However, adapting our pattern to showcase this KSF phosphor behavior was going to be challenging. We knew that a light color palette, and in particular the red/cyan combination the old RTINGS pattern used, was not at all effective at showing the drastic red trailing that was visible during gameplay with backlight strobing enabled on monitors such as the ViewSonic Elite XG270QG (one of the first to ship with visible red ghosting), the Lenovo Legion Y32p-30, the HP OMEN 27qs, the Gigabyte M32Q, and many others.
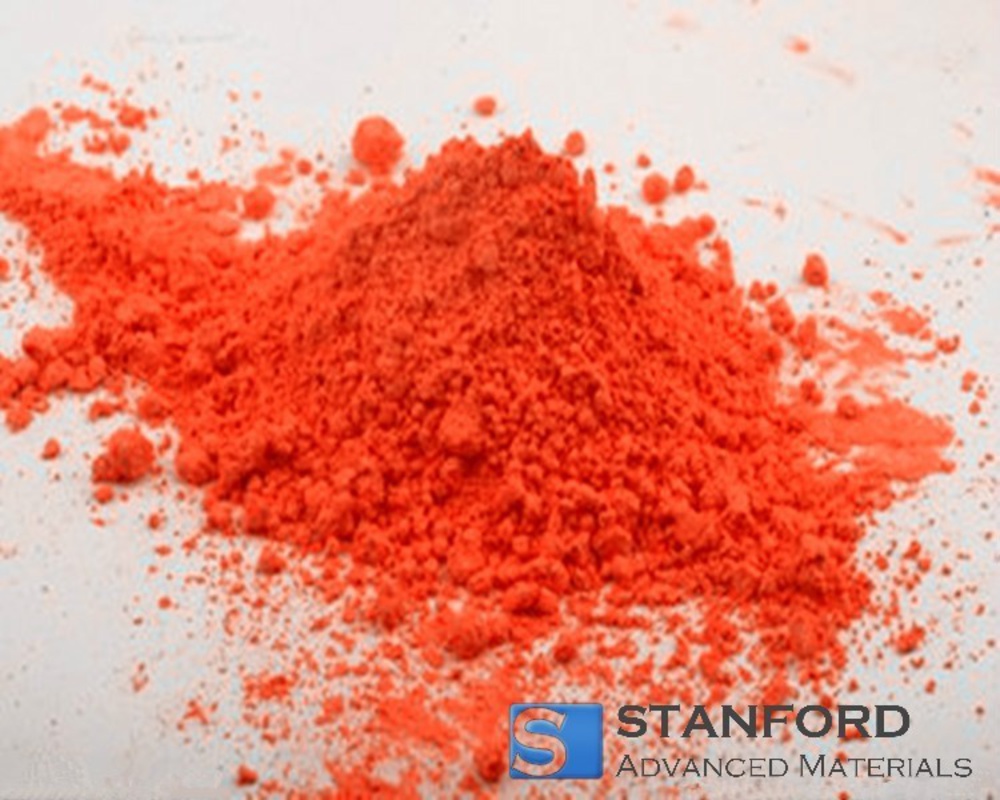
Stanford Advanced Materials PM2664 KSF Phosphor Powder.
An analysis of wide color gamut of green/red bilayered freestanding phosphor film-capped white LEDs for LCD backlight, Ji Hye Oh, Heejoon Kang, Minji Ko, and Young Rag Do.
Our choice to use a light gray background to expose excessive overshoot and inverse ghosting came with the downside of drastically reducing the visibility of the red phosphor trail. Our conclusion: at least some portion of the new pattern must have a dark background. Using our early development pattern against pure black, we wanted to photograph and find which pattern characteristics or colors best illustrated or excited the phantom red trail in a pursuit shot. Disappointingly, very few color transitions adequately produced significant and visible trailing. Yellow and magenta showed some promise, but interestingly, the high contrast, high frequency black/white pattern inlaid in the 'S' (and really any black/white transition like the vertical bars composing the sync track) showed the tell-tale red ghosting and chromatic aberration effect best.
Pursuit shot of the pattern mockup against a black background. ViewSonic Elite XG270QG at 120Hz.
The solution was simply to place the high-contrast, high-frequency 'S' against a black background. This achieved several outcomes we wanted: we could maintain the light gray background that does a great job of exposing overshoot behavior while simultaneously eliciting a severe chromatic aberration-like effect for monitors that use the KSF phosphor. Additionally, and fortunately, both the MPRT indicator and the sync track, which we'll cover soon, also show significant red ghosting in these monitors.
Final pattern: backlight strobing pursuit photo of the Lenovo Legion Y32p-30 at 120Hz.
Size And Sync: Keeping Our Pursuit Photos Consistent And Comparable
There are a lot of exciting, interesting, fun tests that happen at the RTINGS.com office, but taking pursuit shots is not one of them. While we love the value they provide for our reviews, actually taking the pursuit shots is time-consuming and difficult and requires a lot of skill from our testers. Once the pattern is placed in Smooth Frog and the correct frame rate and panning speed are selected, the testers must physically slide the camera on our camera rail expertly matching the pattern's speed, centering the pattern in the frame, and taking a shot before the pattern leaves the screen. Faster panning speeds are more difficult to track, and we've now doubled our panning speed from 960 PPS to 1920 PPS, making their work even harder.
With that said, all our new pursuit shots will now show the sync track in the frame. We've wanted to do this for a while, but with the additional pixel-level and high-frequency detail in the new pattern, our photography must be exceptional, and we intend to show that with the sync track. Errors in tracking are a problem of technique rather than deficiencies in the motion performance of a monitor, and we have to be extra vigilant that our pursuit photography captures only the monitor's performance, not ours.
Pursuit camera technique with new pattern.
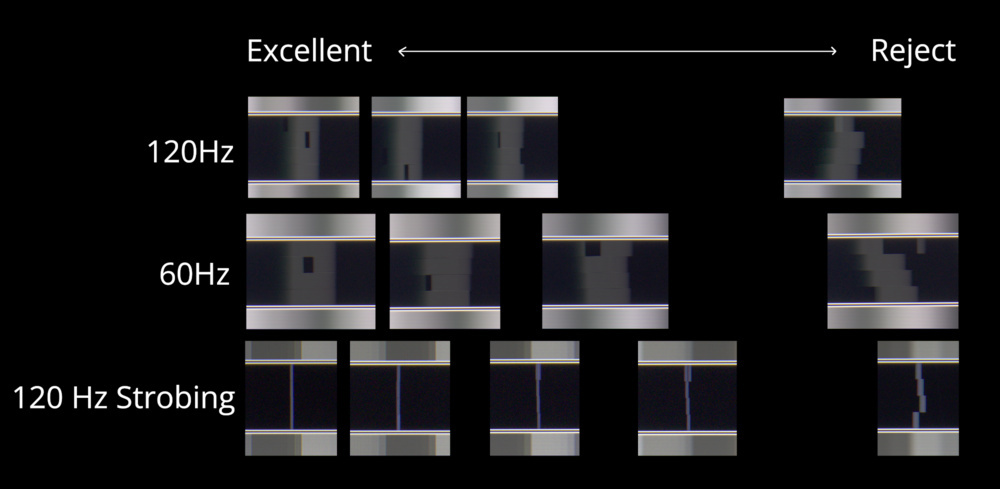
RTINGS.com internal sync track alignment guide for accepting or rejecting pursuit photos for reviews
To ensure that we've accurately tracked the pattern over four full frames, we use the 4-bar sync track invented by Mark Rejhon from Blur Busters. If our tracking is correct, the bars will show perfect vertical alignment. If, however, our camera's speed doesn't precisely match the pattern's speed, the bars will appear irregularly staggered, which means the shot is invalid and must be discarded since it doesn't represent what our eyes see when tracking motion on a screen, like when playing fast-paced games. Extremely precise tracking allows us to show motion detail that we would never have been able to see with the previous pattern.
Pursuit photo of ULMB 2 on the ASUS ROG Swift Pro PG248QP at 360Hz with excellent tracking even at 1920 PPS. Differences between pulse widths now manifest as distinct clarity differences.
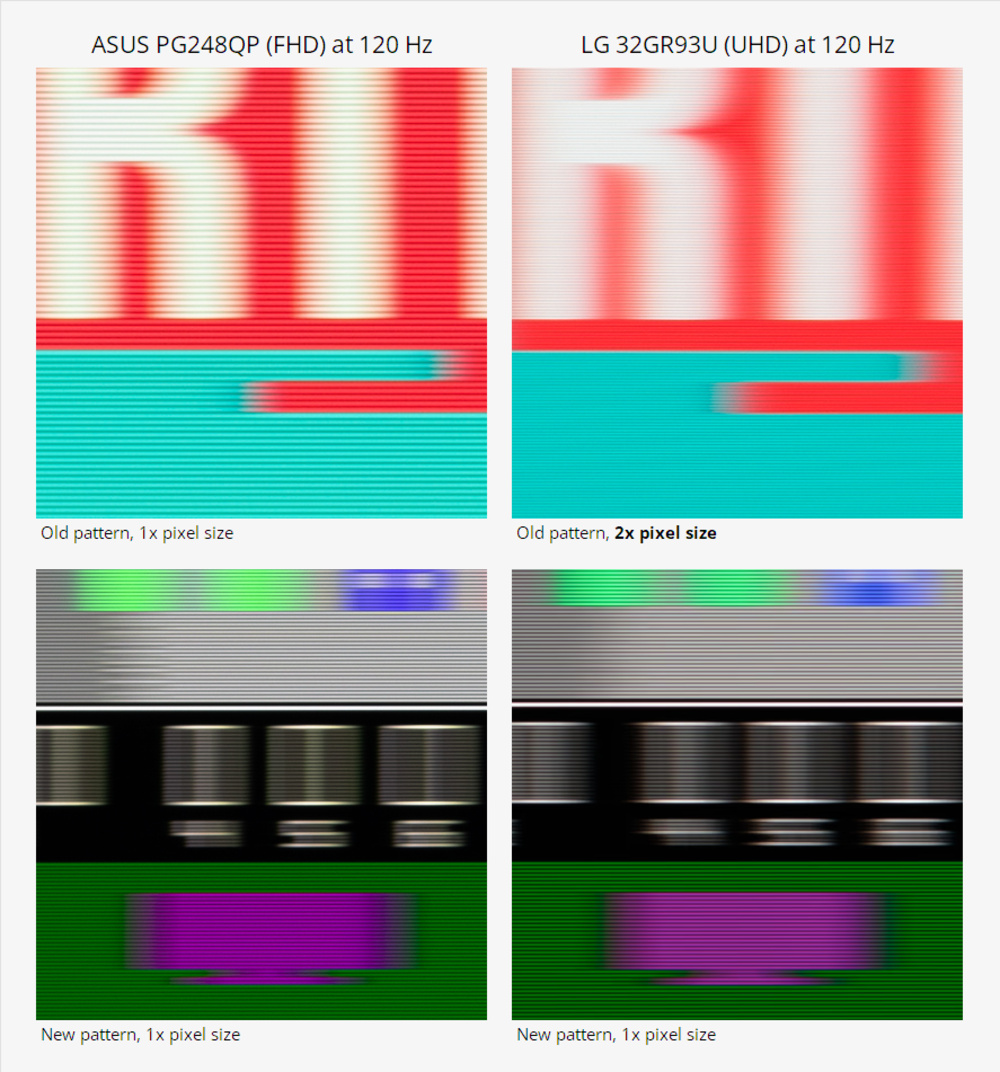
Another change we wanted to make was to ensure that the pattern pixel size remained constant for every monitor we test. Currently, several versions of our RTINGS.com logo are used depending on the monitor's resolution. The panning speeds are adjusted to account for this pixel size difference, but it makes using the pursuit photos as direct comparisons difficult for monitors with different resolutions. For example, comparing 100% crops of our pursuit photos for the 1080p ASUS ROG Swift Pro PG248QP against the 4k LG 32GR93U-B is exceedingly difficult because the 4k pattern is actually double the resolution of the 1080p pattern, and the difference in magnification when we take the photo makes both the pixel rows and their structure take up entirely different scales. Mixing pixel performance with pixel density isn't something that should be done when the purpose of the pursuit shots is to isolate only the motion performance of a display.
Variable pattern resolutions make comparisons between monitors difficult because pixel motion performance is mingled with pixel density.
With our new pattern, we've enforced a standardized size and magnification that we'll use for every pursuit photo we take. We can now make direct comparisons across a broad range of monitors at any resolution! Everything from minute pixel detail, pixel persistence blur, and even subpixel layout can be easily seen and compared side-by-side. This change was also necessary because individual pixel detail can't be maintained at pattern sizes that aren't integer multiples of each other. This would mean that QHD panels (2560x1440) would always be disadvantaged compared to 1080p/4k models, something we specifically set out to correct. The sync track, in combination with a standardized pattern size, means that our pursuit photos will now be extraordinarily accurate and easily comparable across every monitor we test.
Conclusion
Changing the familiar pursuit pattern we've used at RTINGS.com for a long time was challenging but exciting. We knew that our pattern also had to improve as monitors kept getting faster and faster, shipping with higher maximum refresh rates, improved LCD pixel performance, and advanced backlight strobing modes. Breaking legacy comparability was a tough choice, but we've made rapid progress in bringing the new pursuit pattern to more than 25 of our most recent reviews, with more to come soon, and the results are incredible. We're seeing excellent delineations between panel types with the new pursuit pattern, and exceptional monitors, from OLEDs to 540Hz TN panels, now show their true motion clarity benefits, something we weren't capturing before.
