- Table of Contents
- Intro
- When It Matters
- Our Tests
- Additional Information
- Conclusion
- Comments
Gradient handling is an important part of picture quality. It helps deliver better details in the shadows and minimizes banding, especially if you want to game in HDR, view HDR content, or create content. Understanding color depth can help you make a better buying decision or even help you save some money. This article discusses why it matters, the differences between 8-bit and 10-bit color depth, and how we score gradient handling in our monitor reviews.
Test results
When It Matters
Gradient handling is important when viewing scenes with different shades of the same color, such as a blue, sunny sky, where the blue would become lighter the closer it is to the light source. Bad gradient handling makes the transition from one shade to the other more visible. This happens when two shades that are supposed to be similar look very different, or when two shades that are supposed to be different end up looking the same, resulting in banding. Below, you can see clear banding on the LG 32GK650F-B, while the Dell U2718Q is almost entirely smooth.
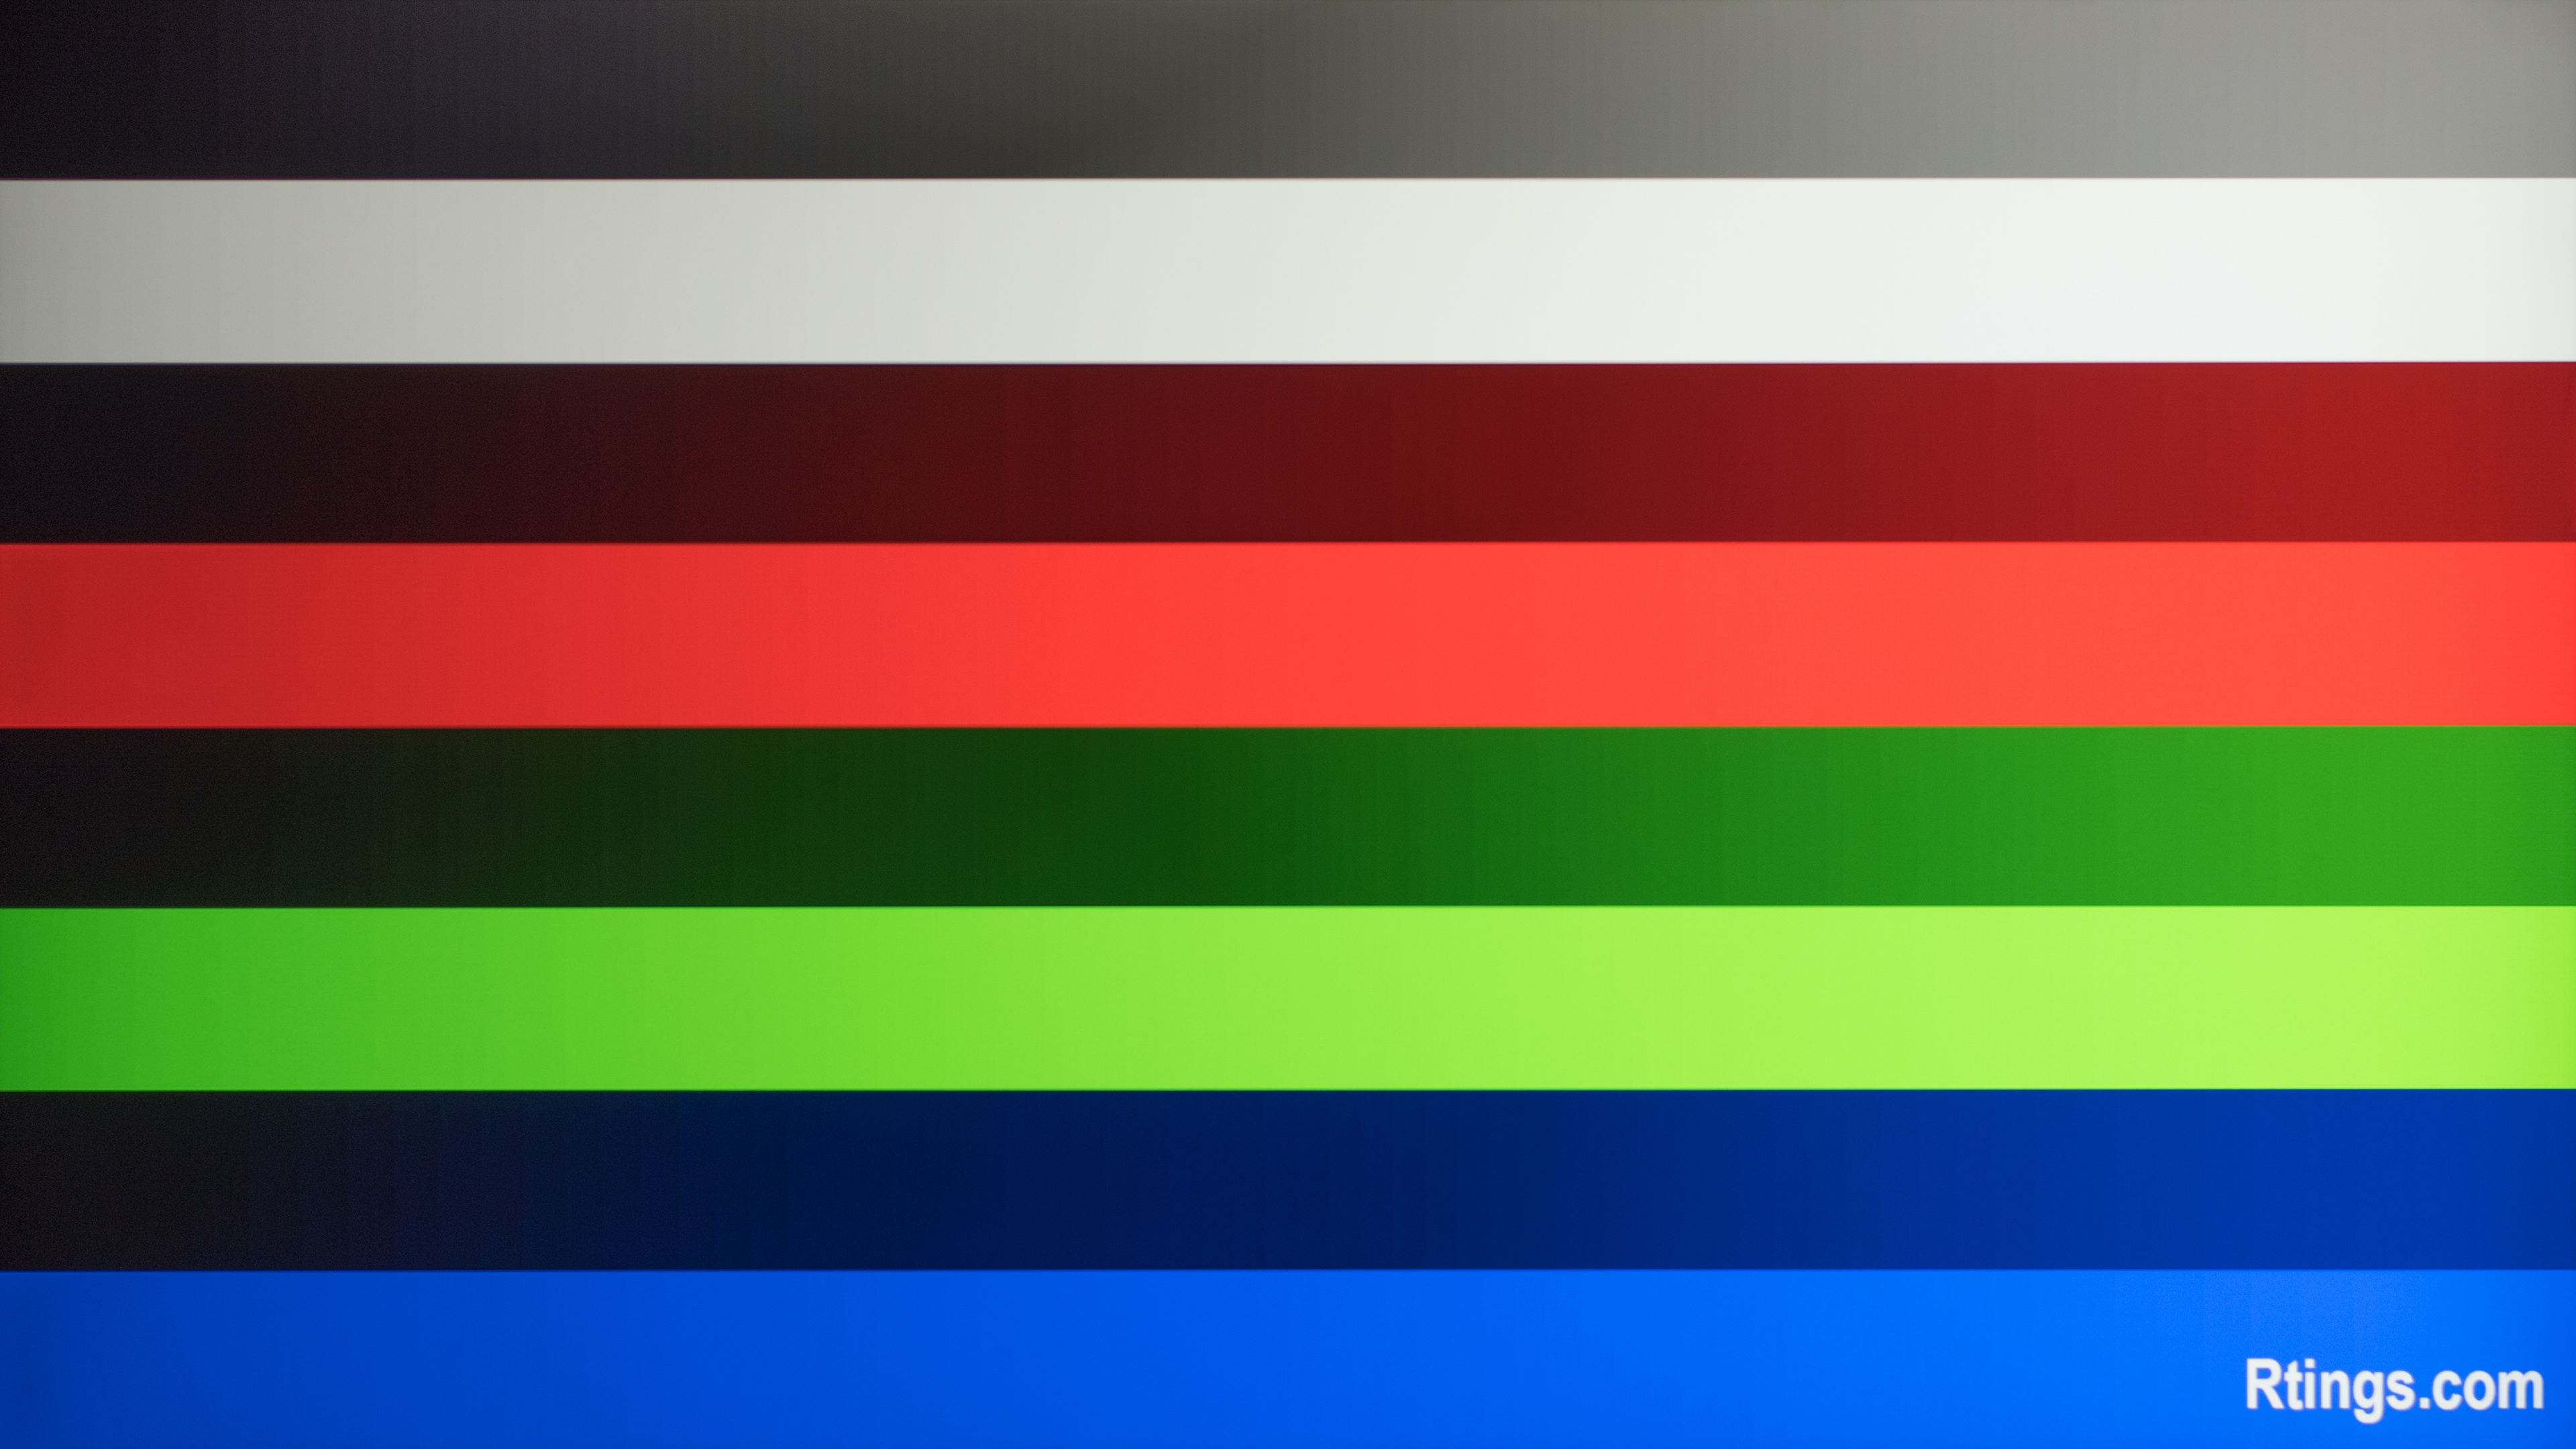 Visible banding on 8-bit panel (LG 32GK650F-B)
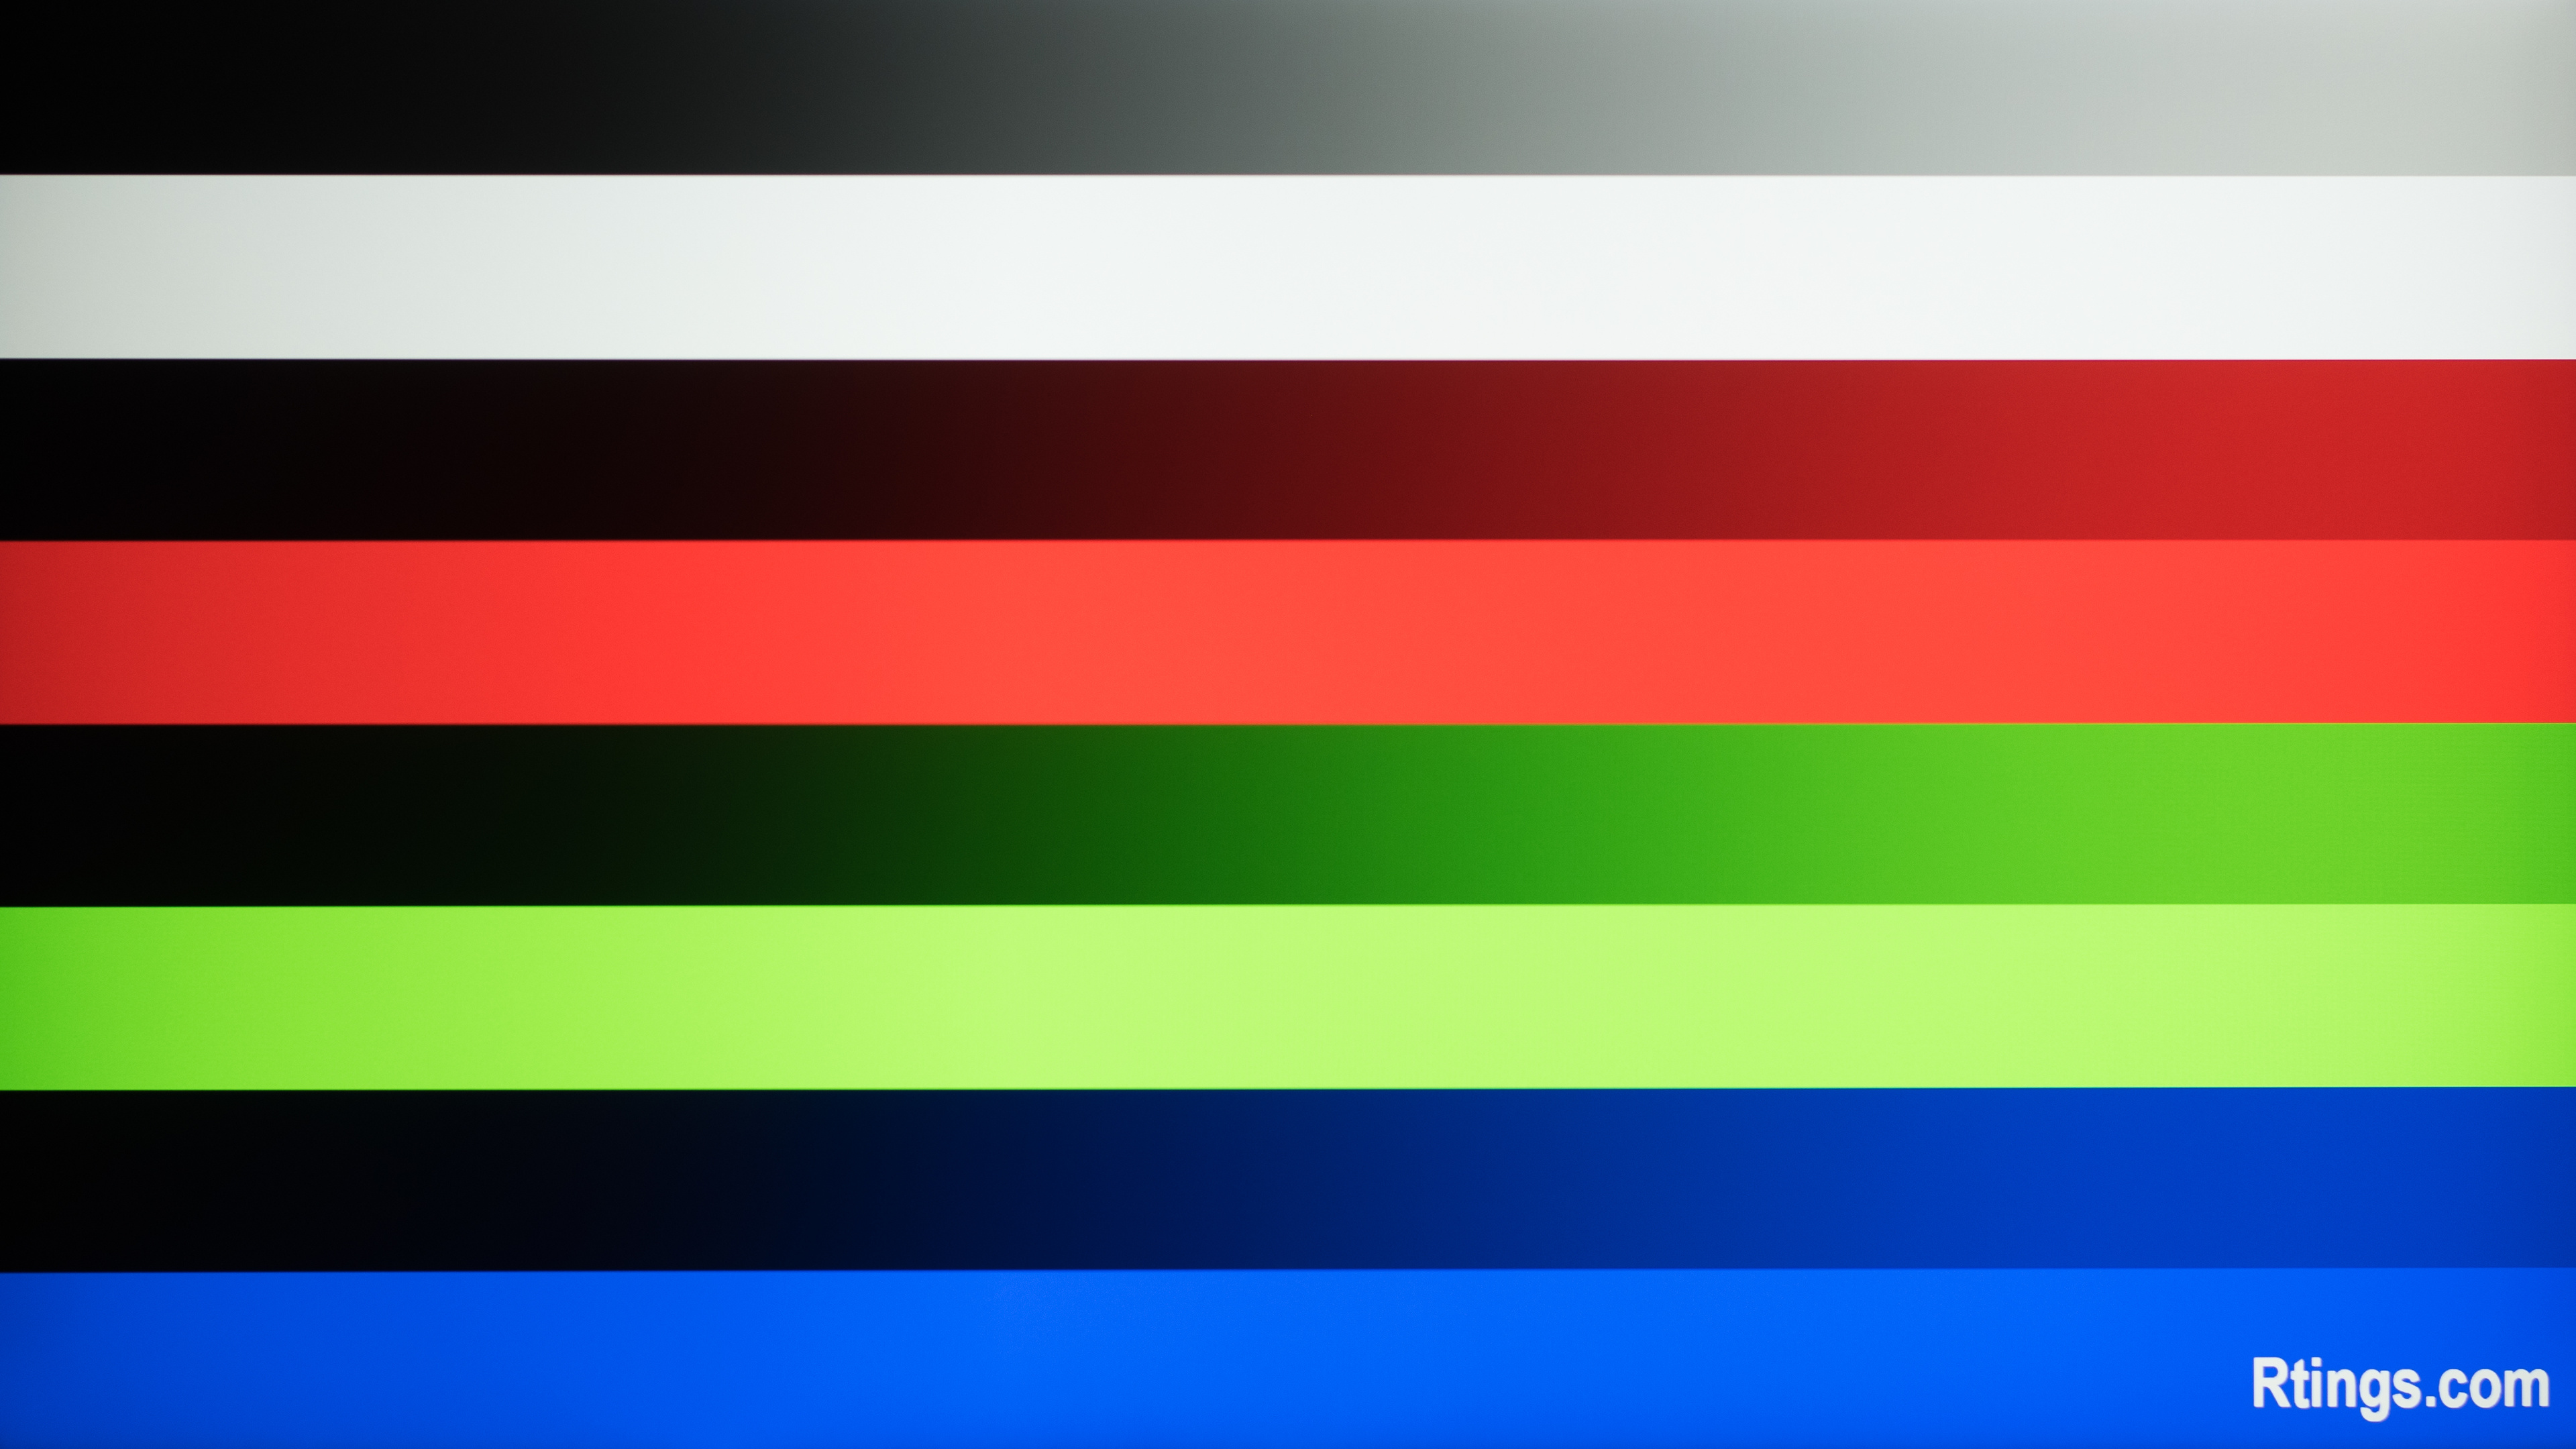 Good gradient handling at 10-bit (8-bit+FRC) (Dell U2718Q)
Our Tests
Setup
For our test, we only use a Nikon D750 camera and a PC connected to the monitor being tested. We ensure that the monitor is in SDR mode with local dimming off (if applicable), and we set up the camera with an F4.0 aperture lens, a 1/15 sec. shutter time, and an ISO of 200.
Tests
1 - The first step is to determine whether a monitor has an 8-bit or 10-bit panel. We do so by verifying in the NVIDIA Control Panel whether the color depth can be set to anything other than 8-bit. If the control panel allows us to set it to 10-bit, we consider it 10-bit, even if it's 8-bit+FRC.
2 - The second step is to take a photo of the screen in a dark room displaying our gradient image. The image is displayed through the NVIDIA 'High Dynamic Range Display SDK' program. For 8-bit monitors, we display the image at 8-bit without any other process. However, for 10-bit panels, we first open the gradient image, then change the Tonemap Mode to 'Linear', which is essentially a passthrough mode. Before taking the photo, we adjust the brightness so the brightest part of the image is at 100 cd/m² (on the right side of the second row). After taking the photo, it's uploaded into Adobe Lightroom, where we apply a custom preset and crop the image to a 16:9 format.
Scoring
To score the gradient, we run a batch file that divides the photo that we took into smaller sections. These sections are then presented to two testers, one at a time, who then determine whether there's banding or not. Three points are awarded if there's no banding, two points if unsure, and one point if there's banding. These points are then tallied and translated into a score out of ten. If the testers' scores differ, a third tester is brought in to perform the test again. We deduct a point for an 8-bit panel, which means the highest score for an 8-bit monitor is 9.0. That said, an 8-bit monitor can still score higher than a 10-bit one, as some 10-bit monitors don't handle gradients well, and some 8-bit ones are very good at it. We don't make any distinction between 8-bit+FRC and native 10-bit since score according to how smooth the gradients look.
Additional Information
8-bit vs 8-bit+FRC vs 10-bit
The main difference between an 8-bit and 10-bit panel is the number of colors they can produce; an 8-bit panel can display 16.7 million colors, while a 10-bit panel can display 1.07 billion. However, many modern 8-bit displays use a technique called 'dithering', allowing them to produce as many colors as a native 10-bit panel. 'Temporal Dithering' (also known as Frame Rate Control or FRC) produces certain colors by cycling between the adjacent shades. This type of flickering isn't visible most of the time, but when it is, it's usually in the darker shades. The other technique is called 'Spatial Dithering', which places the two adjacent shades very close to each other to trick the eyes to see an intermediate shade, but it isn't used as often as FRC. As you can see below, there's less banding on the Dell U2718Q than the LG 48 CX OLED, even though the Dell has an 8-bit+FRC panel while the LG is true 10-bit.
8-bit+FRC (Dell U2718Q)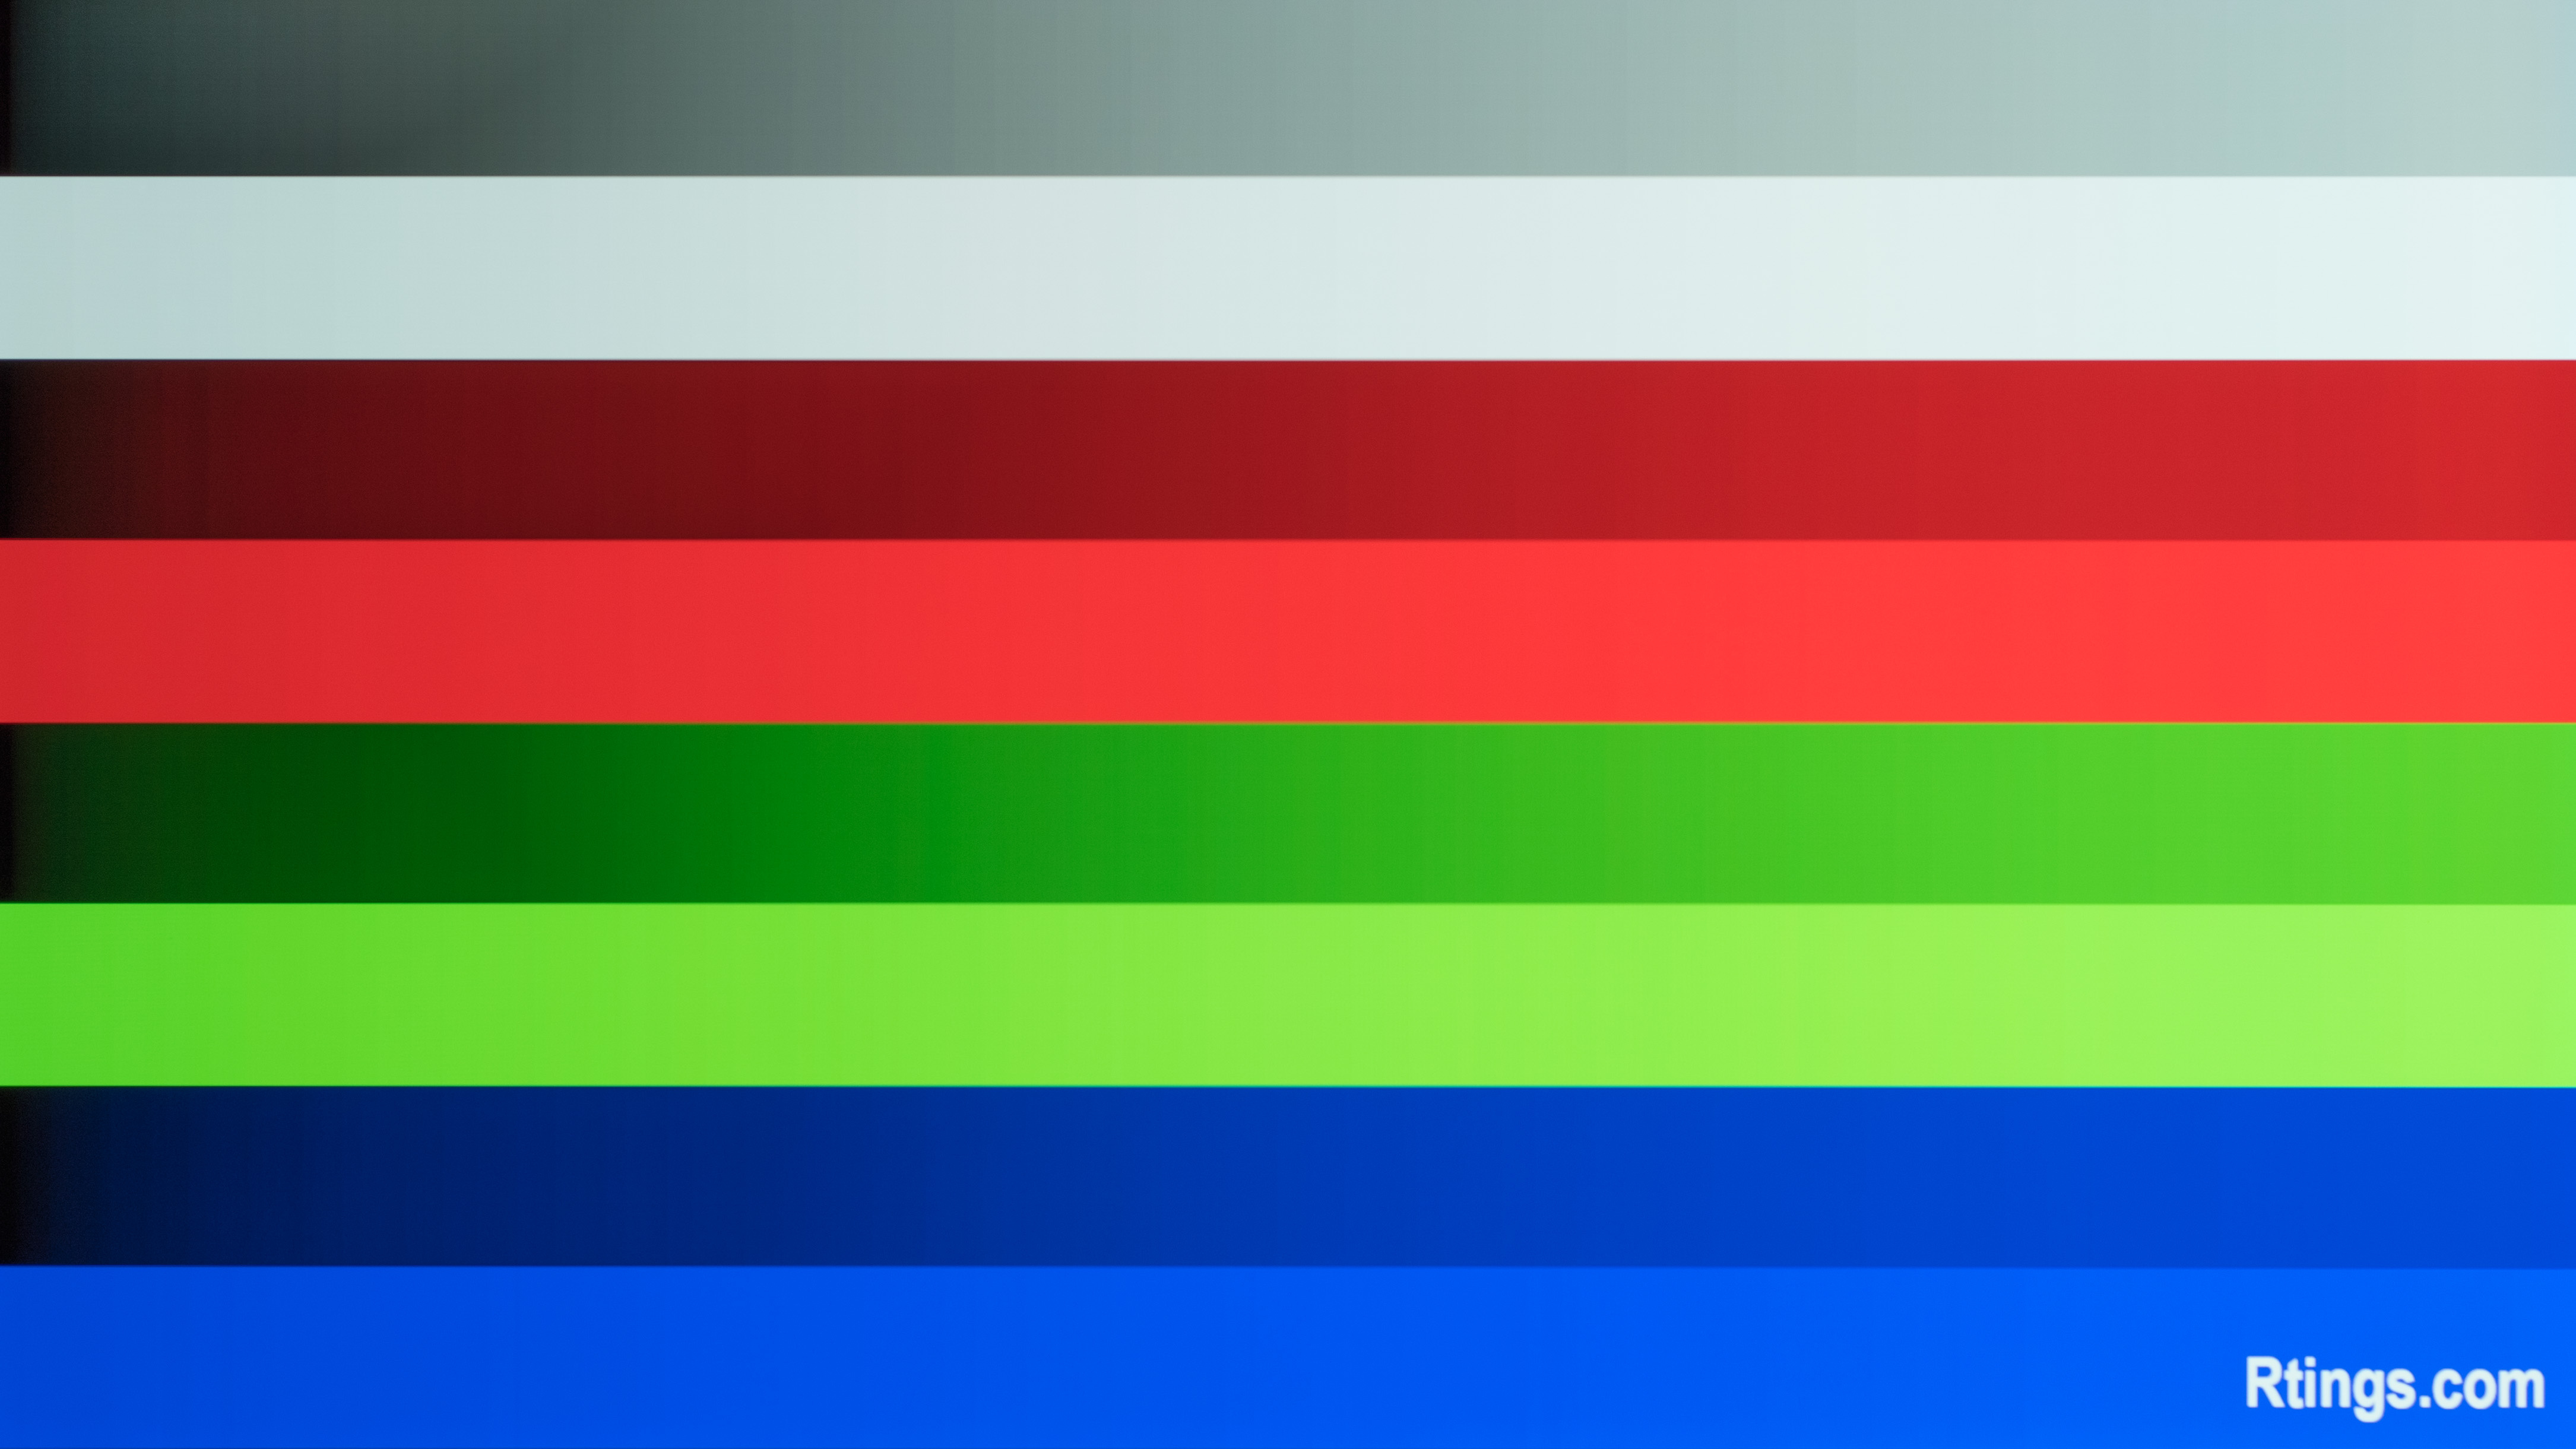 10-bit (LG 48 CX OLED)
Conclusion
While gradient handling is an important part of picture quality, you don't need to have a 10-bit monitor if you're only using it for general productivity, web surfing, or viewing videos online since most content is still in 8-bit. However, if you're a content creator, sensitive to the flickering on an 8-bit+FRC panel, or want a better HDR experience, it might be worth getting a true 10-bit monitor.
Recommended Articles


Best Monitors For Gaming


Comments
Our Monitor Picture Quality Tests: Gradient: Main Discussion
What do you think of our article? Let us know below.
Want to learn more? Check out our complete list of articles and tests on the R&D page.
Update: We’ve updated the CPI graph displayed in the Sensor Latency section of this review. Our results remain the same, but these graphs have two new columns with results from the Delay At Half Movement and Delay To End Of Movement tests.